Key Points:
- The share of job postings advertising benefits like health insurance, paid time off, and retirement plans has flattened in recent months, especially in low-wage sectors.
- Despite headwinds including inflation, and slowing economic growth, employment overall continues to grow at a brisk pace. Demand for workers remains elevated and joblessness is low, leading to strong nominal wage growth for workers.
- Announced layoffs in the tech and media industries are grabbing headlines, but layoffs overall remain low. Total monthly layoffs are about 16% below their pre-pandemic average.
- While job postings remain elevated, they are moderating, with both total postings down and new postings down from a month prior as of March 24, 2023.
- While nominal wage gains remain strong, it has started to soften. However, any descent toward pre-pandemic levels may take some time.
The US labor market has so far remained largely resilient despite emerging stress in the banking sector, ongoing layoffs in the tech and media industries, and mounting economic uncertainty. But employers’ willingness to pull out all the stops to entice job seekers in a highly competitive environment may be reaching its limits, with growth in the share of job postings advertising specific benefits beginning to level off and the overall level of postings coming down.
Spotlight: Benefit advertisements in job postings are leveling off
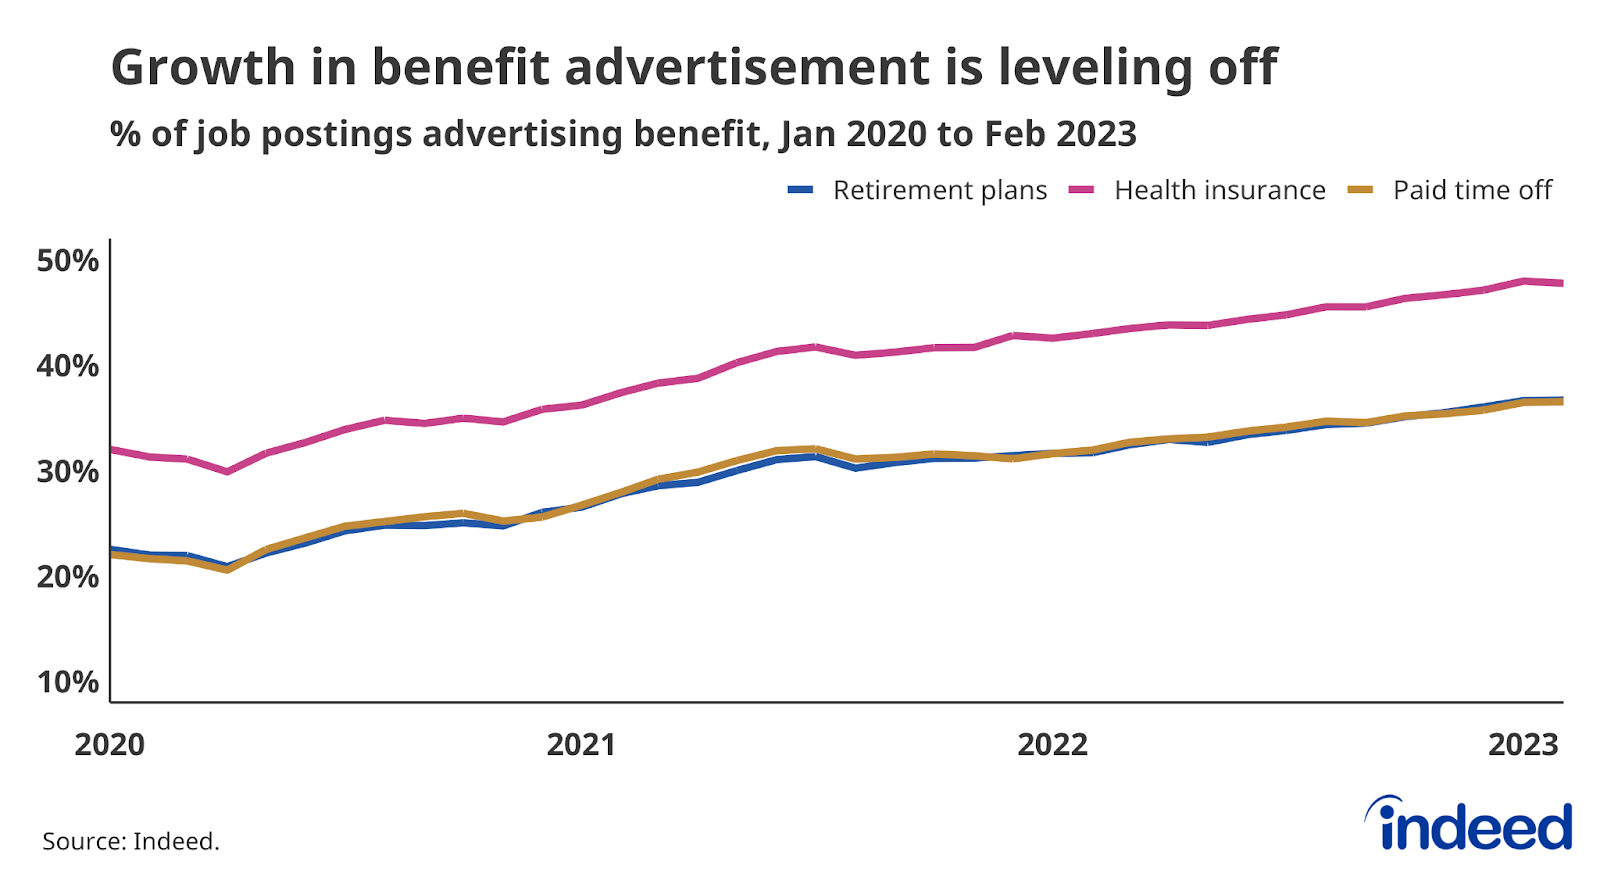
In a tight labor market, employers may use benefit offerings to differentiate themselves and/or to defray rising salary costs, and employers today are more likely to advertise offered benefits in job postings than they were a few years ago. The share of job postings on Indeed that mention health insurance rose from 31% in early 2020 to 48% by February 2023, while the share that advertise retirement plans and paid time off both rose from 22% to 37% over the same period.
But while the overall share of postings specifically mentioning benefits has risen over the past few years, growth has started leveling off in recent months.
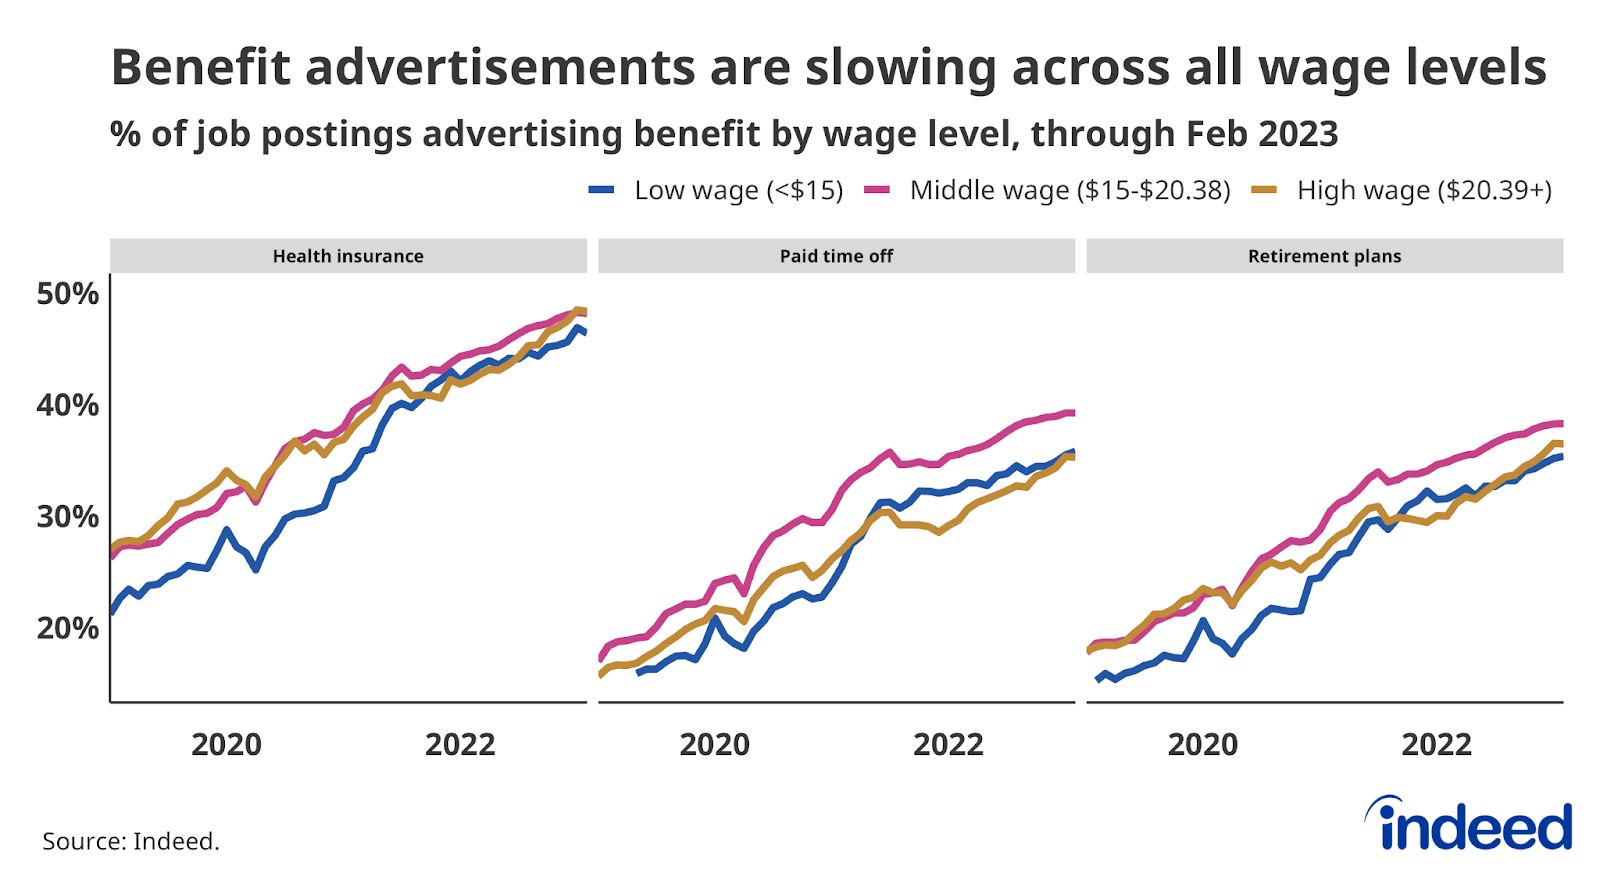
Much of the rise in benefits advertising between late 2020 and early 2022 occurred in typically low-wage sectors including food preparation & service, retail, and childcare. But since then, the pace of growth in low-wage postings has slowed across the three major benefit categories — health insurance, paid time off, and retirement plans. This slowing in low-wage postings is most pronounced for in-person sectors such as cleaning and sanitation, personal care & home health, security and public safety, and food preparation and service.
But while benefit advertisements for low-wage jobs has slowed, ads for similar perks among high-paying positions have risen — with retirement plans experiencing the highest growth among these roles. Since February 2022, the share of jobs advertising a retirement plan in software development, banking and finance, and mathematics, for example, have all grown by more than 50%. Banking and finance and mathematics also saw significant growth in paid time off benefits. This strong growth in high-wage postings is relatively recent and represents a shifting trend across various wage levels.
While many factors may influence a given employer’s willingness to include benefits information in job postings, the persistently tight US labor market of the past few years and historically high nominal wage growth are likely prime candidates driving the growth of the past few years. But the recent slowdown suggests that competition for workers may be softening, with employers feeling less incentivized to use benefits in recruiting workers. On the other hand, the strong growth in benefits advertising for high-wage segments illustrates that the cooling job market may not be felt uniformly. In other words, there are sectors where hiring remains relatively difficult, and where employers may feel compelled to continue sweetening the pot with enhanced benefits in order to attract the best candidates.
Labor Market Overview
The US labor market remains strong. Overall employment continues to grow at a brisk pace and joblessness is low despite still-high inflation, large and rapid rises in key benchmark interest rates, and slowing economic growth. Job postings on Indeed have declined for most of this year, down 14.7% as of March 24 compared to the same period a year ago. Wage growth has cooled recently and some sectors — notably tech and media — are experiencing difficulties. Yet, wage growth is still high by historical standards as demand to hire new workers is elevated and layoffs remain low. In short, the labor market is resilient. However, this resilience may waver as risks to economic growth are elevated due to tight monetary policy and stress in the US banking system.

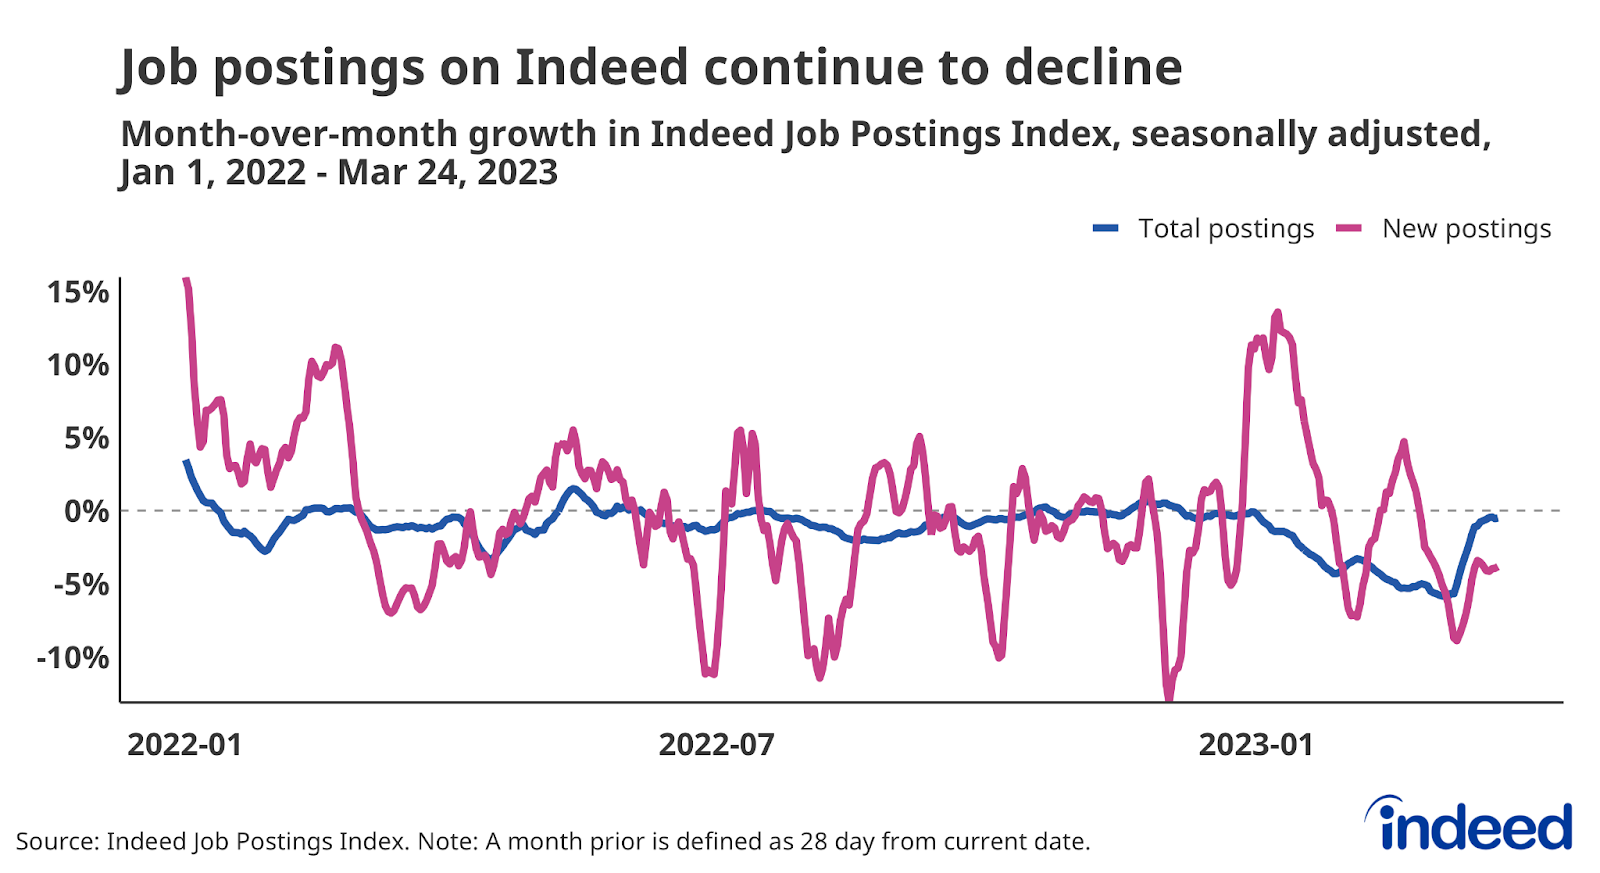
Employer demand for workers remains strong, even if it is fading. According to government data, job openings peaked in March 2022. Yet they still outnumbered unemployed workers and the overall labor force as of the end of January. Indeed’s Job Postings Index — a much more timely measure — indicates that employers’ hiring appetites have faded so far in 2023. Total job postings rose sharply in mid-March but recently began falling again. New postings, defined as those on Indeed for seven days or less, are down 3.8% over over the past month. Both total postings and new postings are still above where they were just prior to the onset of the COVID-19 pandemic.
People have returned to work
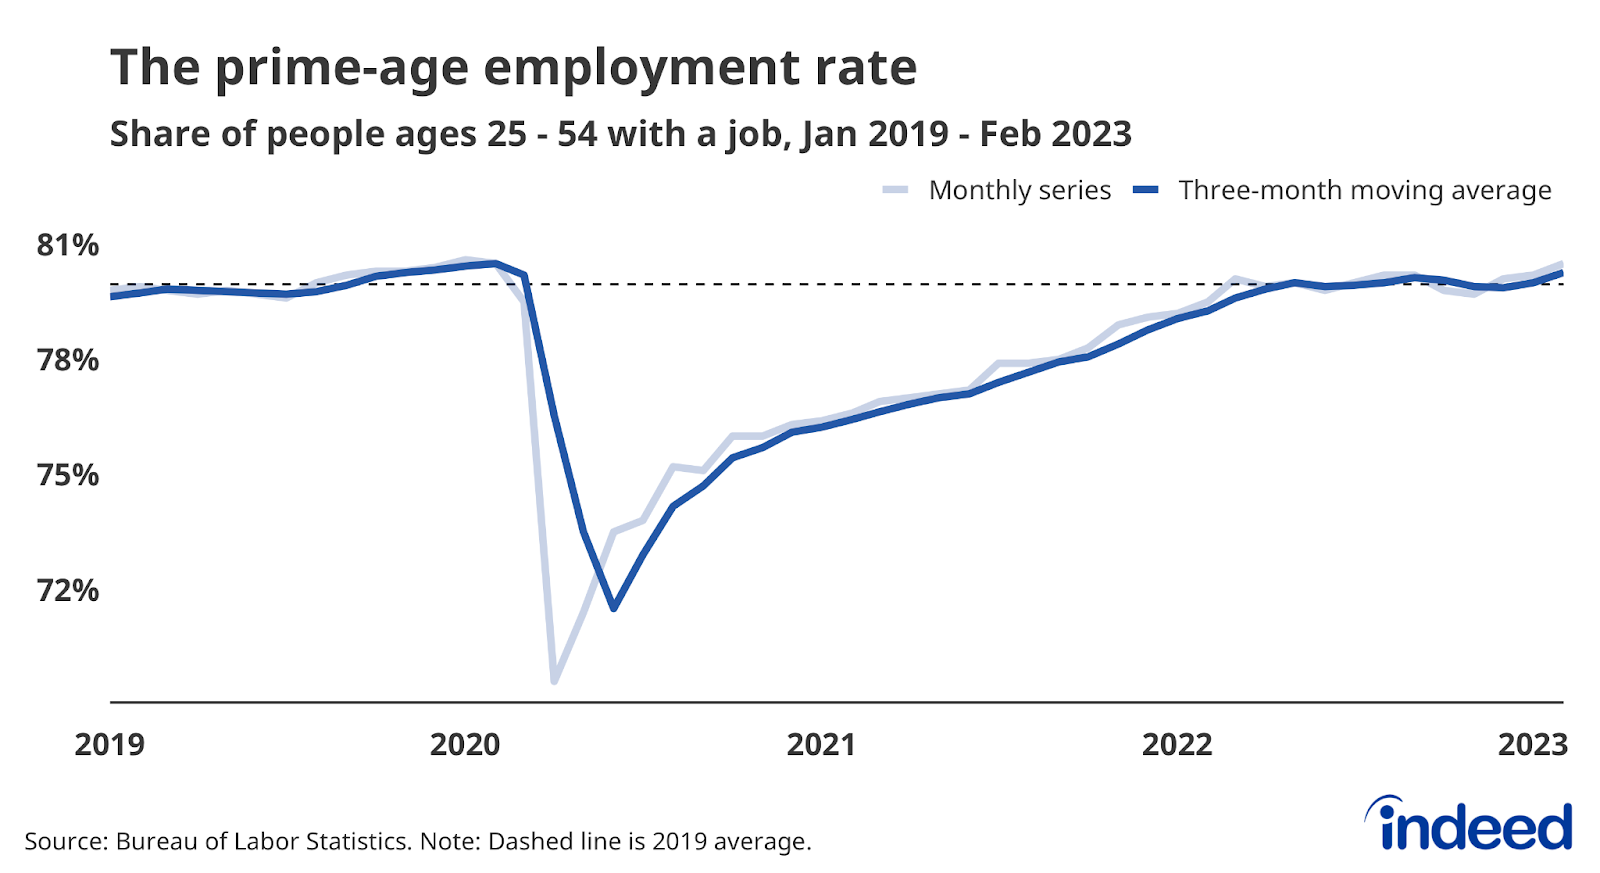
Strong demand has led to robust hiring and more workers finding jobs. Despite concerns about the short-term responsiveness of labor supply, employment rates for core age groups are now back to healthy levels. The employment-to-population ratio for workers ages 25 to 54, a good measure of the health of the labor market, stood at 80.5% in February, in line with its February 2020 peak and above pre-pandemic levels.
Still, the employment rate for all workers was just 60.2% in February, off from its pre-pandemic rate, due in large part to a lagging recovery for older workers. Many people continue to ‘unretire,’ but the recent decline in this trend and a rise in workers entering retirement suggests we shouldn’t expect older Americans to be a significant source of employment moving forward.

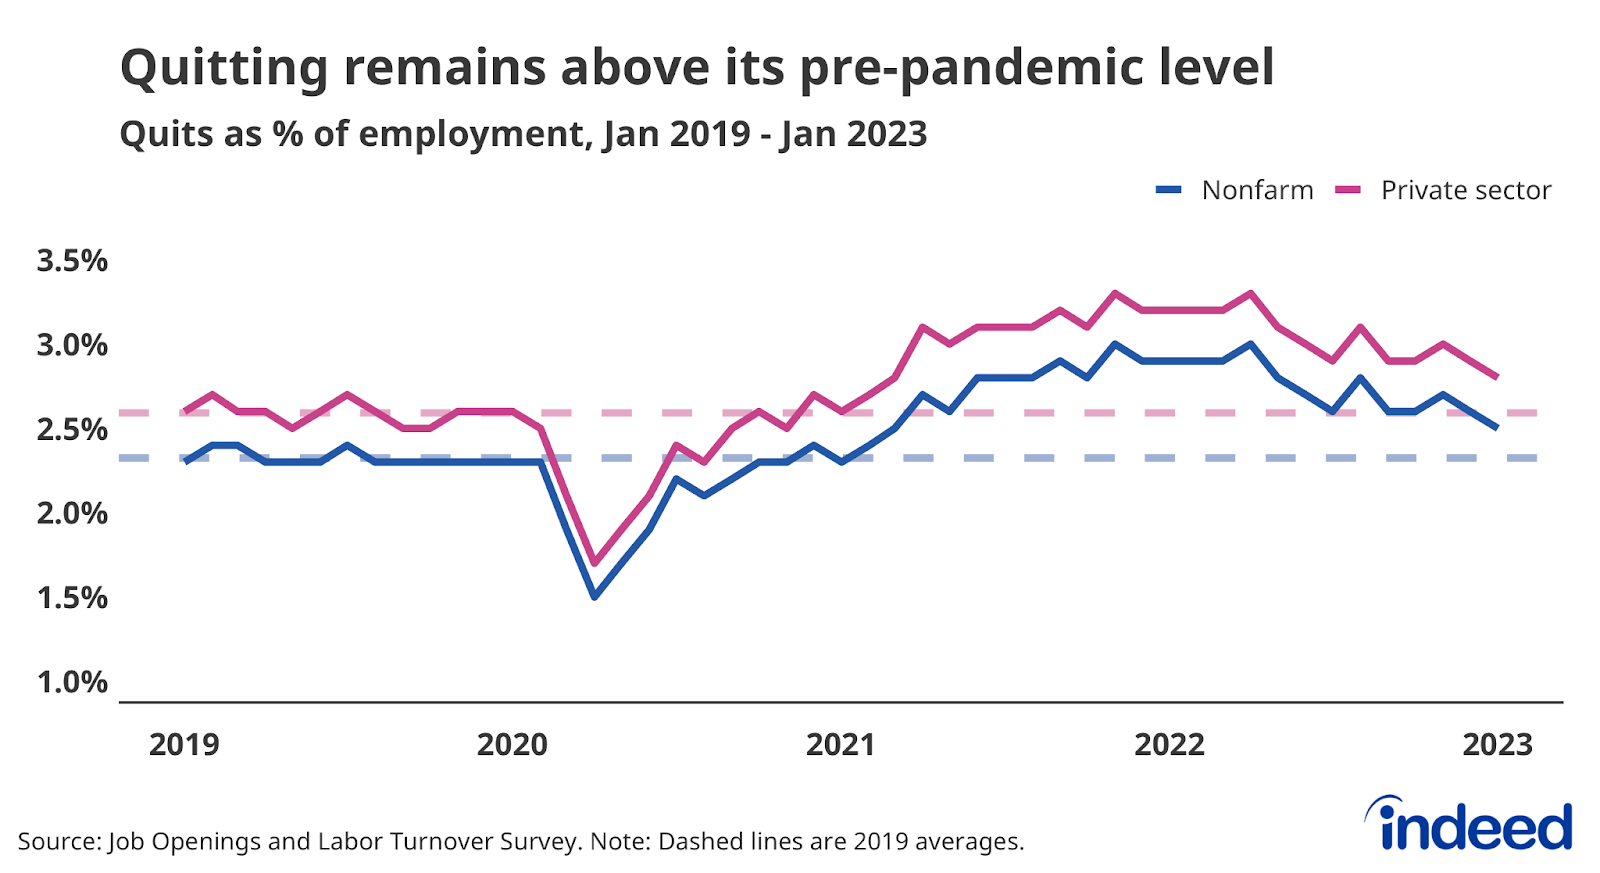
Quitting is still elevated, as layoffs remain low
While cooling somewhat last year to a rate of 2.5% this January, the job quitting rate is still 7.5% above the pre-pandemic norm as employed workers continue to find new work at elevated rates. And while quitting overall may be cooling, the decline in quitting in high-churn sectors, especially leisure and hospitality and retail trade, has petered out. Workers quitting their old jobs and finding new ones is typically a major driver of overall wage gains, and continued elevated rates of quitting in these sectors would support continued wage growth.
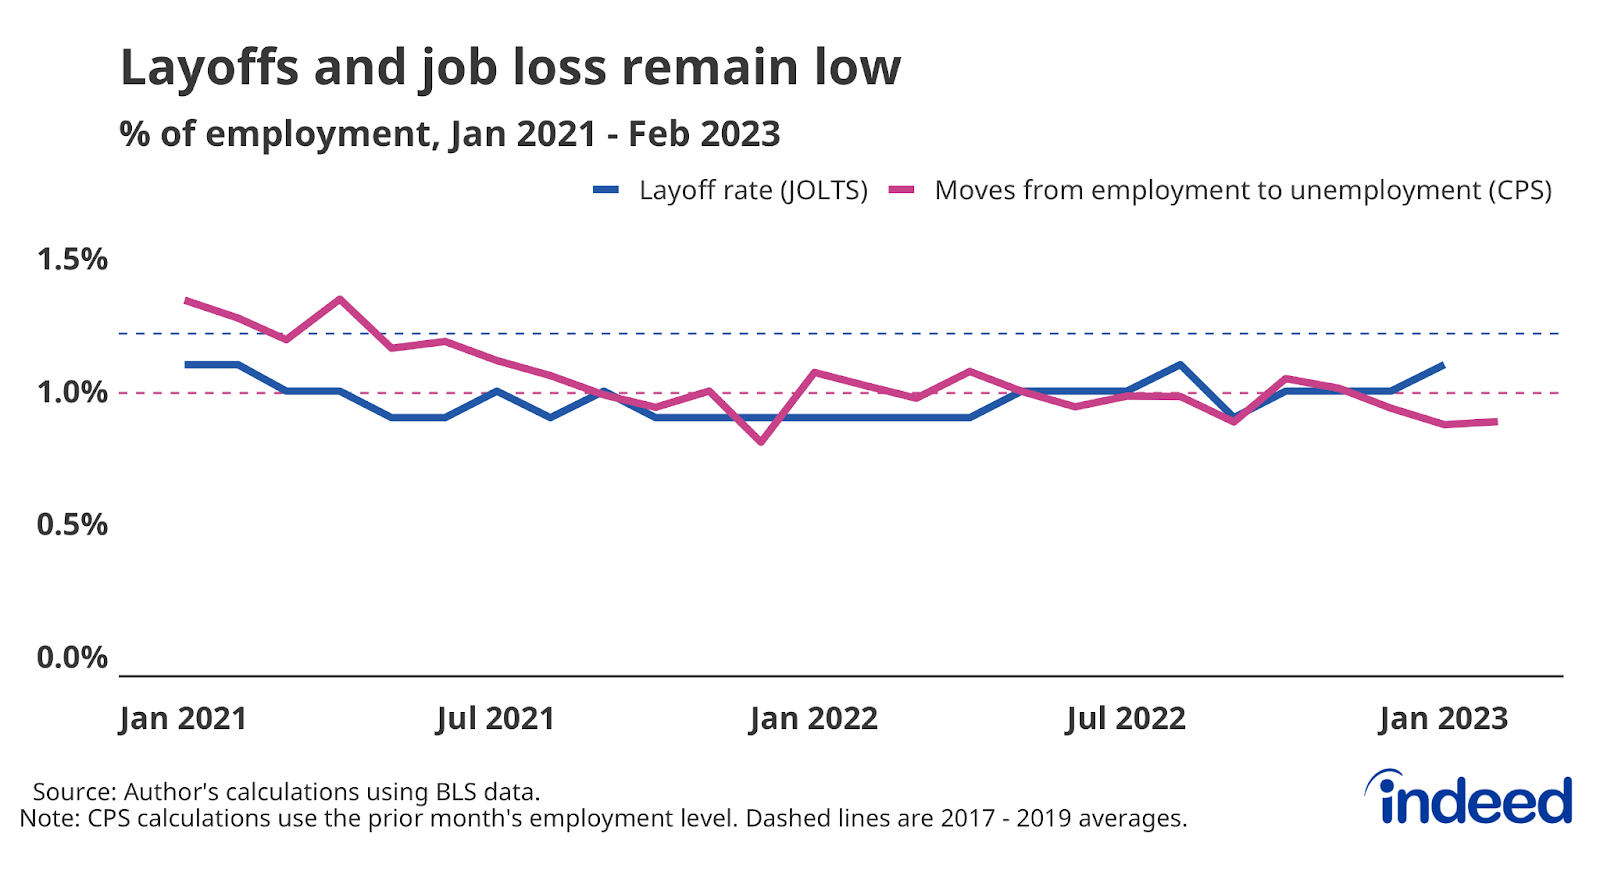
But while workers are voluntarily leaving their jobs at higher rates than during pre-pandemic days, employers seem reluctant to let them go. The recent wave of announced layoffs in the tech and media sectors signals a painful recalibration in that sector, but layoffs across the economy are starting from a very low level. Layoffs averaged about 1.6 million a month from November 2022 through January 2023, and would need to rise about 16% in order to return to their monthly average of 1.8 million from 2017 through 2019.
Furthermore, what’s happening in the tech sector isn’t necessarily reflective of the overall labor market. Technology companies have a much bigger footprint in stock indexes than they do in the labor market, in which they employ less than 2% of workers nationwide.
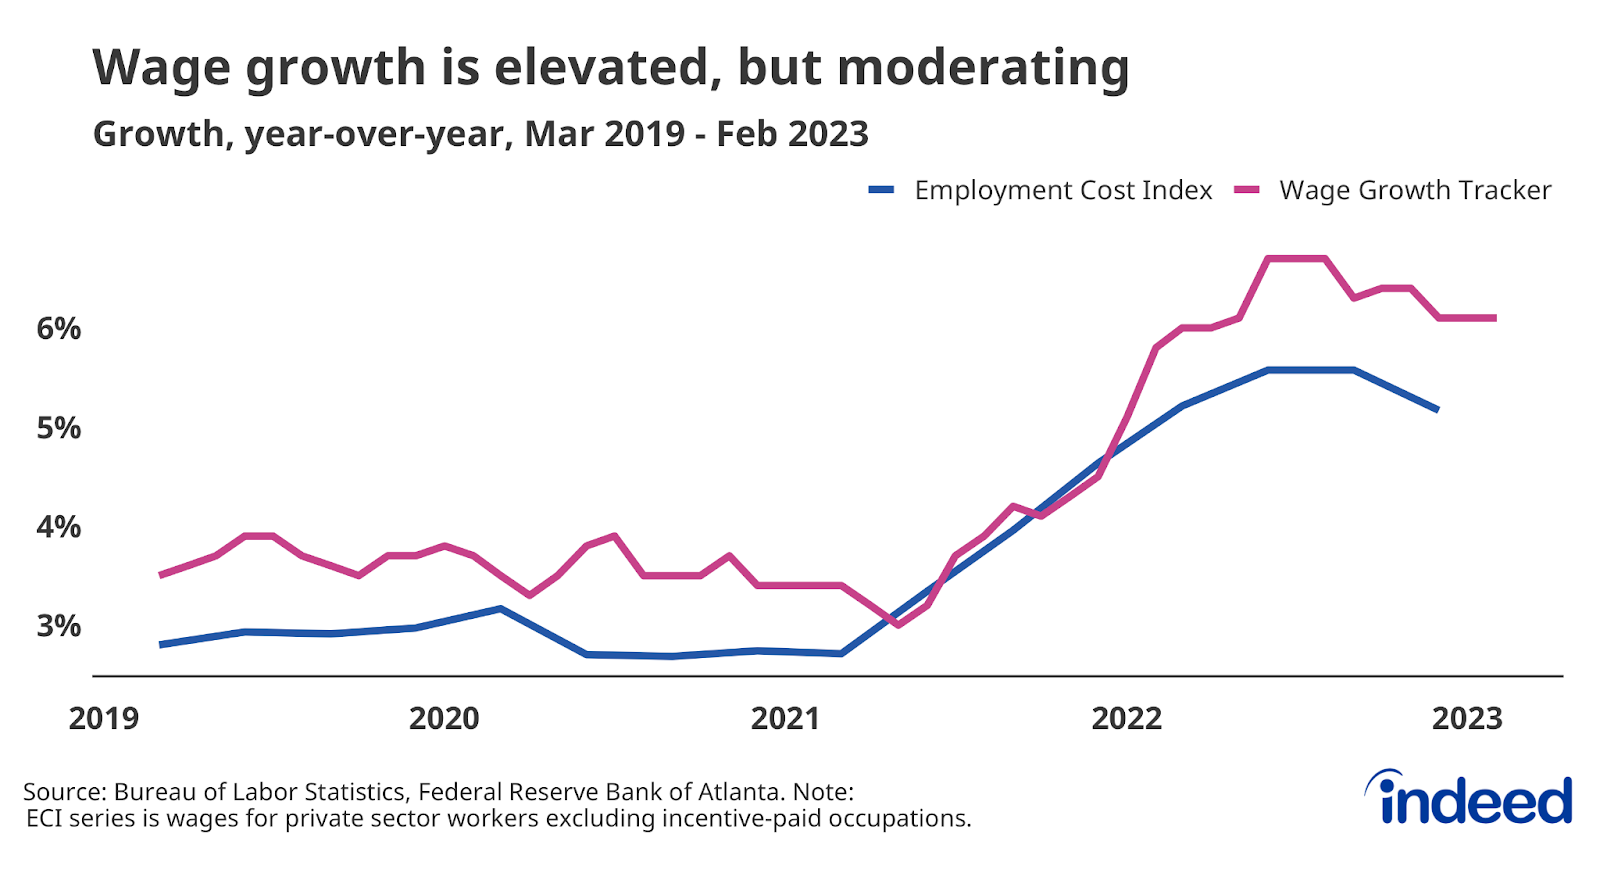
Wage growth remains strong
Strong competition for new hires across multiple sectors pushed wage growth up between 5% and 6% on an annual basis, a faster growth rate than at any point over the past 20 years. But these data are measuring so-called nominal wage growth — pay gains measured before taking inflation into account. When inflation rises at a faster rate than nominal wage growth, as it currently is, rising prices eat away at those gains and cause many employees to lose ground when it comes to actual purchasing power.
Several measures of wage growth show that growth has started to slow down. However, the rate of this deceleration is unclear, and wage growth is still well above its slower pre-pandemic pace. Wage gains for workers staying in their old jobs are holding steady as job switchers’ gains are moderating. Overall wage growth will remain elevated if pay for workers staying in their role keeps up this momentum.
The US labor market has plenty of opportunities for workers, while also presenting challenges to employers. However, the current situation will surely change. We will continue to monitor these trends and track others as the labor market evolves.
Methodology
Data on seasonally adjusted Indeed job postings are an index of the number of seasonally adjusted job postings on a given day, using a seven-day trailing average. February 1, 2020, is our pre-pandemic baseline, so the index is set to 100 on that day. We seasonally adjust each series based on historical patterns in 2017, 2018, and 2019. We adopted this methodology in January 2021. Data for several dates in 2021 and 2022 are missing and were interpolated. Non-seasonally adjusted data are calculated in a similar manner except that the data are not adjusted to historical patterns.
The number of job postings on Indeed.com, whether related to paid or unpaid job solicitations, is not indicative of potential revenue or earnings of Indeed, which comprises a significant percentage of the HR Technology segment of its parent company, Recruit Holdings Co., Ltd. Job posting numbers are provided for information purposes only and should not be viewed as an indicator of performance of Indeed or Recruit. Please refer to the Recruit Holdings investor relations website and regulatory filings in Japan for more detailed information on revenue generation by Recruit’s HR Technology segment.