
Key Points:
- Despite some cooling, the US labor market remains hot as demand is still elevated and joblessness is low.
- Job postings on Indeed were 53.5% above their pre-pandemic baseline as of July 22, signaling robust hiring intentions. However postings are gradually pulling back, with particularly notable declines for sectors such as software development.
- The recent drop-off in hiring appetites for tech jobs has local consequences. Job postings on Indeed are cooling quickly in ‘tech hub’ metros such as San Jose, San Francisco, and Seattle, dropping 8.4% over the past four weeks.
- The high level of competition for hires is the main source of strong wage growth, although the gains for many have been wiped out by inflation.
- Job growth has slowed recently, but this deceleration is mostly due to employment approaching more robust levels, rather than a rapid pullback in employer desire for new hires.
Spotlight: Job postings in ‘tech hubs’ cooling quickly
As you might have noticed from headlines, press releases, and social media posts, the tech sector is experiencing some turbulence after several years of flying high. That bumpy ride is registering in Indeed data as job postings for tech-related job sectors are declining quickly. At the same time, job postings in tech hubs are also trending downward.
Over the past four weeks, job postings in the software development sector have noticeably dropped along with other sectors such as Media & Communications and Human Resources. Software development postings which include job titles such as software engineer, full stack developer, and product manager have fallen by 17.3%.
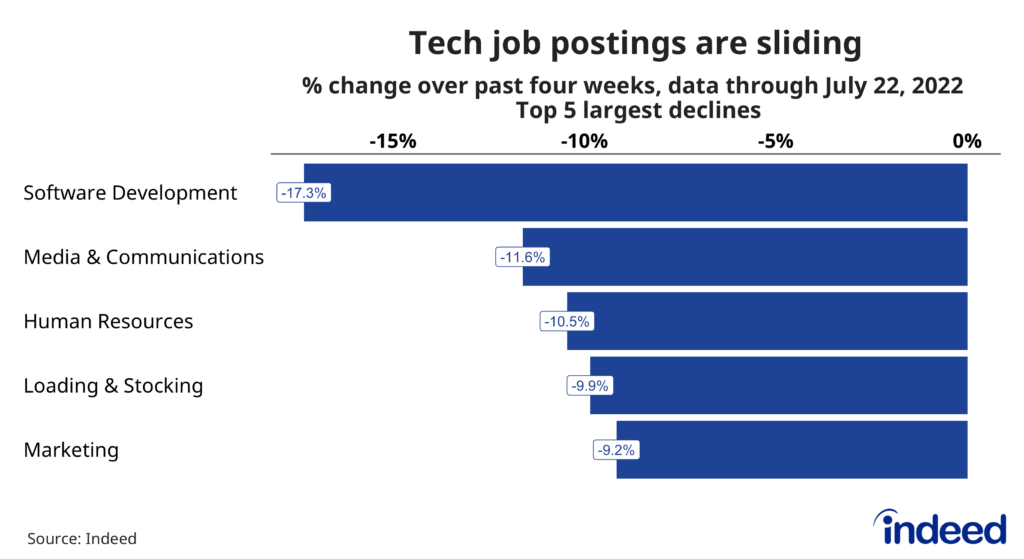
Compare these sharp declines to a slower decline of 1% for overall postings, a 4.6% growth for restaurant and bar-related jobs (Food Preparation & Service) and a 2.4% increase for childcare jobs. Tech jobs may be feeling the pain, but it’s not a universal experience.
The fallout from the pullback in tech hiring plans can be seen at the metro level as well. Job postings in tech hub metros, which include places such as San Francisco, Seattle, and Austin, have declined by 8.4% over the past four weeks while non-tech metros saw their job postings inch down by 0.6%
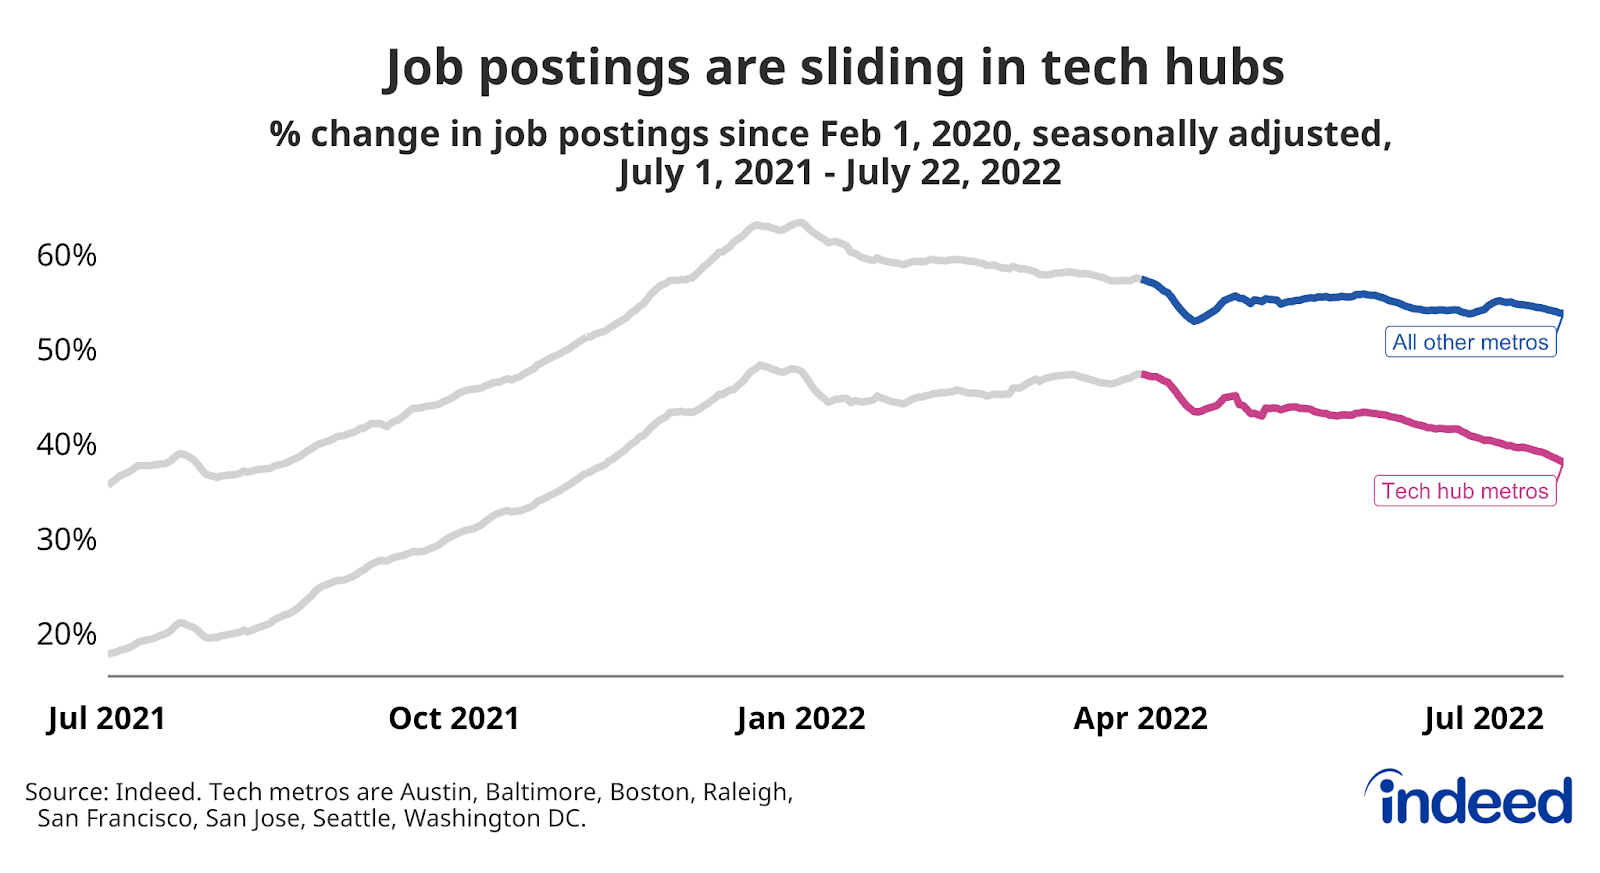
The tech sector retrenchment is clear in Indeed data, but let’s not forget the heights from which software development postings are descending. Those postings are still 96.4% above their pre-pandemic level. Postings in the San Jose metro area, a key tech hub, are still up about 36.9%.
The recent fortunes of tech jobs could serve as a guide for the near-term outlook for the overall economy. If any future pullback is concentrated in sectors where hiring has been particularly robust, then the chances of a “softish” landing for the jobs market increases. But if tech is a sign of things to come for interest-rate sensitive sectors, such as real estate and construction, then we may have to prepare for a rough touchdown.
Labor Market Overview
The US labor market remains hot. As the US economy has bounced back from the initial COVID-19 shock, demand for labor has grown much more quickly than supply. Employment has rebounded, wages are growing quickly, and joblessness is approaching pre-pandemic levels. But now the labor market is showing some signs of normalizing, particularly as demand for workers cools. This normalization faces roadblocks in the form of aggressively tightening monetary policy, geopolitical instability, and the evolution of the COVID-19 pandemic.
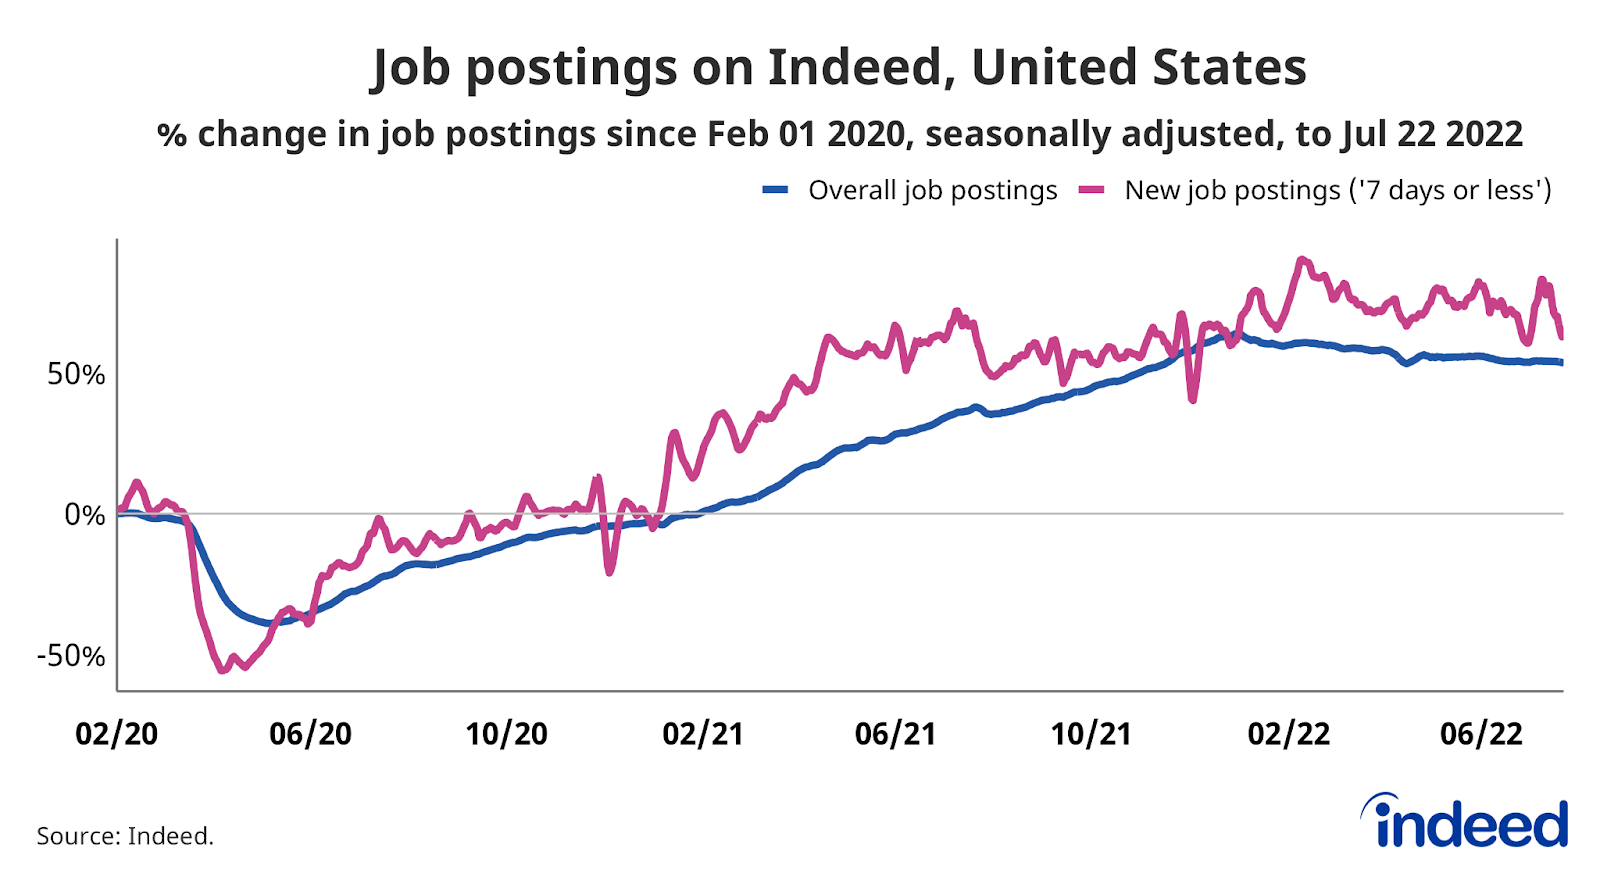
Employer demand for workers remains strong, with Indeed job postings as of July 22, 2022 53.5% above their pre-pandemic baseline. New job postings, defined as those on Indeed for seven days or less, are also well above their pre-pandemic baseline, up 63.2%. While job postings growth has slowed, the leveling out has been moderate.
Strong wage growth, but inflation is eating away gains
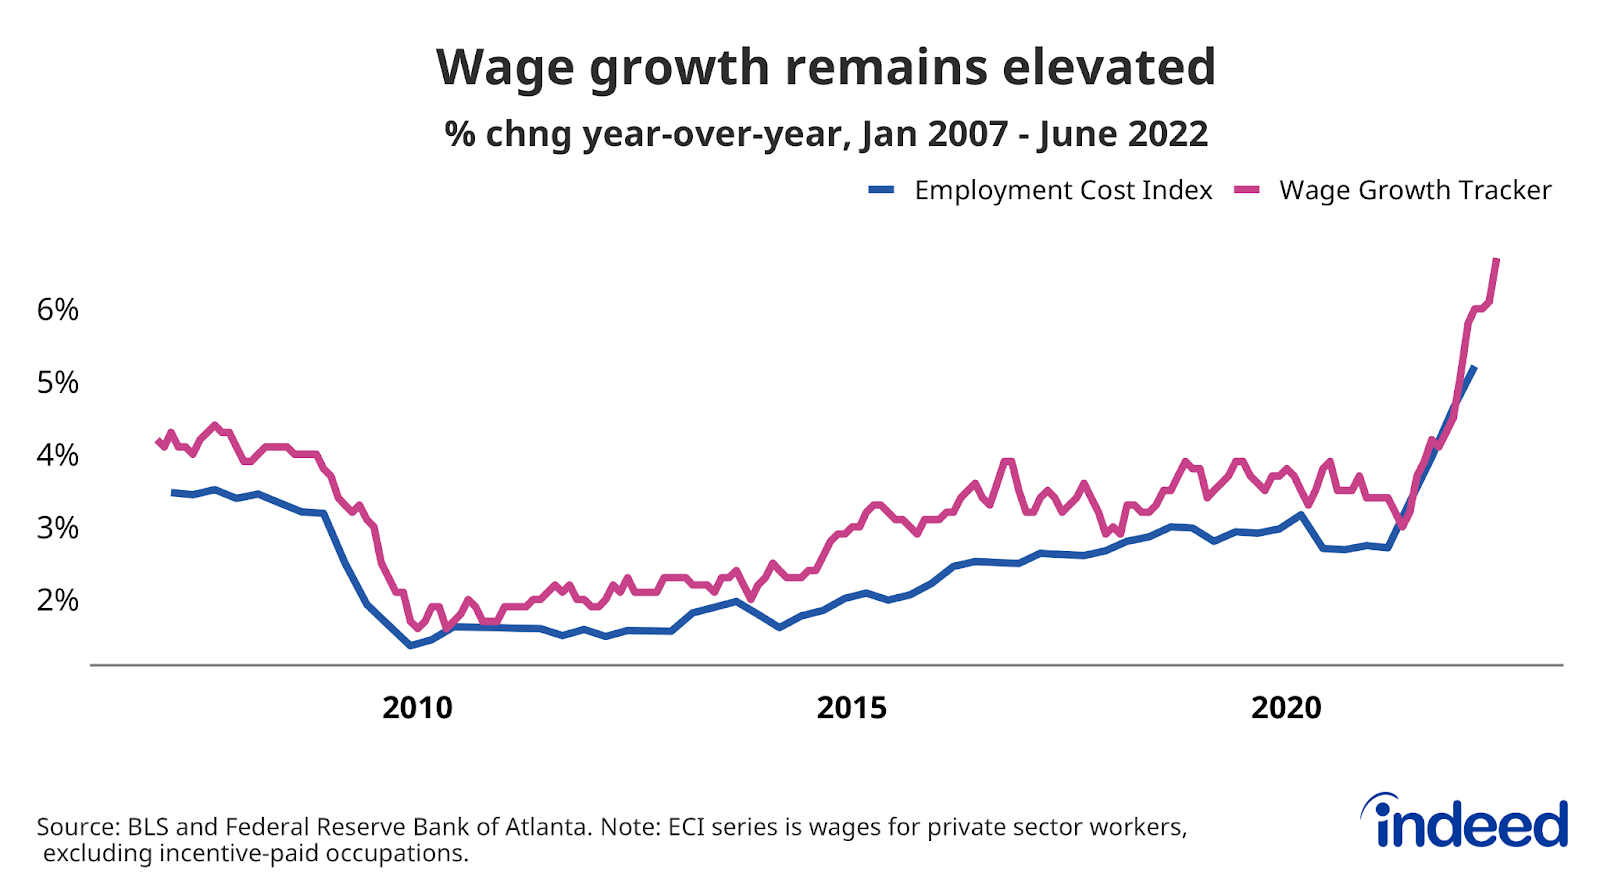
Strong demand for workers across multiple sectors has driven wages up roughly 6% on an annual basis, a higher growth rate than at any point in over the past 20 years. This is what economists call nominal wage growth — that is, pay gains before taking inflation into account. However, rising prices are eating away those gains and causing many employees to lose ground when it comes to actual purchasing power.
One of the biggest questions for the US economy is the future path of nominal wage growth. The latest data are mixed, as widely-cited average hourly earnings data show wages slowing down and the Atlanta Fed’s Wage Growth Tracker shows a recent acceleration. A better read on the current state of wage growth will be possible with the release of new data from the Employment Cost Index data this coming Friday. A flatlining or decline in wage growth would signal that competition for new hires is starting to wane, albeit at still fierce levels.
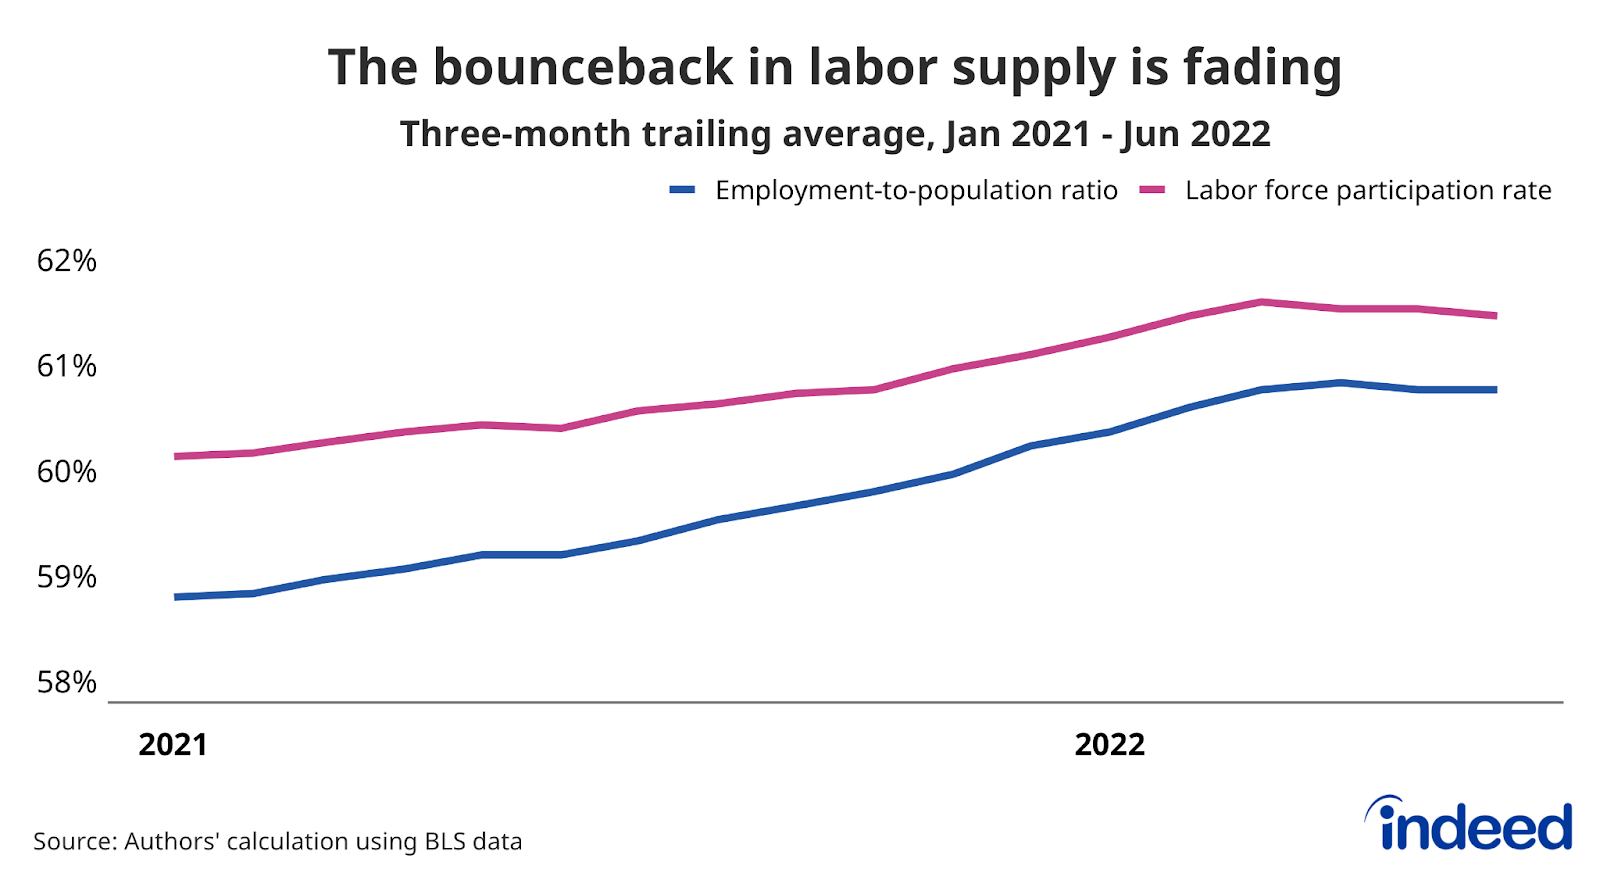
People are returning to work – but pace is slowing
Labor supply has not grown as swiftly as demand, but people are returning to work. However, the pace of improvement has slowed recently. The labor force participation rate was slowly but steadily increasing for the latter part of last year and picked up its pace through this spring. But since April, the participation rate has leveled off. A very similar trend has unfolded for the employment-to-population ratio, a more expansive measure of labor supply. If demand continues to cool and wage growth does slow then the incentive for many workers to enter or rejoin the labor force may diminish. This change in calculus would be true for both prime-age workers and older workers who are ‘unretiring.’
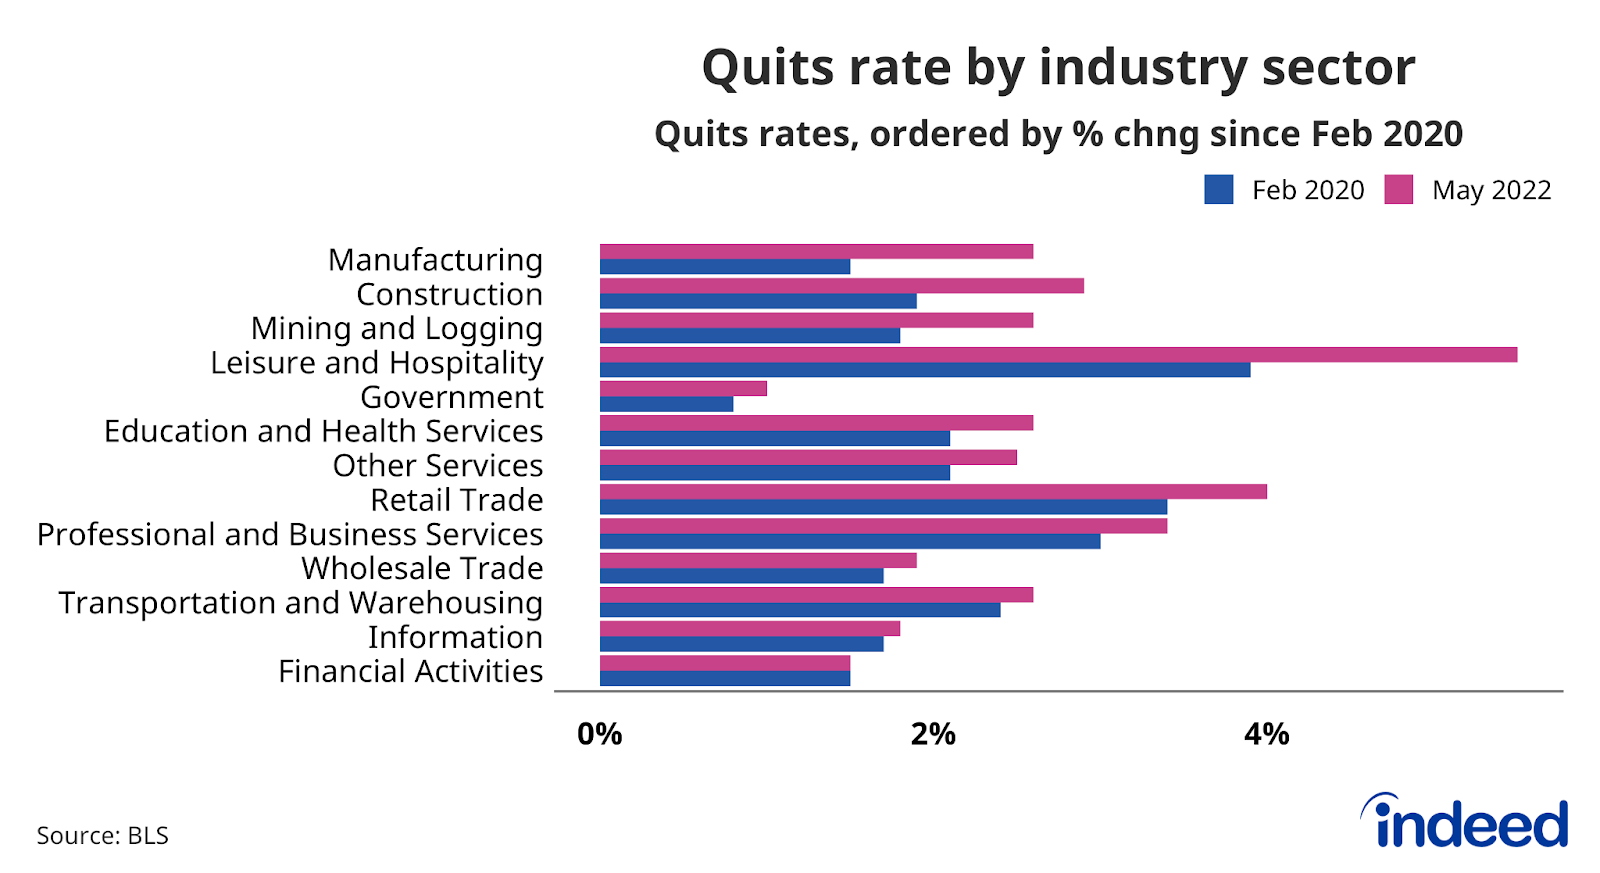
Workers are quitting jobs at a high rate
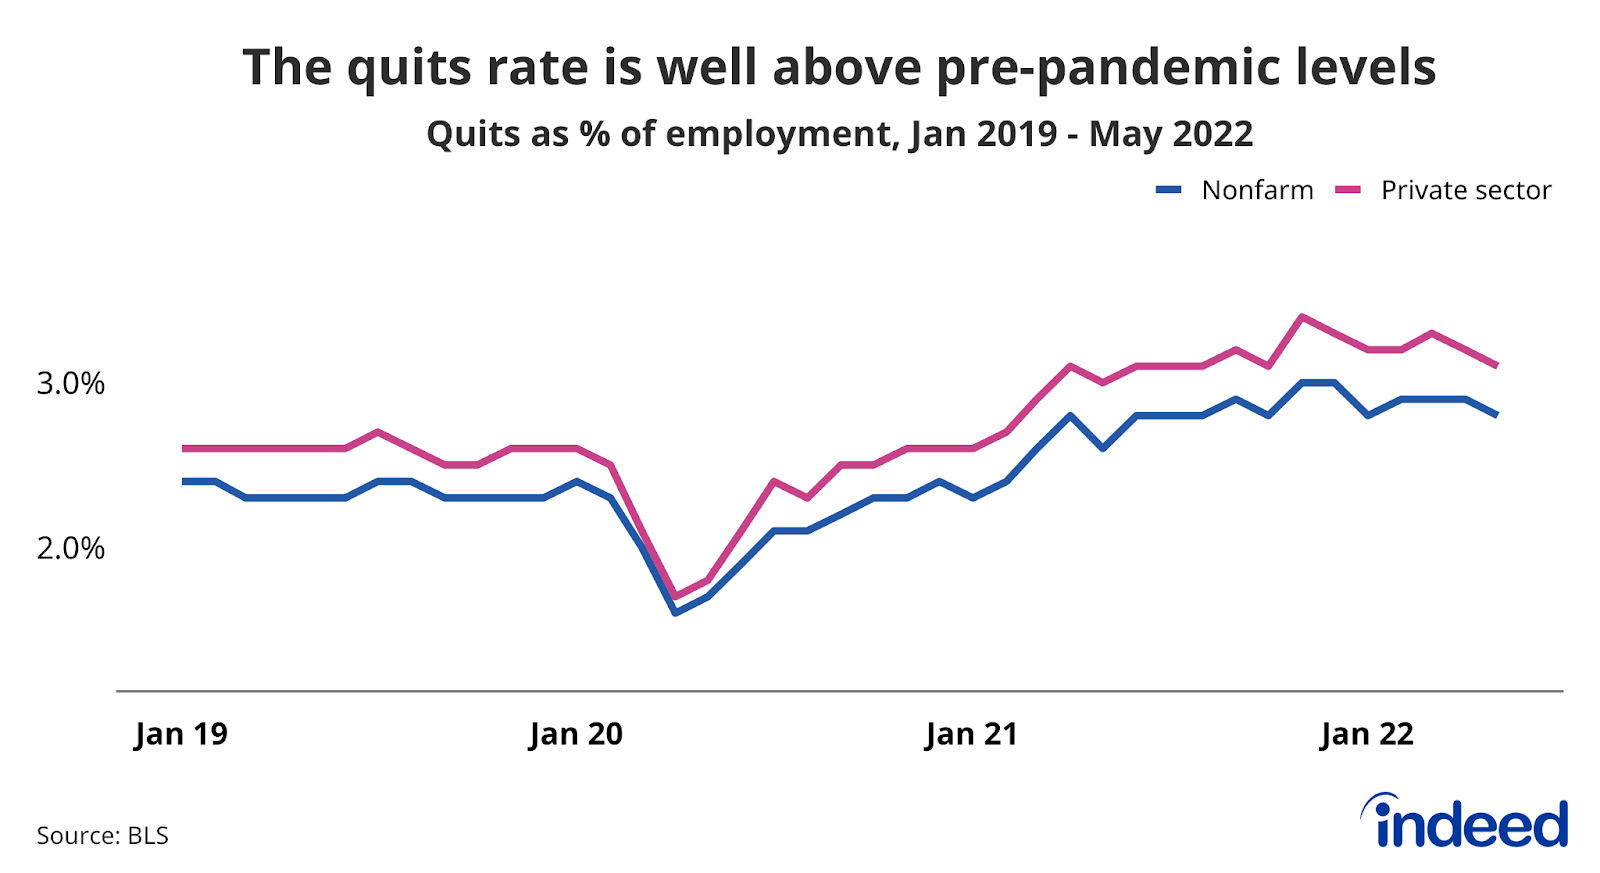
Employed workers are also finding new work, pushing the rate of job quitting to levels not seen in the 21st century. A remarkable 3.1% of private sector workers voluntarily left their jobs in May 2022. While quitting is still elevated, it has cooled down slightly in recent months.This high volume of quitting reflects strong demand for workers and has been concentrated in lower average-wage industry sectors such as manufacturing and leisure and hospitality. Some sectors have seen a pickup in quitting as of late, namely construction.
The US labor market has been offering plenty of opportunities for workers while presenting some challenges to employers. However, the present situation undoubtedly will change. We will continue to monitor these trends and track others as the labor market evolves.
Methodology
Data on seasonally adjusted Indeed job postings are the percentage change in seasonally adjusted job postings since February 1, 2020, using a seven-day trailing average. February 1, 2020, is our pre-pandemic baseline. We seasonally adjust each series based on historical patterns in 2017, 2018, and 2019. We adopted this methodology in January 2021. Data for several dates in 2021 and 2022 are missing and were interpolated. Non-seasonally adjusted data are calculated in a similar manner except that the data are not adjusted to historical patterns.
The number of job postings on Indeed.com, whether related to paid or unpaid job solicitations, is not indicative of potential revenue or earnings of Indeed, which comprises a significant percentage of the HR Technology segment of its parent company, Recruit Holdings Co., Ltd. Job posting numbers are provided for information purposes only and should not be viewed as an indicator of performance of Indeed or Recruit. Please refer to the Recruit Holdings investor relations website and regulatory filings in Japan for more detailed information on revenue generation by Recruit’s HR Technology segment.