Key points:
- After dipping during the pandemic, ‘unretirements’ are on the rise, due to a tight labor market, lessened pandemic concerns, and high inflation.
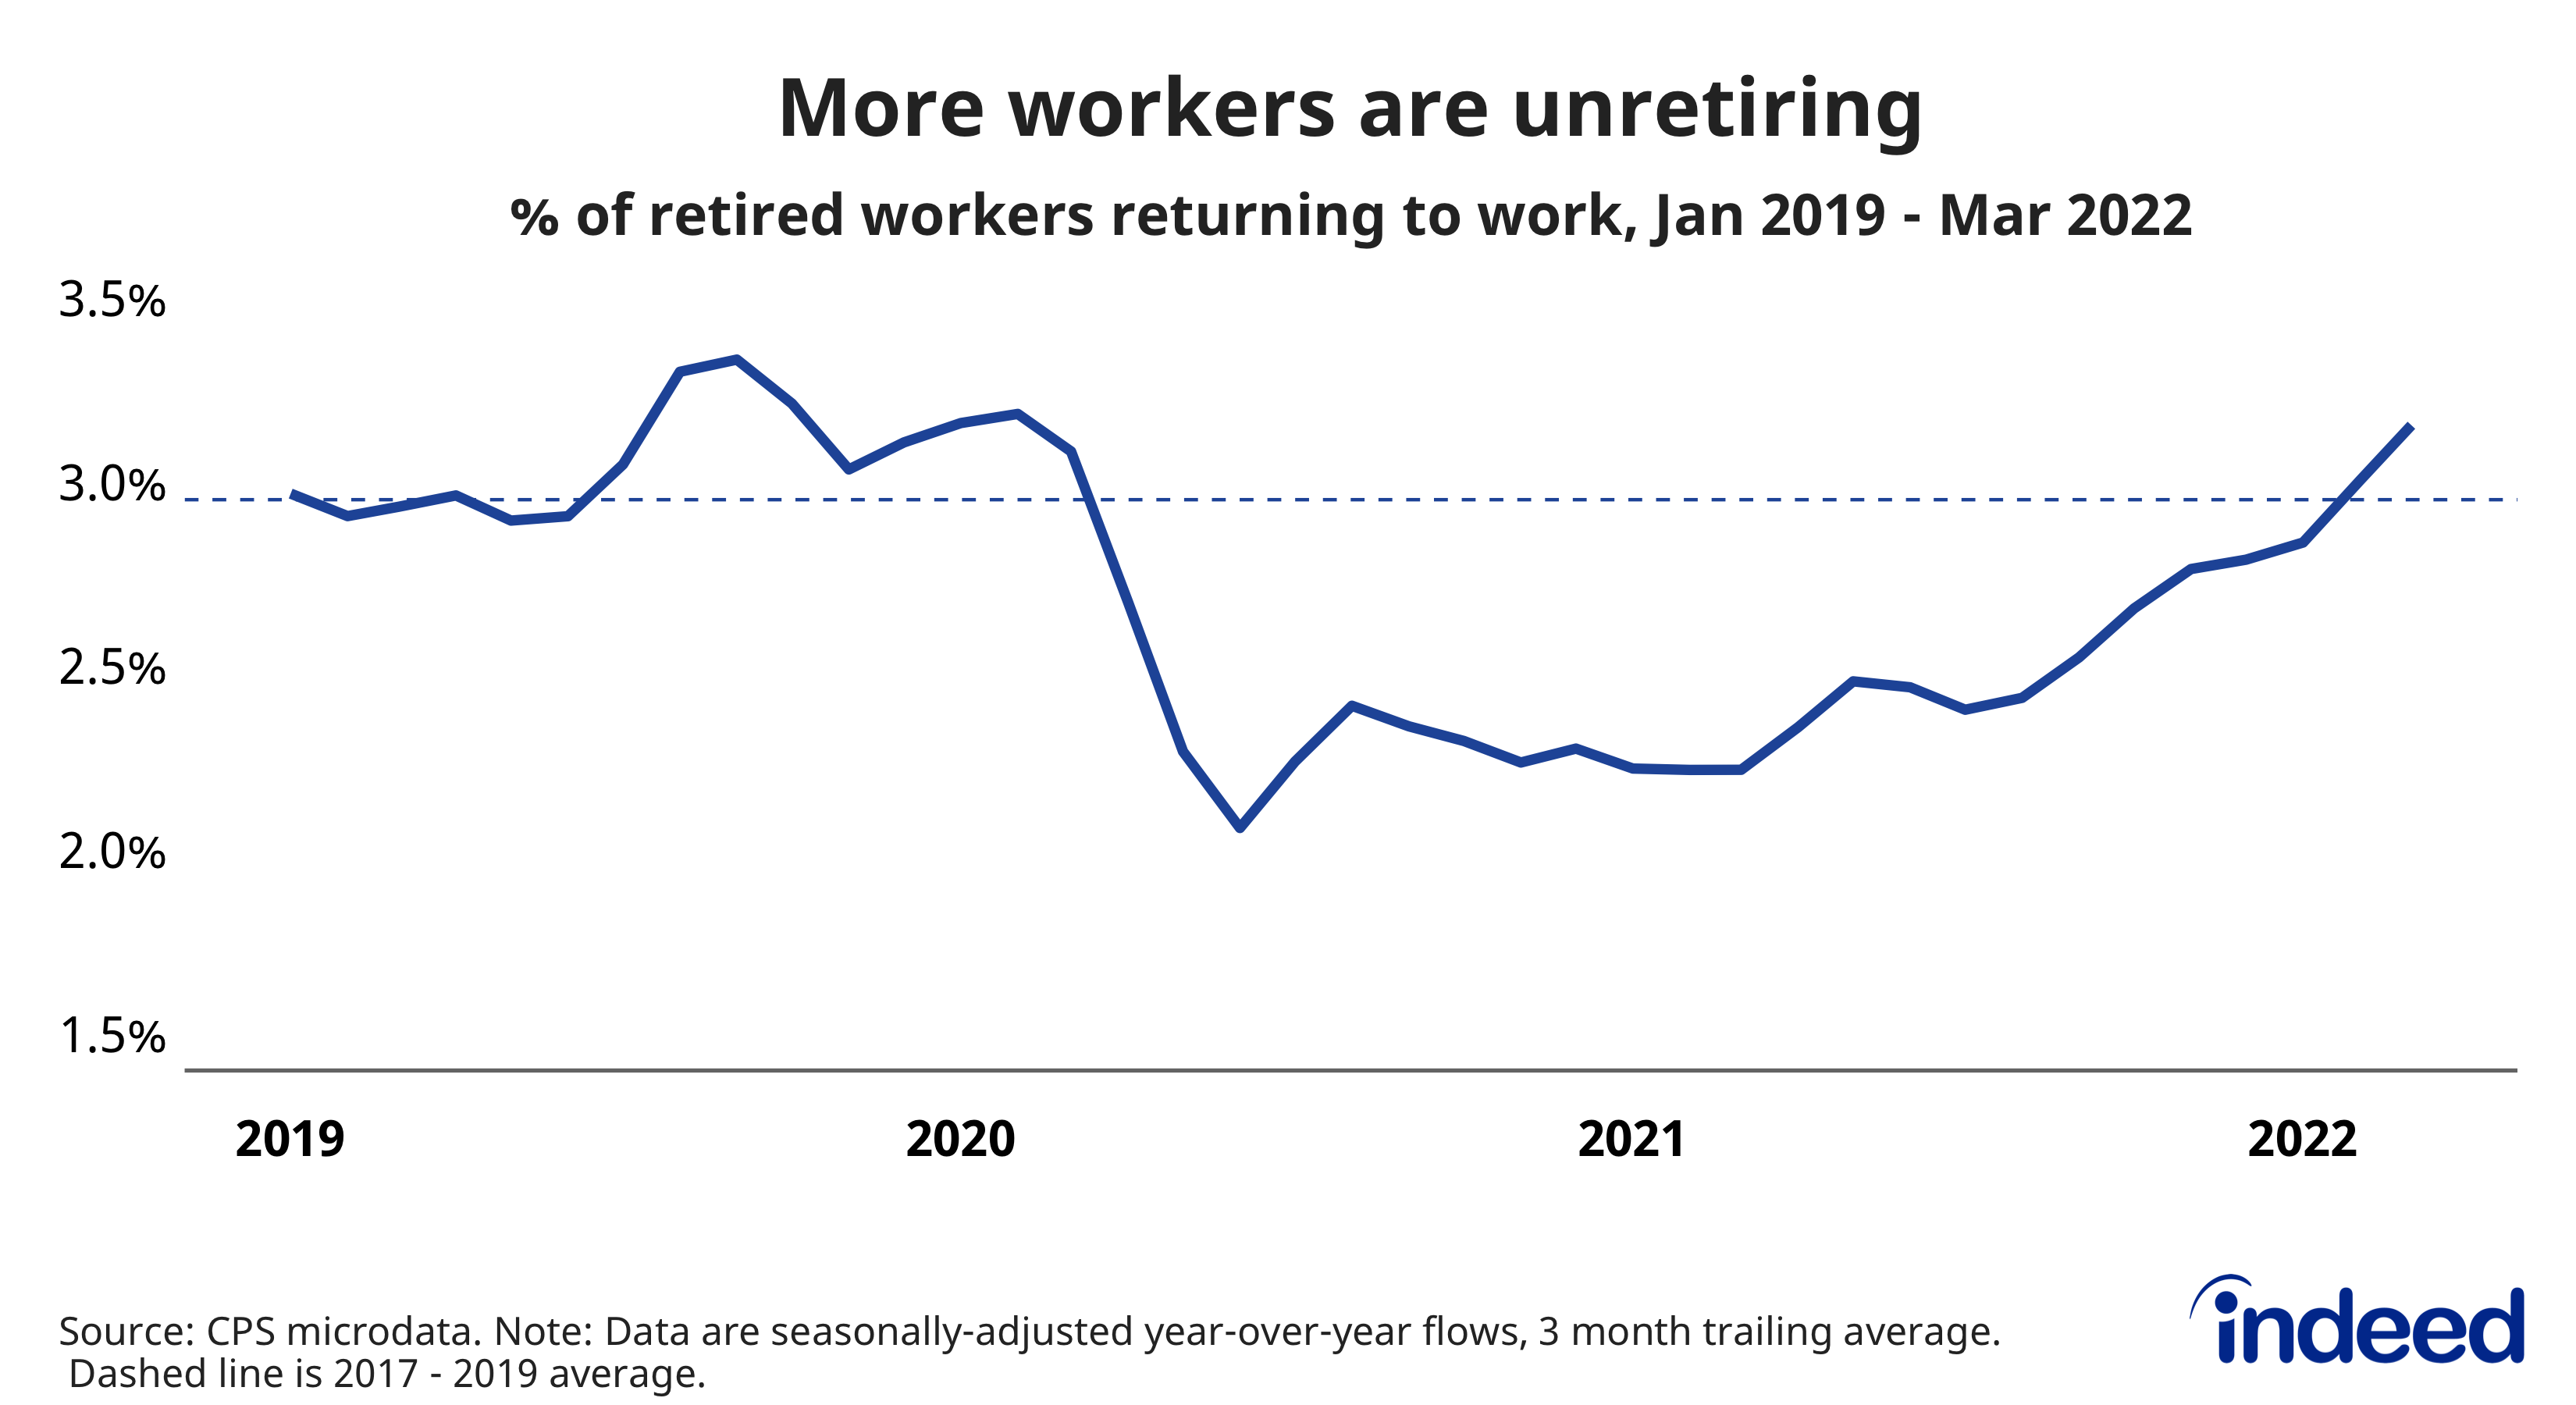
- As of March 2022, 3.2% of workers who were retired a year earlier are now employed.
Amid a hot labor market and high inflation, retired workers are returning to work at a rising rate. ‘Unretirements’ are on the rise as workers who previously said they were retired are now taking jobs again. As of March 2022, 3.2% of workers who were retired a year earlier are now employed.
It may sound strange that retired workers are taking jobs, but these moves are more common than you may expect. Before the pandemic, from 2017 to 2019 roughly 3% of retired workers on average ended up having a job a year later. The initial shock of the pandemic caused these moves back into work to drop, as the unretirement rate fell from 3.2% in February 2020 to 2.1% by June 2020.
A fall and rebound in unretirement flows has precedent. The rate of unretirement dropped during and after the Global Financial Crisis of 2007 – 2009 (although not as much as it did after the initial COVID-19 shock in spring 2020.) Unretirements eventually picked up as employment increased and the labor market heated up. The similarities between that recovery and the current increase in the unretirement rate suggests the tightening labor market is a major force luring many retired workers back into a job.
If many retired workers are enticed by a hot labor market, this would mean these workers are better thought of as akin to workers who gave up their job search due to discouragement rather than our traditional idea of retirees. It is hard to rule out the influence of waning concerns about the pandemic and faster inflation, and they are surely factors. But it’s not clear that they are the main reasons.
The unretirement rate may have returned to its pre-pandemic level, yet there is the possibility that it could go even higher. Further increases in the rate would mean the pool of workers who want a job is higher than many have thought since the pandemic hit. Watching this trend in the months ahead will give us a better sense of how much tighter the labor market could get and how many people can be attracted back to work by higher wages.
Methodology
The data in this blog post are calculated using an IPUMS extract of the Current Population Survey Basic Monthly microdata. The CPS data are from the household survey used to calculate the unemployment rate and other labor force statistics released every month by the Bureau of Labor Statistics.
The rate of ‘unretirement’ is calculated by looking at the rate at which individuals move from retirement into employment. The CPS microdata allows researchers to track individuals a year apart using an anonymized identification number. This ability to match individuals 12 months apart lets a researcher see if a person has changed their labor market status. In this analysis, a person is considered to be ‘unretired’ if they identify themselves as retired at a point in time and then one year later they say they are employed. For example, consider a person who tells the CPS that they are retired in March 2021. If one year later that same person tells the CPS they are employed in March 2022, they would be considered ‘unretired.’
This flow of people across labor force states is then converted into a rate by dividing the number of people who moved from retirement into work a year later by the number of retired people in the first period. To continue our example from above, the number of people unretiring from March 2021 to March 2022 is divided by the number of retired people in March 2021. That rate is then usually adjusted using X-13ARIMA-SEATS and then a 3-month trailing average is taken.