We regularly update this report to track the pandemic’s effects on the labor market.
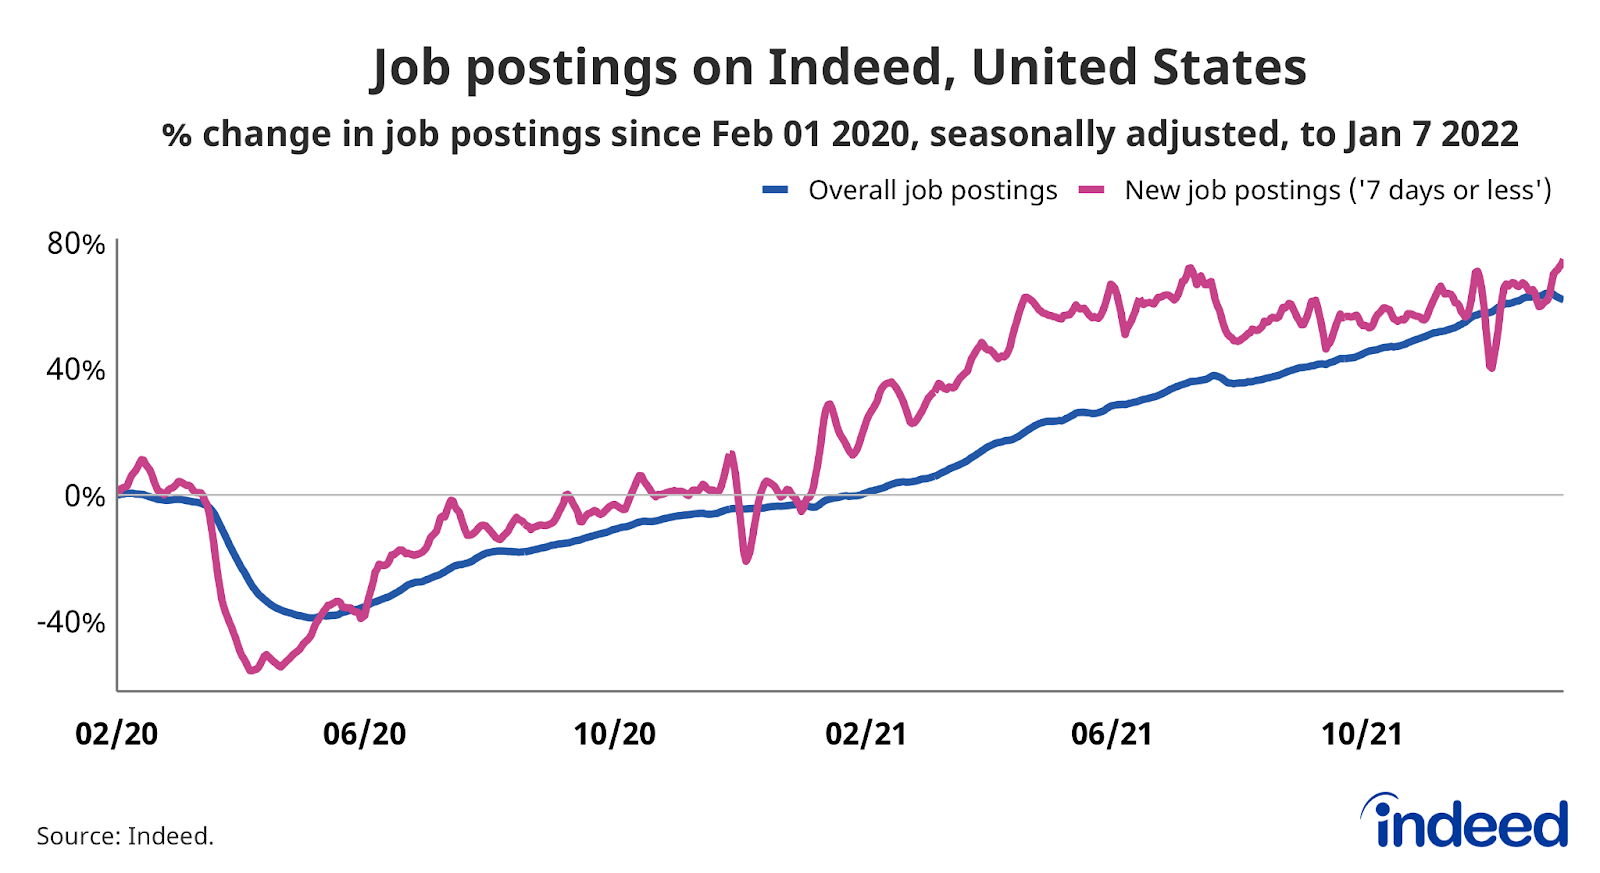
Job postings on Indeed are a real-time measure of labor market activity. On January 7, 2022, they were 61.9% above February 1, 2020, the pre-pandemic baseline, after adjusting for seasonal variation. Postings declined 2.1 percentage points in the past week, potentially driven by the latest wave of the pandemic or the New Year’s Day holiday. While Indeed data is seasonally adjusted, it’s tricky to fully control how holidays during a pandemic impact hiring behavior.
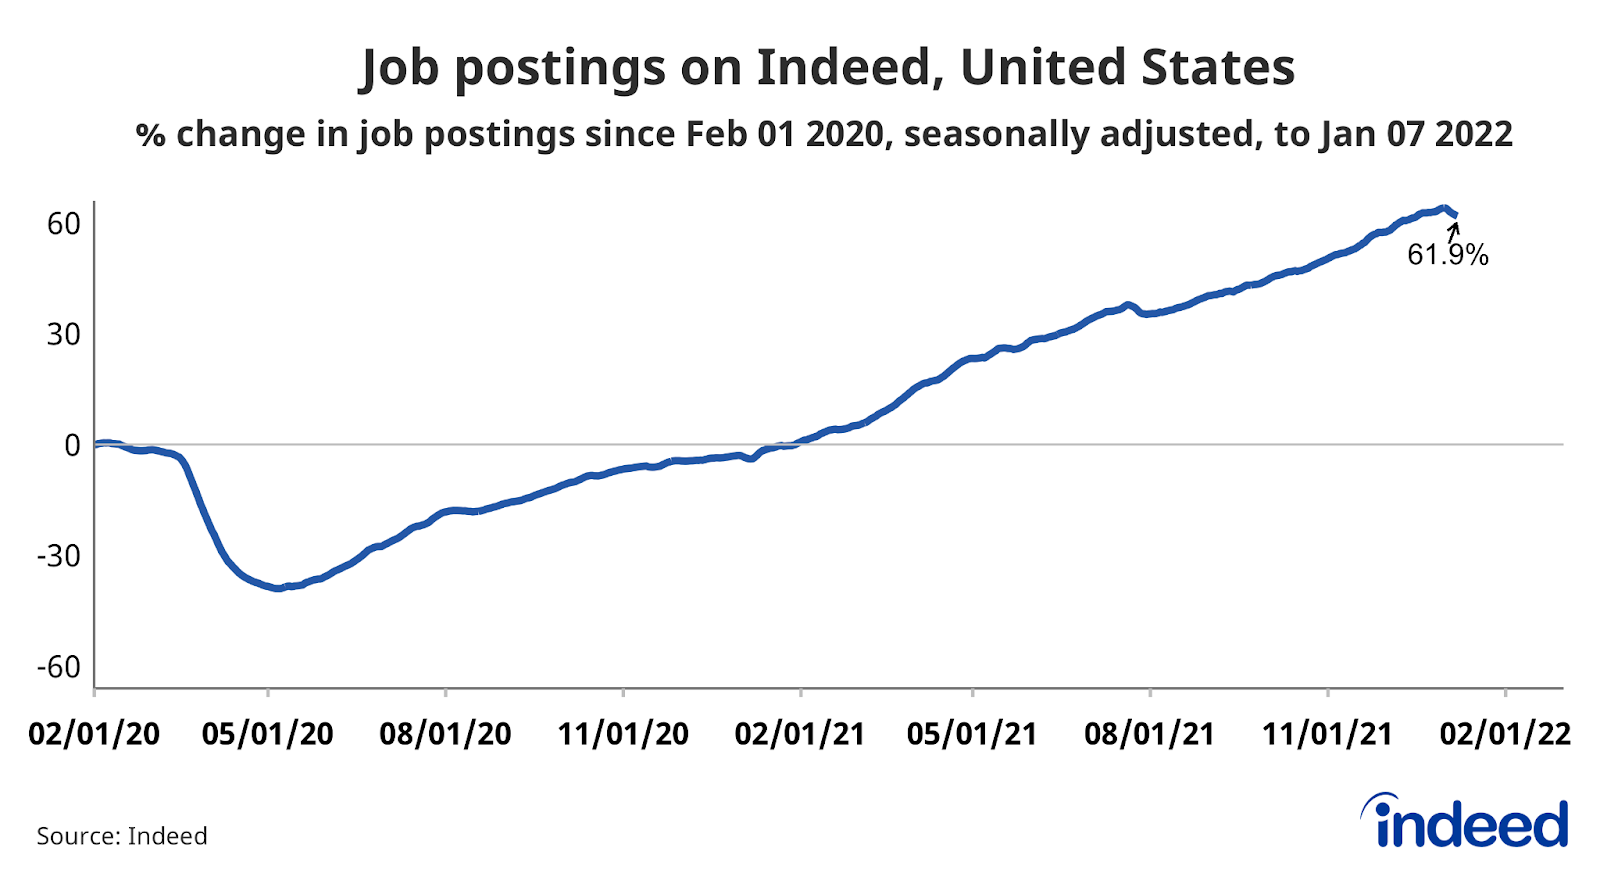
The impact of the omicron surge will become clearer in the next few weeks, but new job postings (those on Indeed for 7 days or less) have not declined despite skyrocketing COVID-19 cases. As of January 7, new postings hit a series high and are 74.7% above pre-pandemic baseline.
The Bureau of Labor Statistics reported 10.6 million job openings at the end of November in its latest JOLTS report. Job postings on Indeed increased 2.8% between November 30 and January 7. If JOLTS openings have grown since November 30 at the same rate as Indeed job postings, that implies 10.9 million job openings as of January 7.
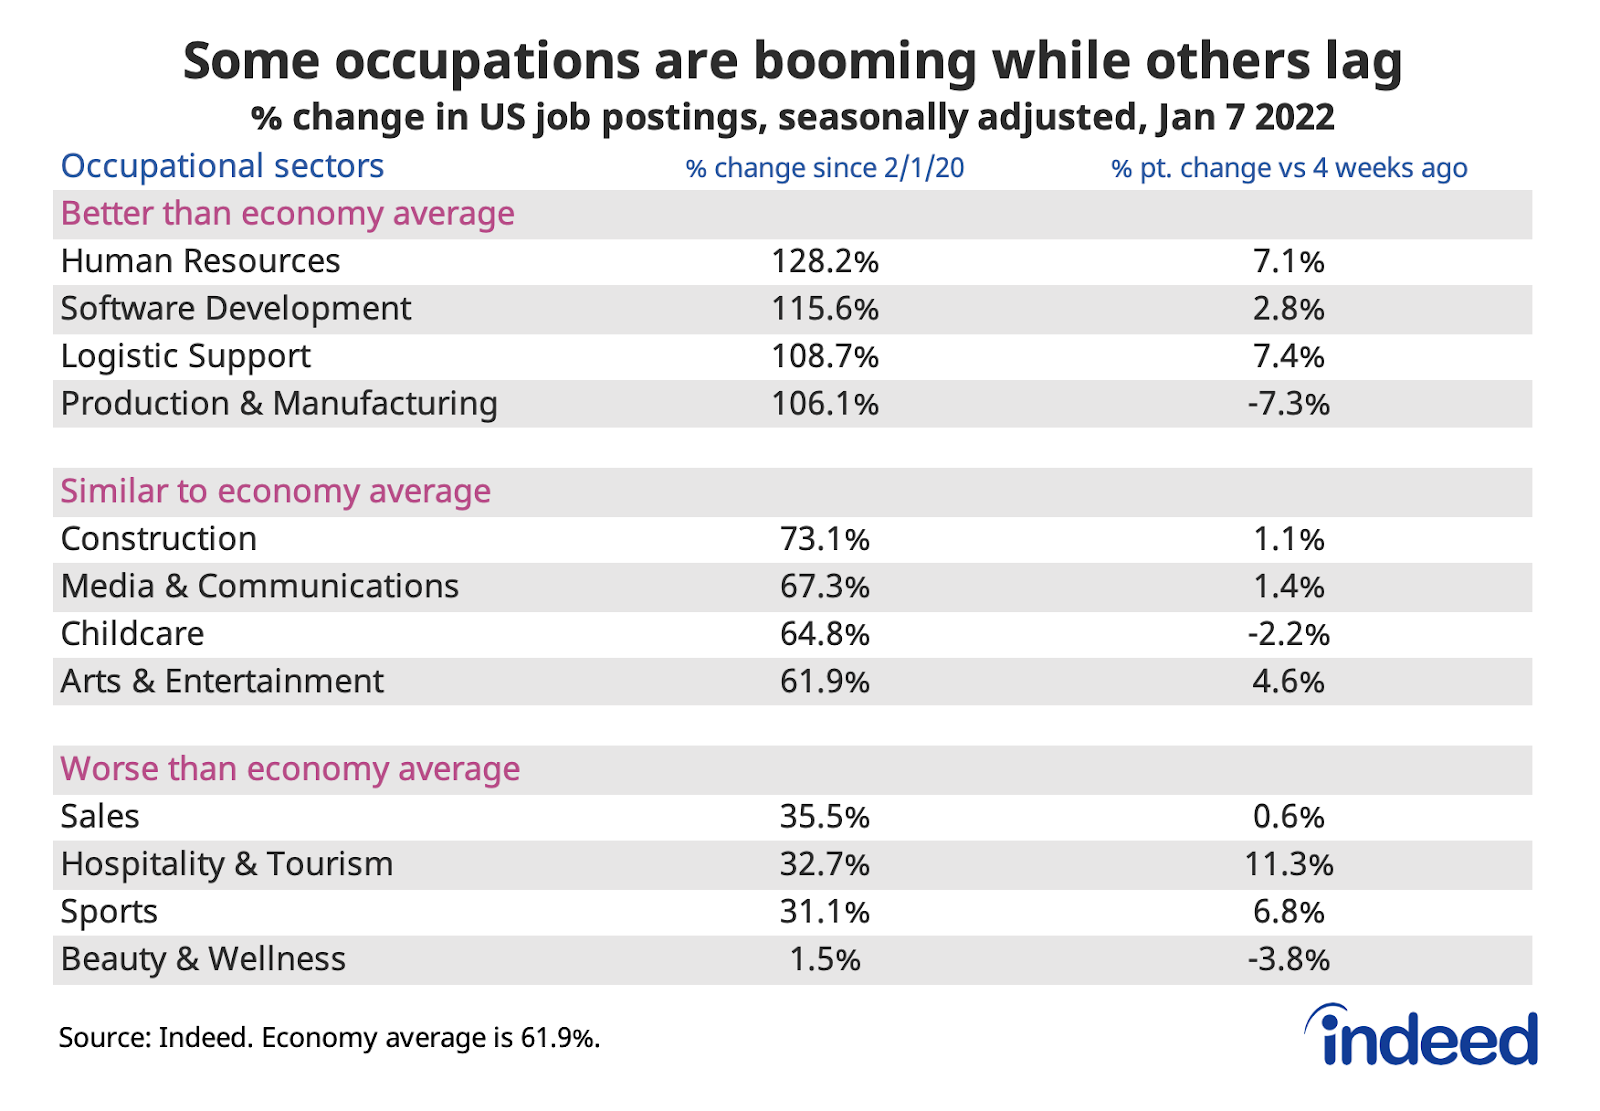
Lots of postings for HR and logistic support jobs
Job postings in all occupational sectors are above pre-pandemic baseline, especially human resources and software development. With supply chains still snarled, logistic support job postings have risen 7.4% since December 10. Childcare job postings continue to be on par with the economy average, but to the detriment of many working parents, have edged down over the last four weeks. Despite the omicron variant derailing some holiday plans, job postings in hospitality & tourism have been on the rise. However, the recovery in hospitality & tourism job postings remains far below the economy average of 61.9% and whether the upward trend continues into the post-holiday season is an open question.
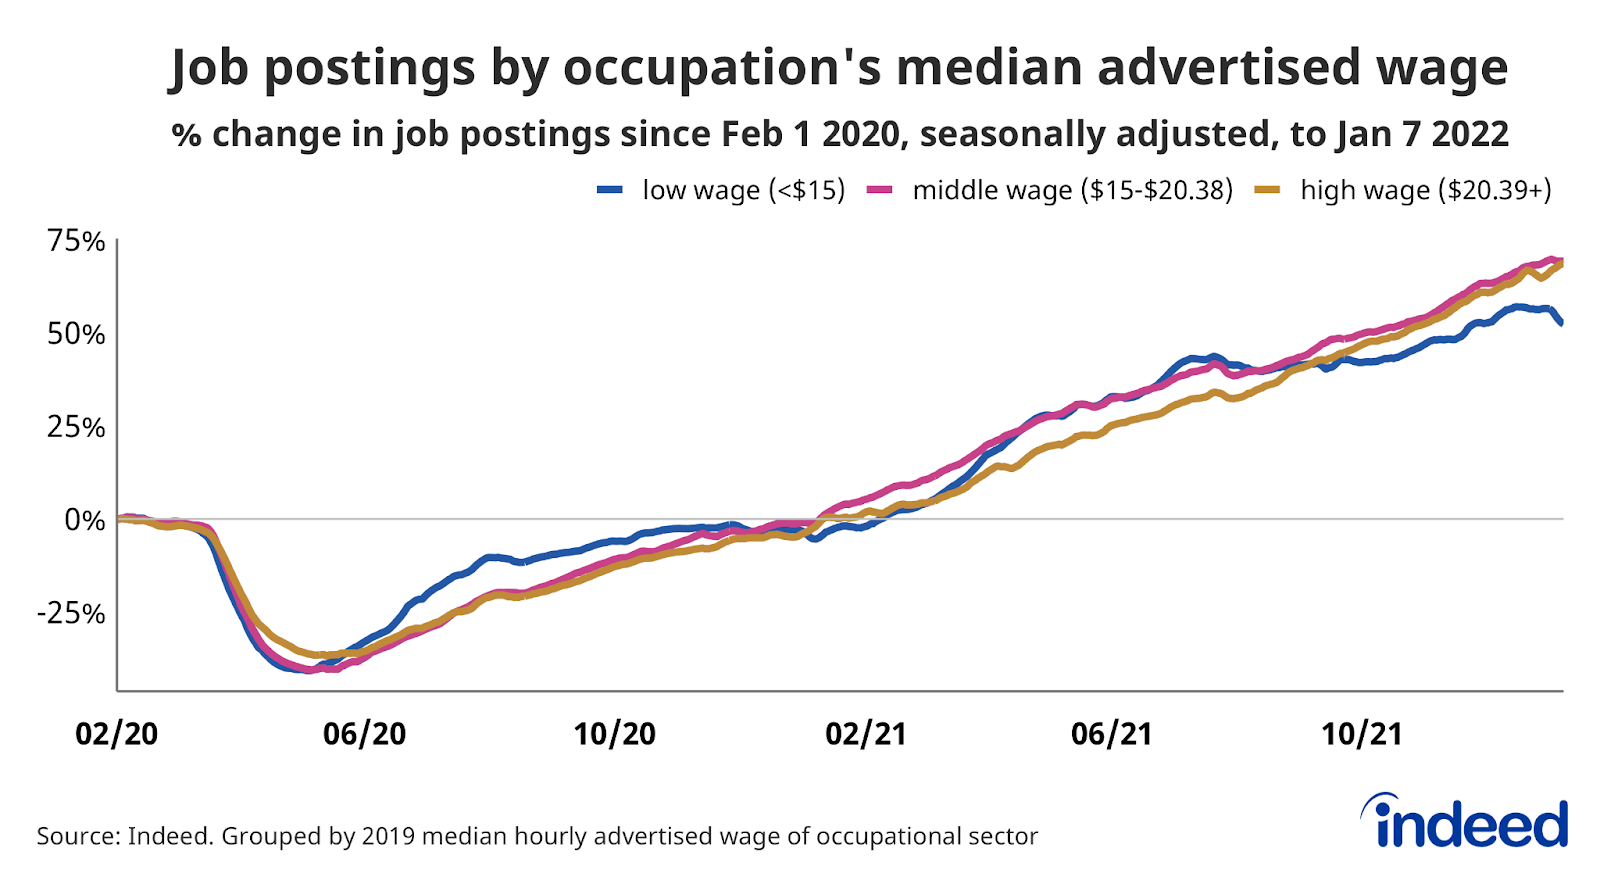
Job postings up across wage tiers
Job postings across occupational advertised wage tiers are well above their pre-pandemic baselines, but job postings in sectors that advertise lower wages have flattened the last few months. We define low advertised median hourly wage as below $15 per hour, middle wage as $15 to $20.38 per hour and high wage as at or above $20.39 an hour.
At the beginning of the pandemic, low advertised wage job postings, such as for loading & stocking and personal care & home health, recovered quickest and were often for critical roles as society shuttered at large. But since the delta surge in late summer, low advertised wage job postings lag middle and high advertised wage job postings, with a current spread of seventeen percentage points.
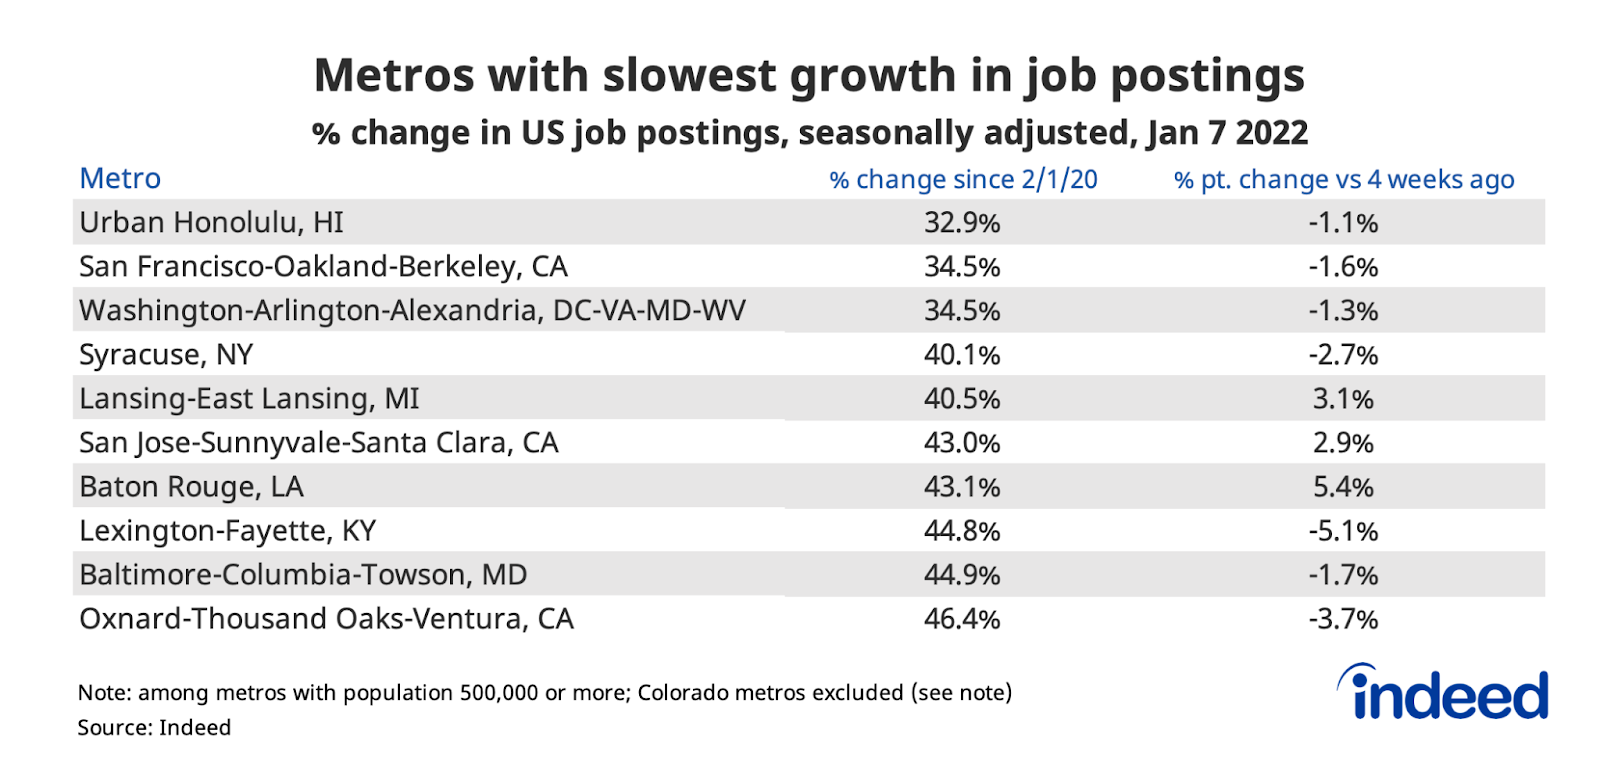
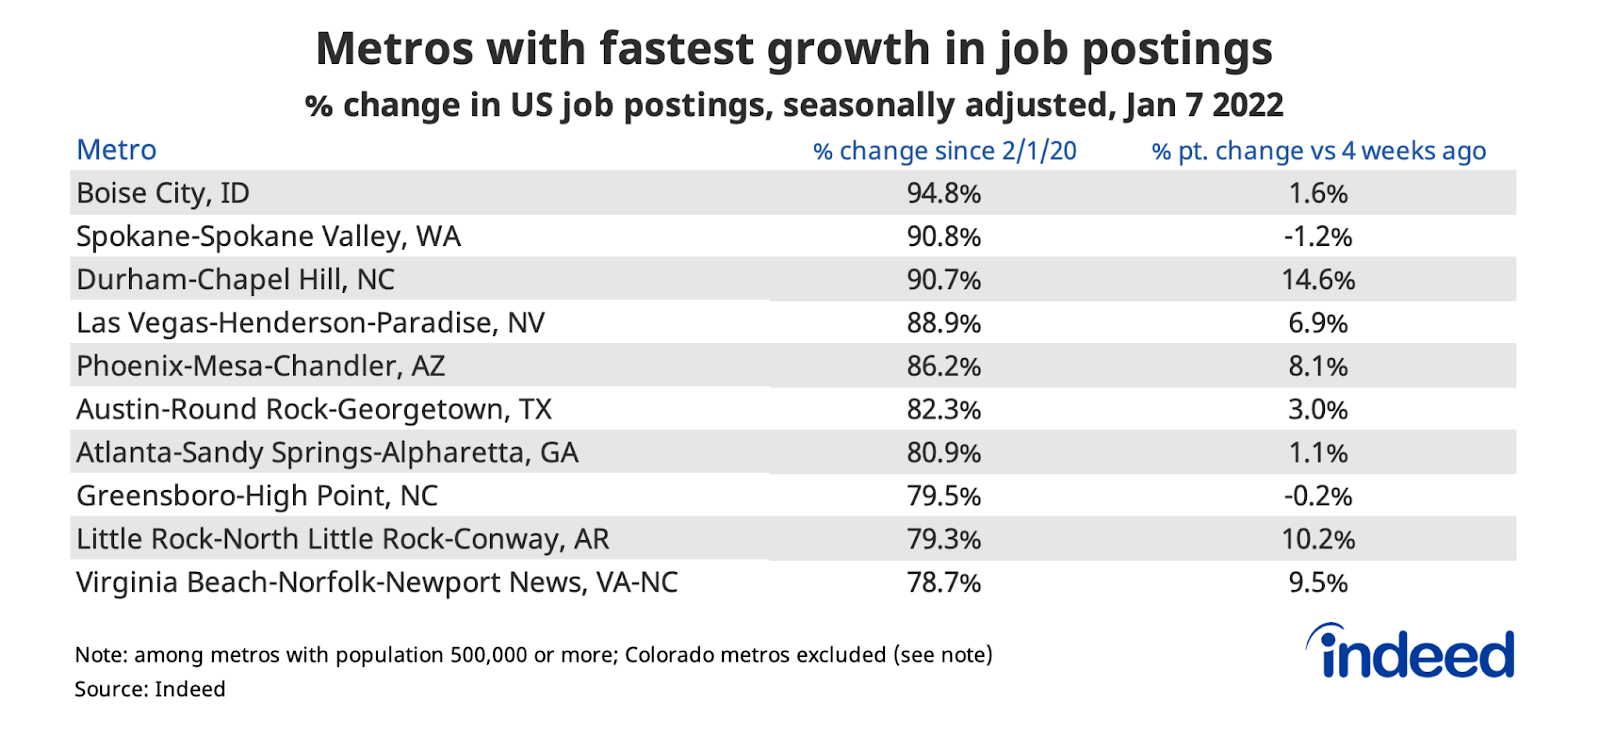
Job postings recovering across metros
Within the US, job postings are up essentially everywhere. Postings are at least 30% above the pre-pandemic baseline in all large metros. However, in the last four weeks, job postings grew only in three of the ten metros that have recovered slowest during the pandemic.
Job postings have grown fastest in Boise City, ID, up nearly 95% above pre-pandemic baseline as of January 7. Boise City, ID as well as Austin, TX and Phoenix, AZ have seen substantial job growth during the pandemic but also for decades beforehand.
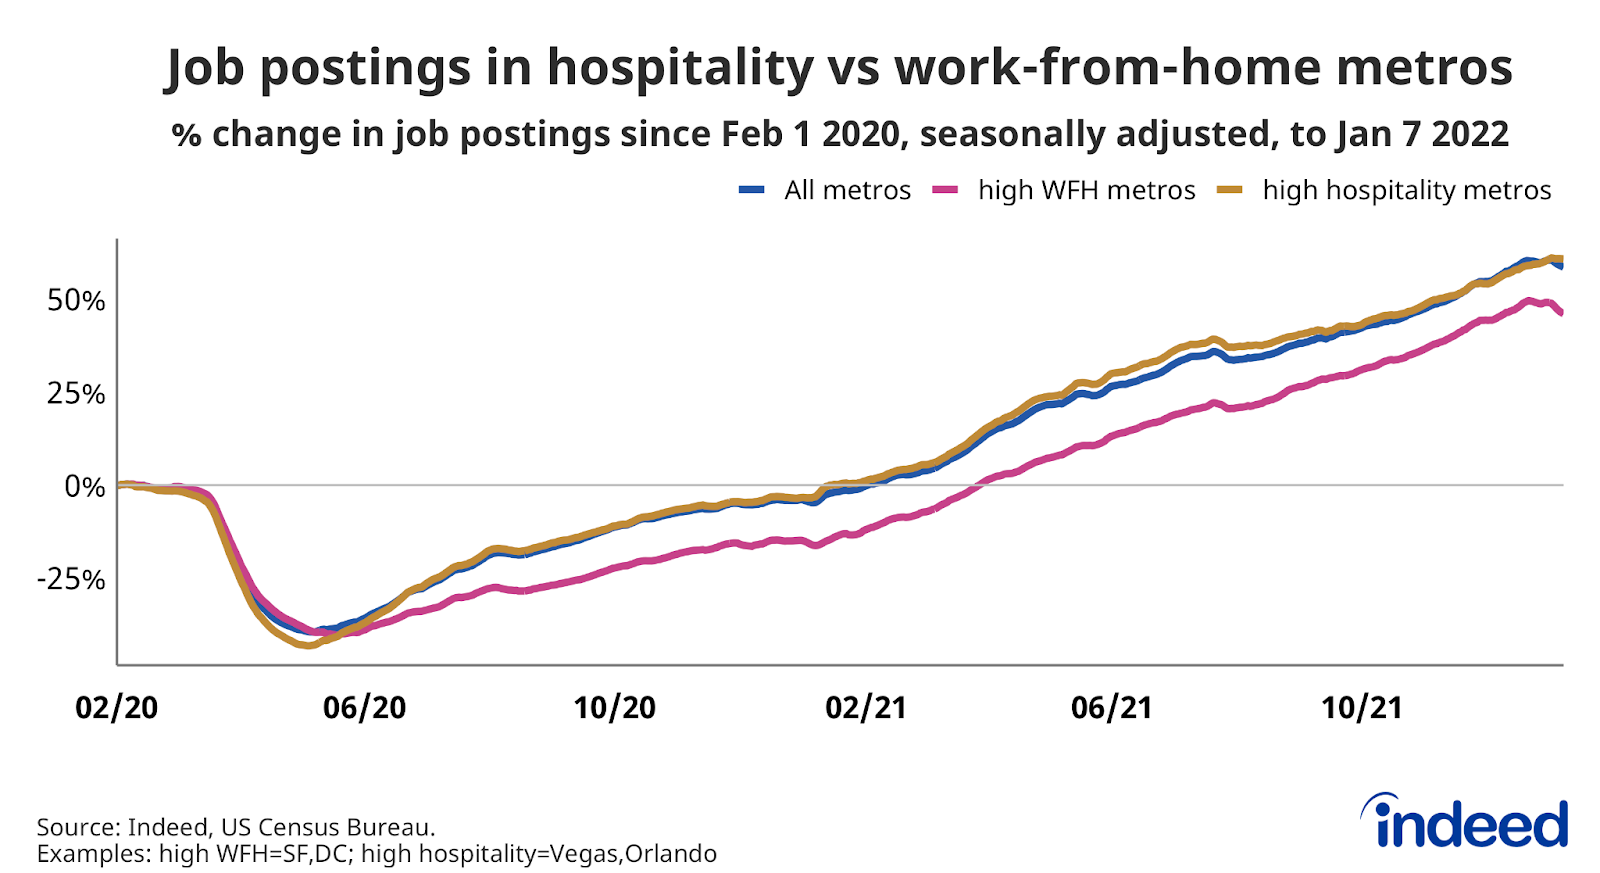
Metros where a higher share of people can work from home continue to recover more slowly than metros generally. These are mostly large metros with high education levels like tech hubs and finance centers. Throughout the pandemic, job postings rebounded more slowly in these metros. Postings in these metros finally rose above the pre-pandemic baseline at the end of March, but still lag all metros job growth by 13 percentage points. It’s too soon to say if the job postings in high work-from-home metros decline is simply end of year fluctuations or labor market damage from omicron.
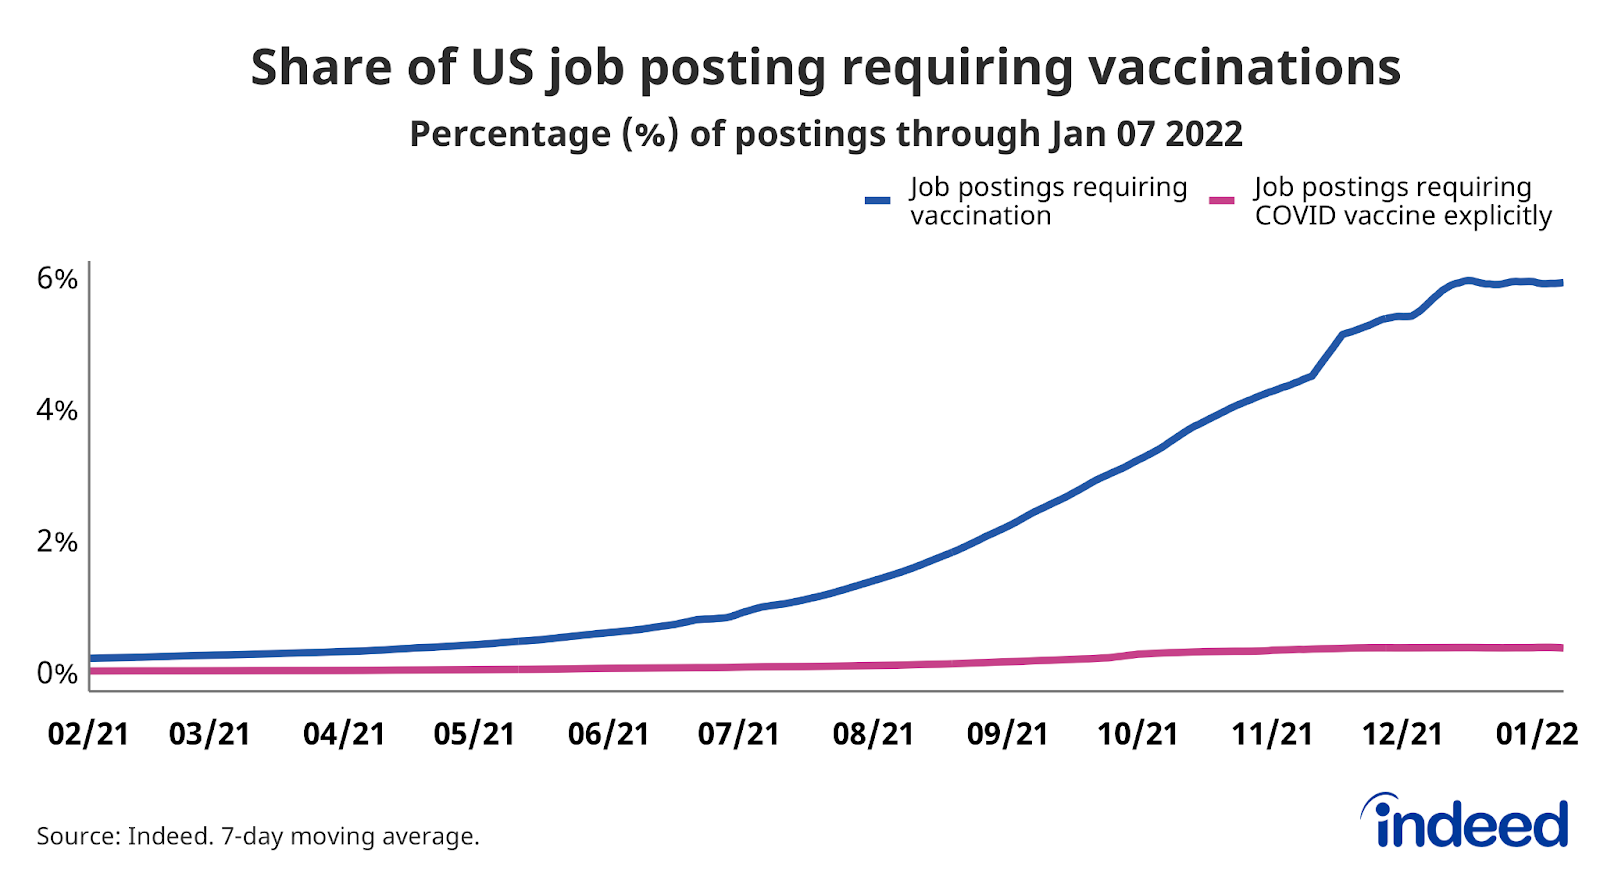
Job postings requiring vaccination rise further
Job postings advertising that vaccination is required continue to rise, now 5.9% of all US job postings on Indeed. At the state level, Oregon leads the pack with 11.3% of its job postings requiring vaccination. Regionally, the West Coast and mid-Atlantic region had higher shares of job postings requiring vaccination than other parts of the country.
We host the underlying job-postings chart data on Github as downloadable CSV files. Typically, it will be updated with the latest data one day after this blog post was published.
Methodology
All figures in this blog post are the percentage change in seasonally-adjusted job postings since February 1, 2020, using a seven-day trailing average. February 1, 2020, is our pre-pandemic baseline. We seasonally adjust each series based on historical patterns in 2017, 2018, and 2019. Each series, including the national trend, occupational sectors, and sub-national geographies, is seasonally adjusted separately. We adopted this new methodology in January 2021. Data for June 24-30, 2021, November 1, 2021 and January 1, 2022 are missing and were interpolated. The median hourly advertised wage of job postings is calculated by occupational sector for calendar year 2019.
Indeed no longer allows Colorado jobs that ask the candidate to disclose their previous salaries. This has a meaningful effect on our postings in the state of Colorado and its metros, though not on our national totals.
The number of job postings on Indeed.com, whether related to paid or unpaid job solicitations, is not indicative of potential revenue or earnings of Indeed, which comprises a significant percentage of the HR Technology segment of its parent company, Recruit Holdings Co., Ltd. Job posting numbers are provided for information purposes only and should not be viewed as an indicator of performance of Indeed or Recruit. Please refer to the Recruit Holdings investor relations website and regulatory filings in Japan for more detailed information on revenue generation by Recruit’s HR Technology segment.