We regularly update this report to track the pandemic’s effects on the labor market. Our methodology changed at the start of 2021, as explained in the methodology note at the end of the post.
Job postings on Indeed are a real-time measure of labor market activity. On May 21, 2021, they were 25.9% above February 1, 2020, the pre-pandemic baseline, after adjusting for seasonal variation. That’s unchanged from one week earlier.
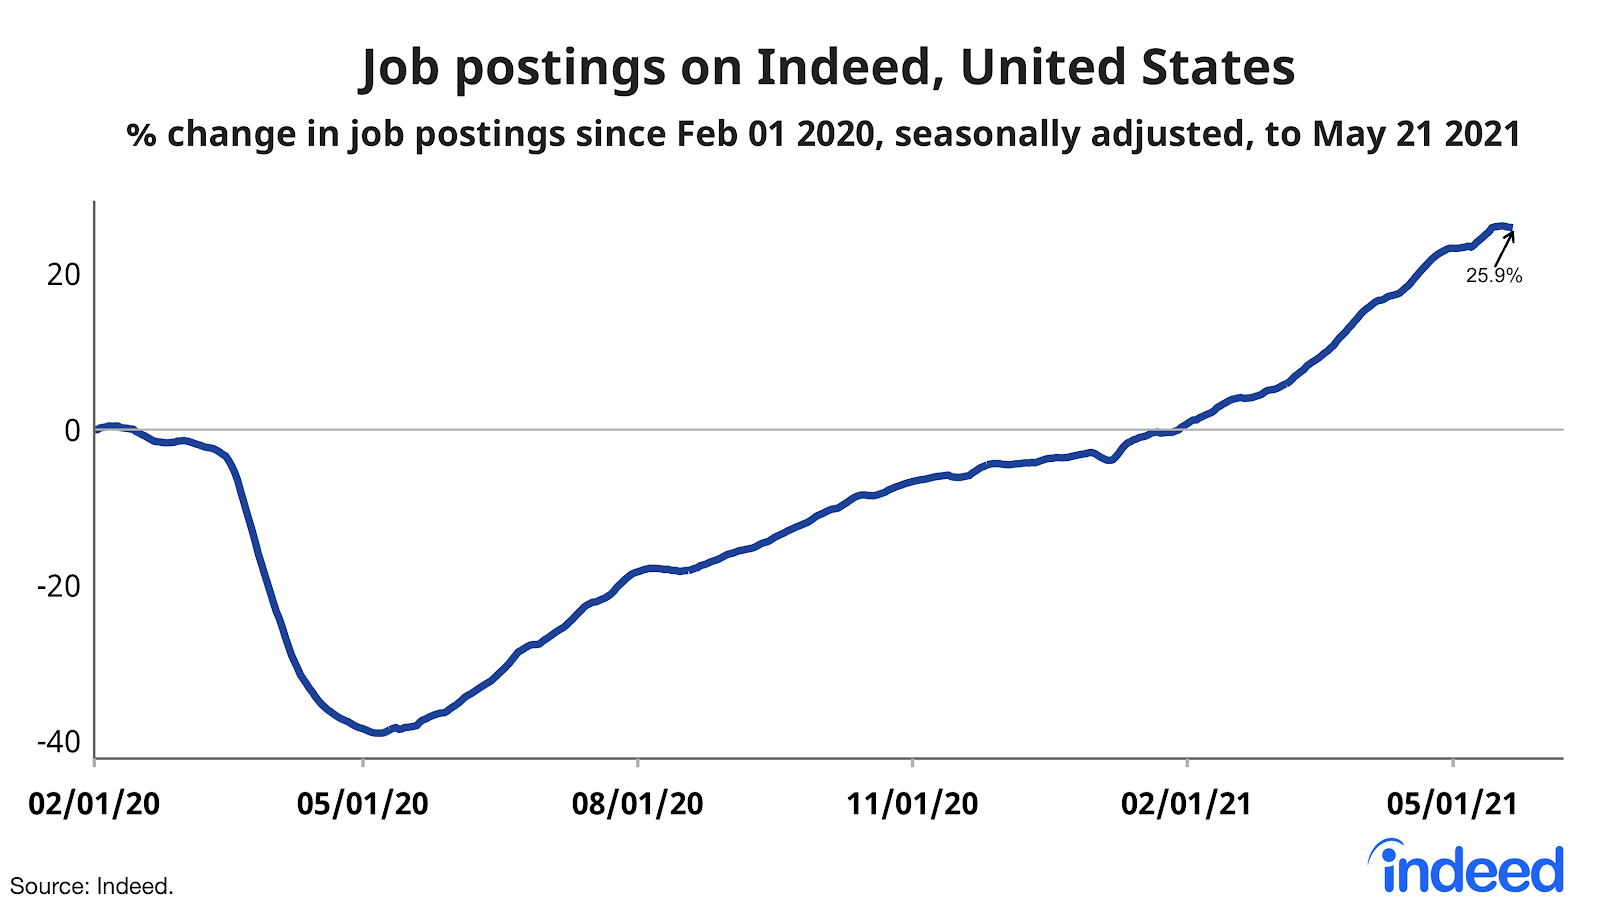
Job postings plunged in March and April 2020 to a low of 39% below the February 1, 2020, baseline. Job postings returned to the baseline on January 20, 2021, but that does not mean the labor market has fully recovered. Other measures of labor market health, like payroll employment and the headline unemployment rate, remain substantially worse than pre-pandemic. For employment to recover completely, job postings will have to remain above the pre-pandemic baseline for an extended time. Finally, in a few lagging sectors and metros, job postings remain below the pre-pandemic baseline.
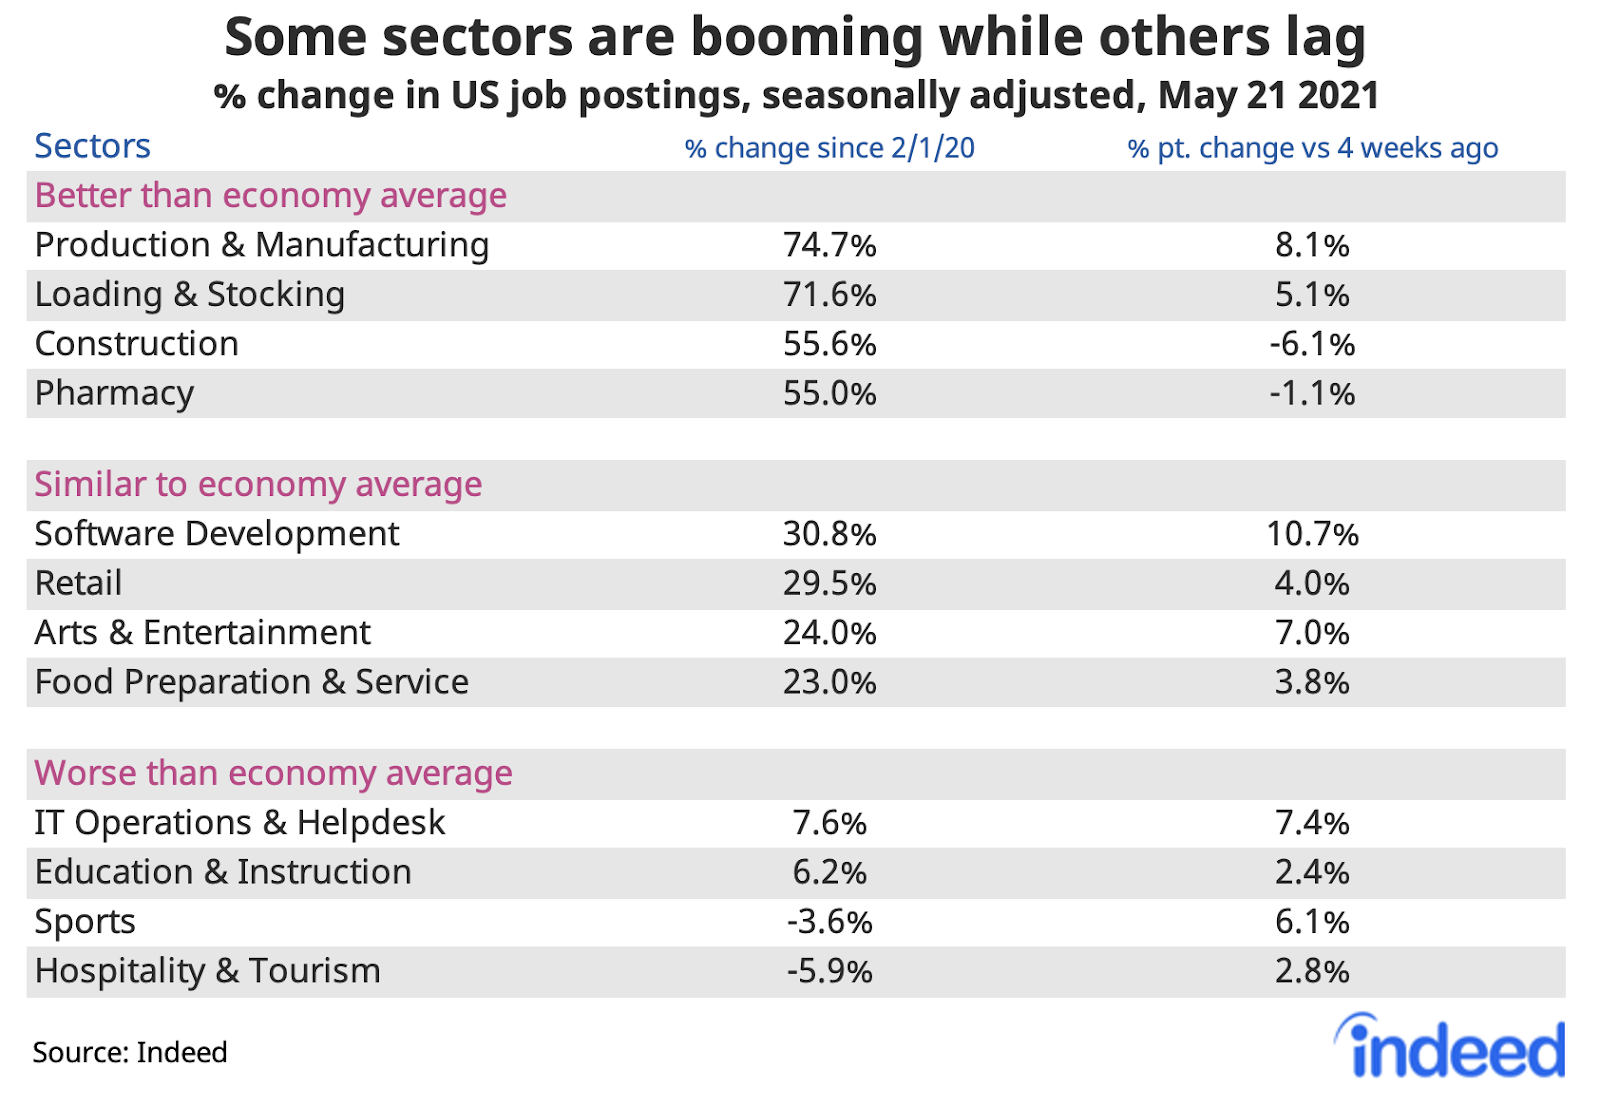
Big rebound in jobs that make & move stuff, but hospitality lags
Job postings in nearly all sectors are above the pre-pandemic baseline, led by goods-related sectors like manufacturing, loading & stocking, and construction. The big laggards remain hospitality & tourism and sports, which are still below the February 1, 2020, baseline despite recent improvements.
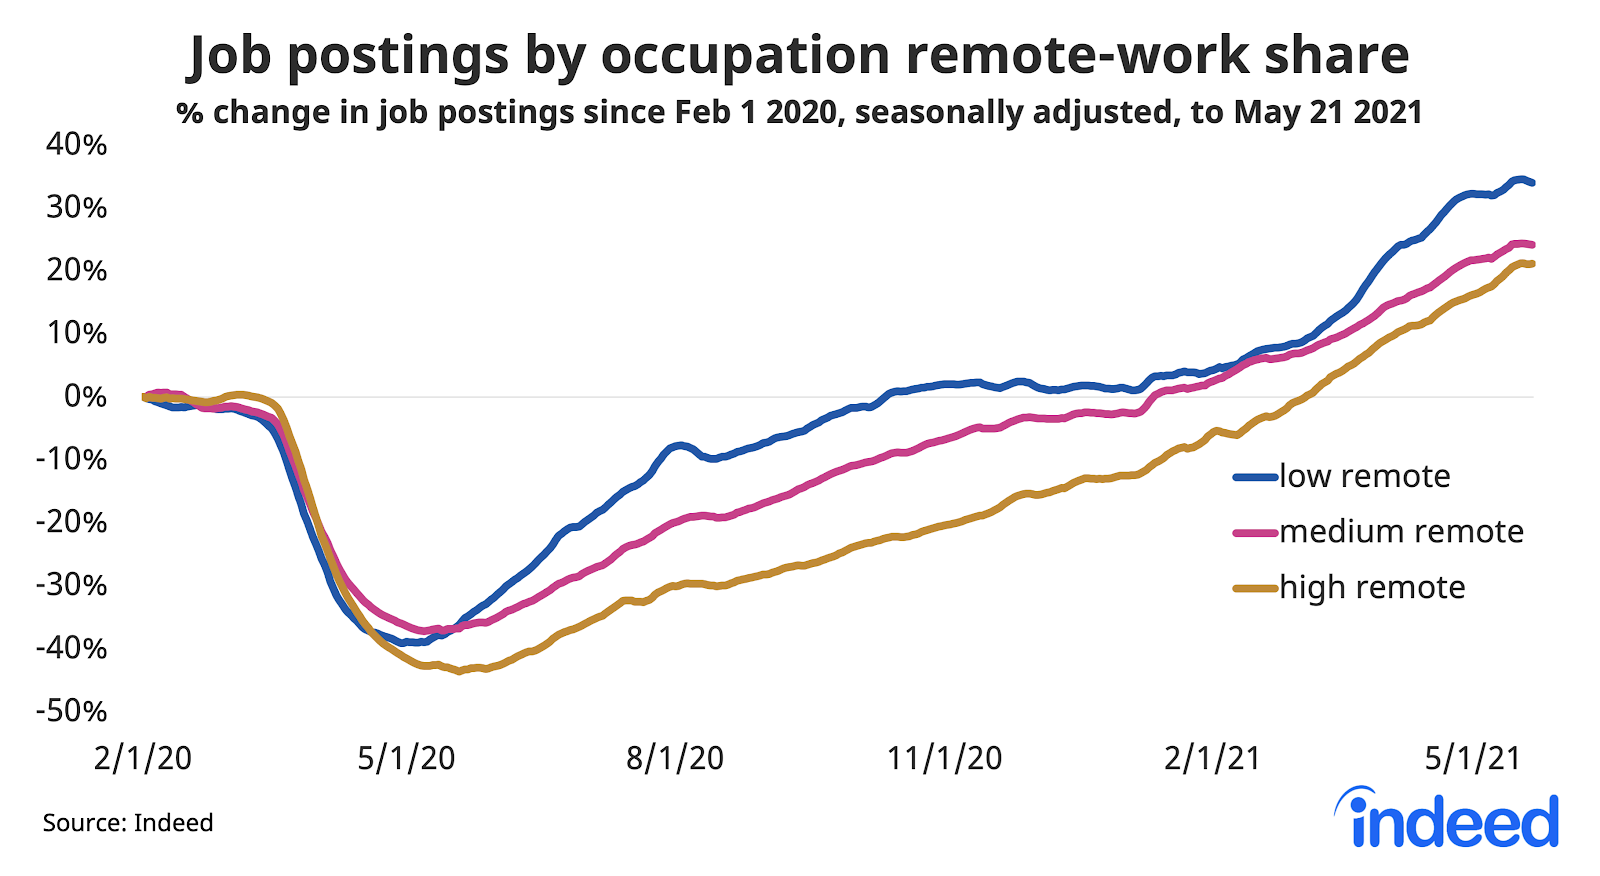
Postings for work that can’t be done from home recovered first and strongest. The shift to remote work in the pandemic created jobs in sectors that supported the stay-at-home economy, like driving and warehouse jobs, that aren’t themselves work-from-home jobs. But job postings in high-remote sectors have recovered, too.
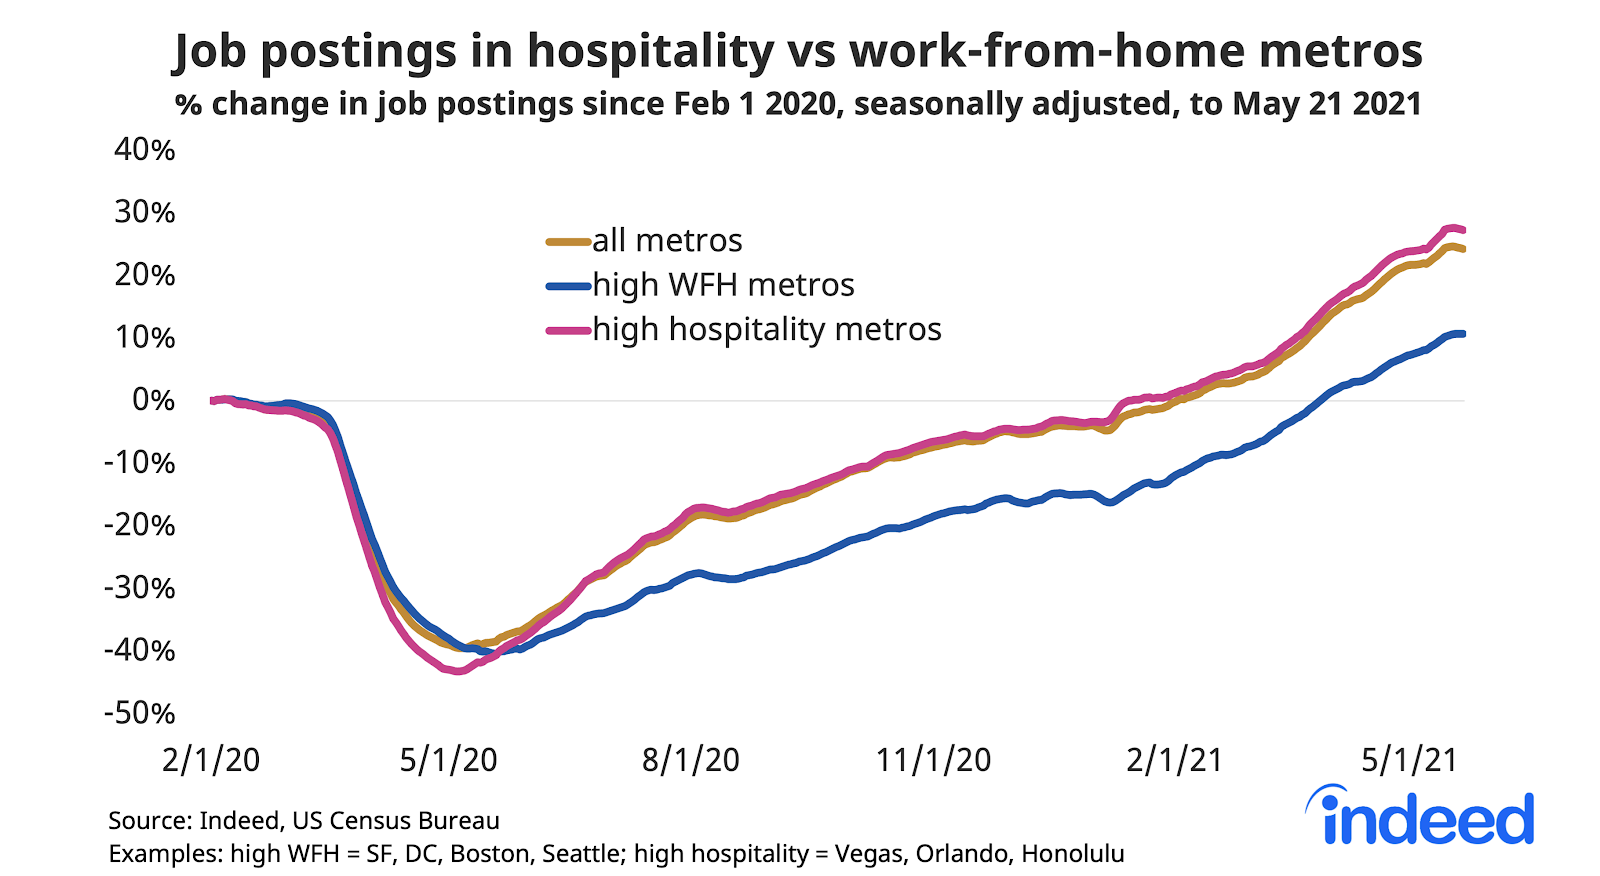
Metros where job postings have recovered more slowly
Within the US, job postings are still below the pre-pandemic baseline only in metro Honolulu. Postings are up in all regions of the country. Even in the San Francisco Bay Area, job postings are now back above the pre-pandemic baseline.
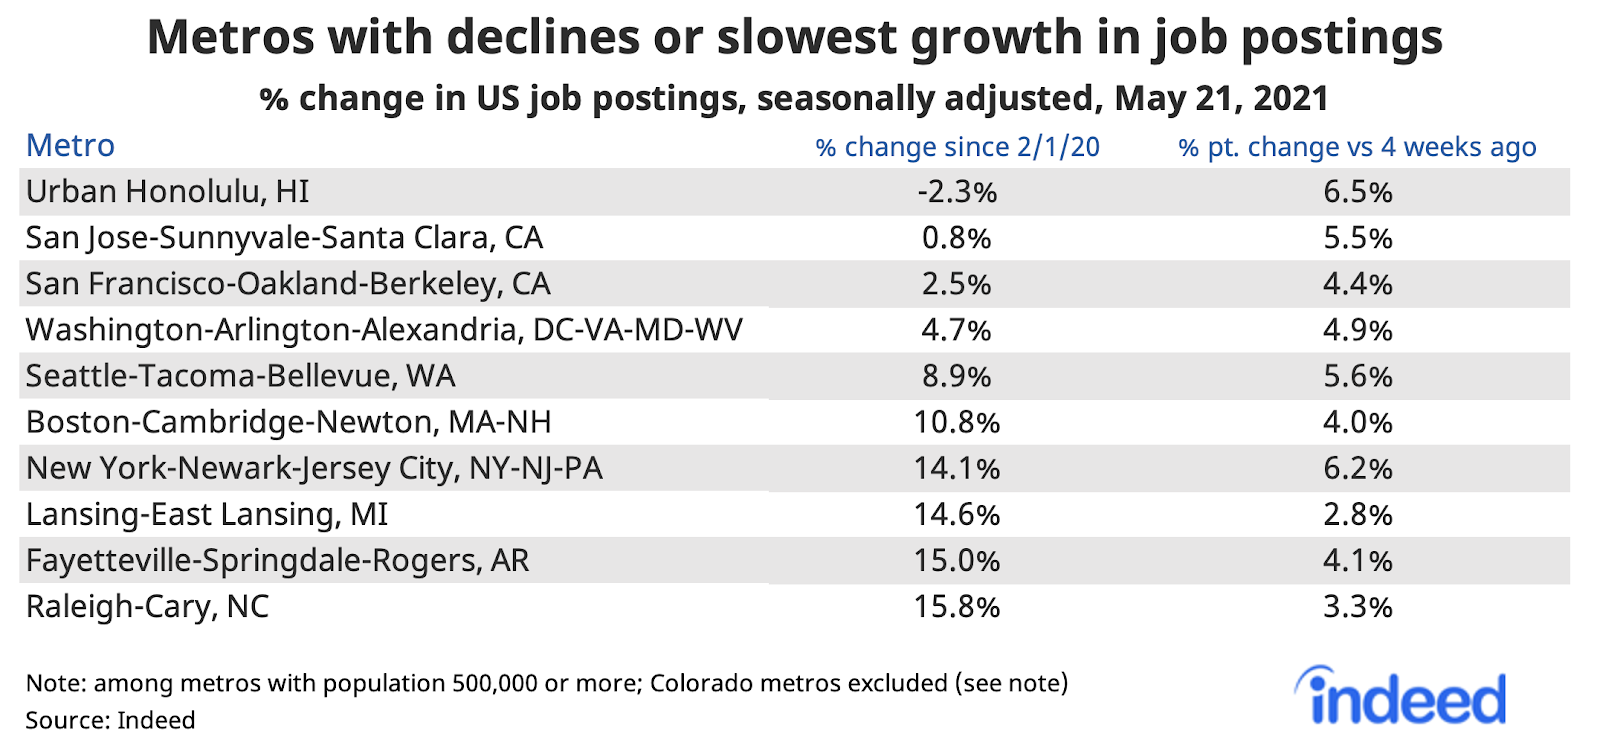
Job postings fell more initially in travel and tourism destinations. But job postings have rebounded more slowly in metros where a higher share of jobs can be done from home. In high work-from-home metros, postings in retail, restaurant, and personal-services jobs suffered. Postings in these metros finally rose above the pre-pandemic baseline at the end of March.
We host the underlying chart data on Github as downloadable CSV files. Typically, it will be updated with the latest data one day after this blog post was published.
Methodology
All figures in this blogpost are the percentage change in seasonally-adjusted job postings since February 1, 2020, using a seven-day trailing average. February 1, 2020, is our pre-pandemic baseline. We seasonally adjust each series based on historical patterns in 2017, 2018, and 2019. Each series, including the national trend, occupational sectors, and sub-national geographies, is seasonally adjusted separately. We adopted this new methodology in January 2021. This week we applied our quarterly revision, which updates seasonal factors and fixes data anomalies. Historical numbers have been revised and may differ from originally reported values.
Indeed no longer allows Colorado jobs that ask the candidate to disclose their previous salaries. This has a meaningful effect on our postings in the state of Colorado and its metros, though not on our national totals.
The number of job postings on Indeed.com, whether related to paid or unpaid job solicitations, is not indicative of potential revenue or earnings of Indeed, which comprises a significant percentage of the HR Technology segment of its parent company, Recruit Holdings Co., Ltd. Job posting numbers are provided for information purposes only and should not be viewed as an indicator of performance of Indeed or Recruit. Please refer to the Recruit Holdings investor relations website and regulatory filings in Japan for more detailed information on revenue generation by Recruit’s HR Technology segment.