
Key Points:
- Slowdown in job postings in 2023 has been broad-based, with only a handful of healthcare categories gaining momentum.
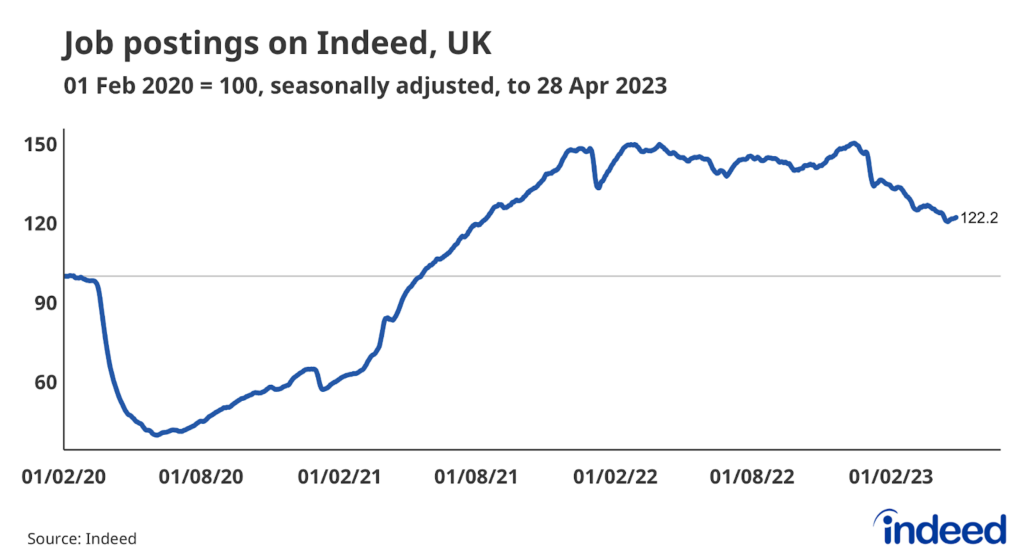
- Overall postings remain 22% above pre-pandemic baseline.
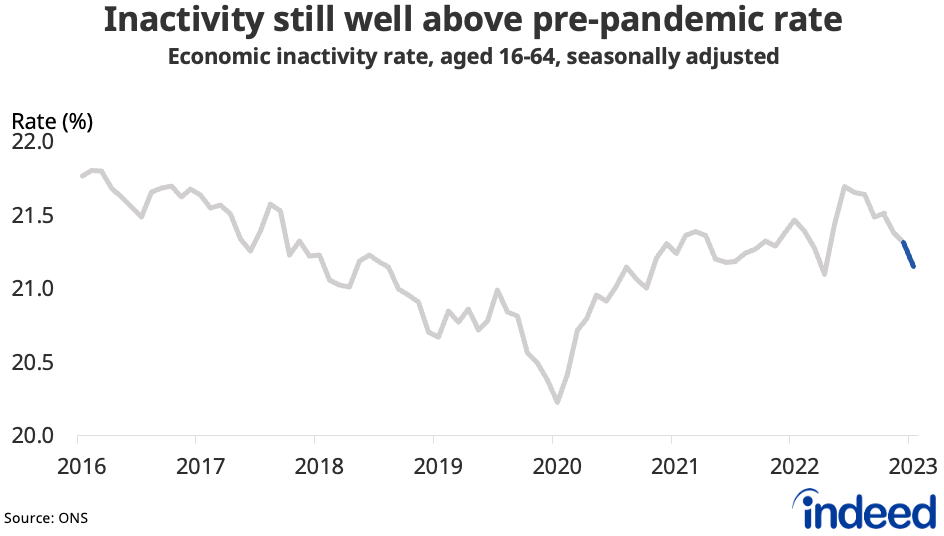
- Labour market remains tight, with unemployment low and inactivity still higher than pre-pandemic.
- Wage growth is strong in nominal terms but continues to lag behind high inflation.
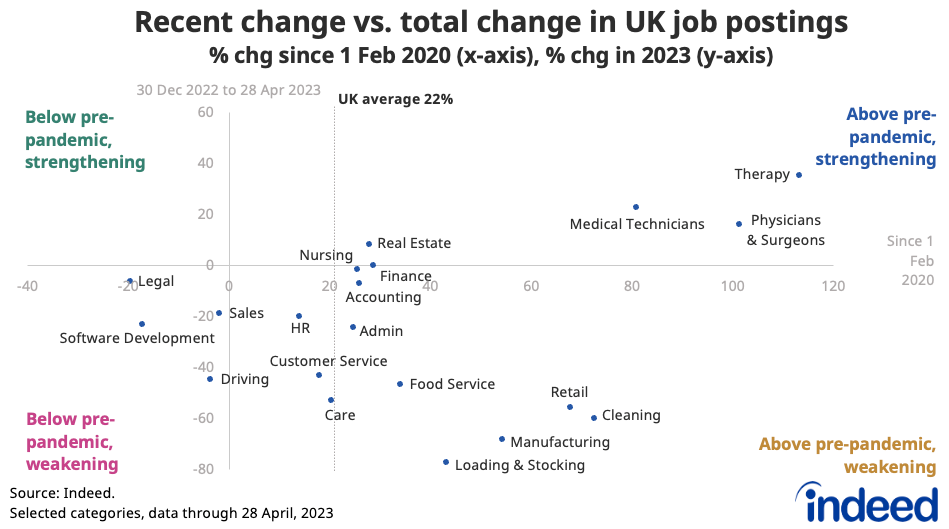
Spotlight: Most categories have seen a slowdown in job postings in 2023
Job postings have fallen across most occupations since the start of the year. Categories which saw particularly strong post-pandemic growth such as retail, cleaning & sanitation, production & manufacturing and loading & stocking have retreated substantially from previous peaks, albeit remain well above pre-pandemic levels.
Other categories including legal, software development, driving and sales now sit below pre-pandemic levels. Only a handful of healthcare categories including therapy, physicians & surgeons and medical technicians have seen strengthening job posting trends in 2023.
Indeed job postings signal a continued slowing in employers’ hiring appetite through April. As of 28 April, postings remained 22% above the 1 February 2020, pre-pandemic baseline, down from a peak of 50% last December.
Labour Market Overview
The latest Office for National Statistics (ONS) figures paints a mixed picture. The employment rate rose 0.2 percentage points (ppts) to 75.8%, though remains 0.8 ppts below its pre-pandemic level. Unemployment edged up 0.1ppts, but remains low at 3.8%.
We saw a further 0.4 percentage point drop in inactivity in the latest figures to 21.1%, the biggest drop in nine months, mainly driven by 16 to 24-year-olds as more students returned to the labour force. But inactivity due to long-term sickness continued to increase, hitting a new record high. Overall inactivity remains over 420,000 above pre-pandemic levels.
The Chancellor made inactivity a focus in last month’s Budget. The OBR estimates that his package of reforms — including an expansion of free childcare, more support for people with ill health and disabilities and tax incentives for older workers — may ultimately lower inactivity by about 100,000, taking effect over a period of several years.
Though optimism has been rising that the UK economy will avoid recession this year, we continue to see labour demand coming off the boil. Vacancies fell for the ninth consecutive period in the three months to March, down to 1,105,000, though they are still well above pre-pandemic levels.
The ratio of unemployed people to vacancies, one measure of labour market tightness, remains historically low at 1.2.
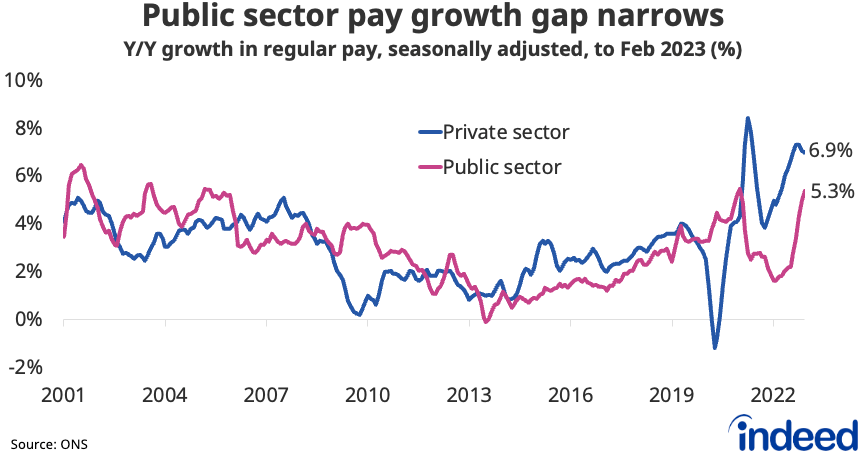
Strong wage growth eroded by high inflation
Regular wage growth remained high at 6.6% y/y in the three months to February, but eased back a touch from 6.7%. Moreover, after accounting for high inflation, real wages continued to be squeezed at one of the sharpest rates on record at -2.3% y/y.
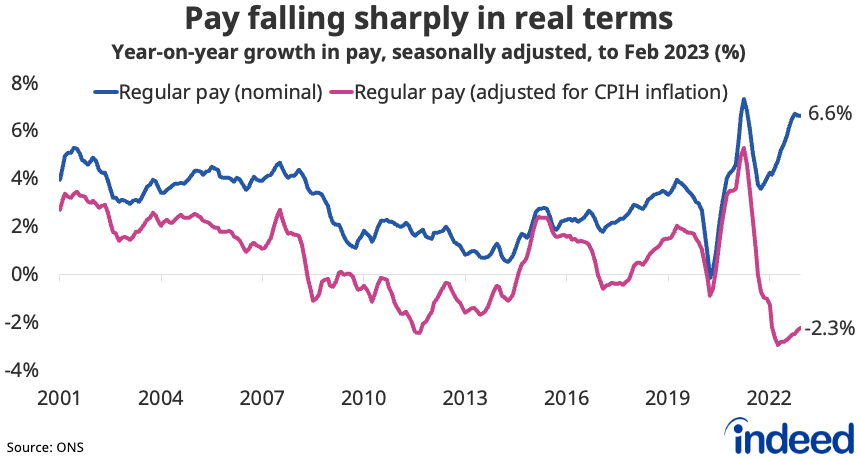
The gap between private (6.9%) and public (5.3%) sector regular wage growth continued to narrow, with the latter picking up to the strongest since 2005.
Conclusion
The UK labour market continues to cool as the post-pandemic hiring boom fades and businesses anticipate a period of sluggish economic performance. But with vacancies still high, unemployment low and inactivity challenges persisting, worker shortages remain an issue.
A key question is how long nominal wage growth stays high, with policymakers at the Bank of England in an uncomfortable position as workers continue to push for pay increases to keep up with the soaring cost of living. Expectations that inflation will drop sharply in the second half of the year promise respite, but that may not dissuade the Bank from raising interest rates further in the meantime to dampen fears of a wage-price spiral.
Hiring Lab Data
We host the underlying job-postings chart data on Github as downloadable CSV files. Typically, it will be updated with the latest data one day after this blog post was published.
Methodology
The Indeed Job Postings Index is a daily measure of labour market activity that is updated and will continue to be released weekly, superseding the Job Postings Tracker. The primary difference between the Indeed Job Postings Index and the legacy Job Postings Tracker is the level. The Indeed Job Postings Index is set to 100 on February 1, 2020, and this effectively provides a uniform level shift of 100 to the existing Job Postings Tracker across all time points.
The number of job postings on Indeed.com, whether related to paid or unpaid job solicitations, is not indicative of potential revenue or earnings of Indeed, which comprises a significant percentage of the HR Technology segment of its parent company, Recruit Holdings Co., Ltd. Job posting numbers are provided for information purposes only and should not be viewed as an indicator of performance of Indeed or Recruit. Please refer to the Recruit Holdings investor relations website and regulatory filings in Japan for more detailed information on revenue generation by Recruit’s HR Technology segment.