
Key Points:
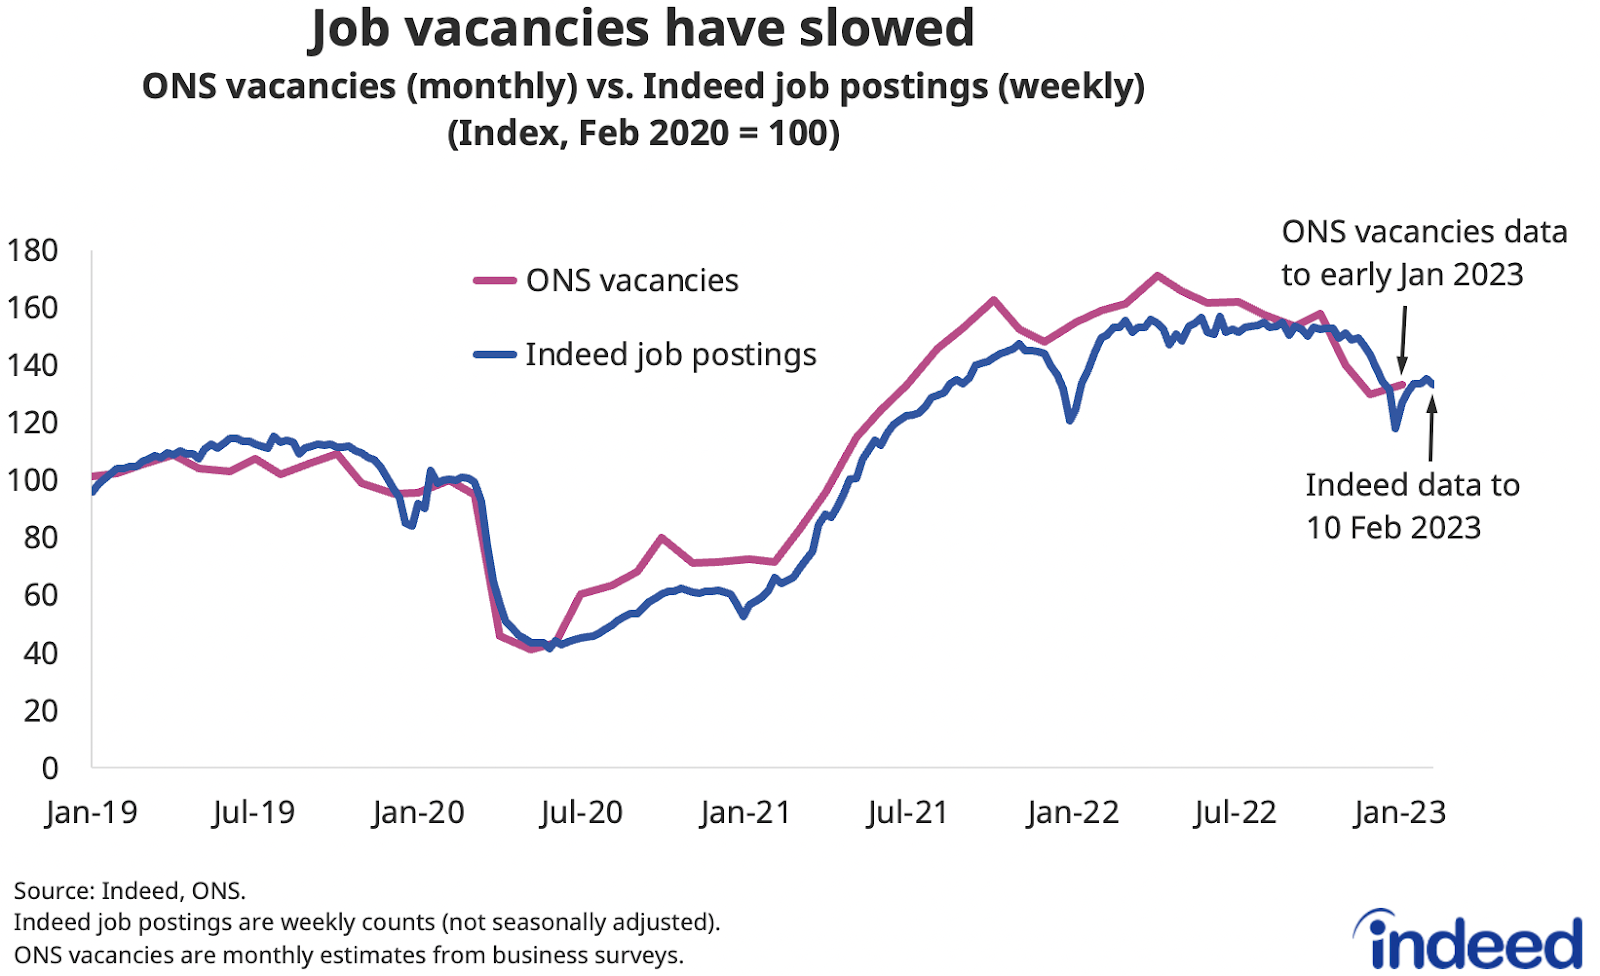
- Job vacancies are gradually declining from last year’s peaks.
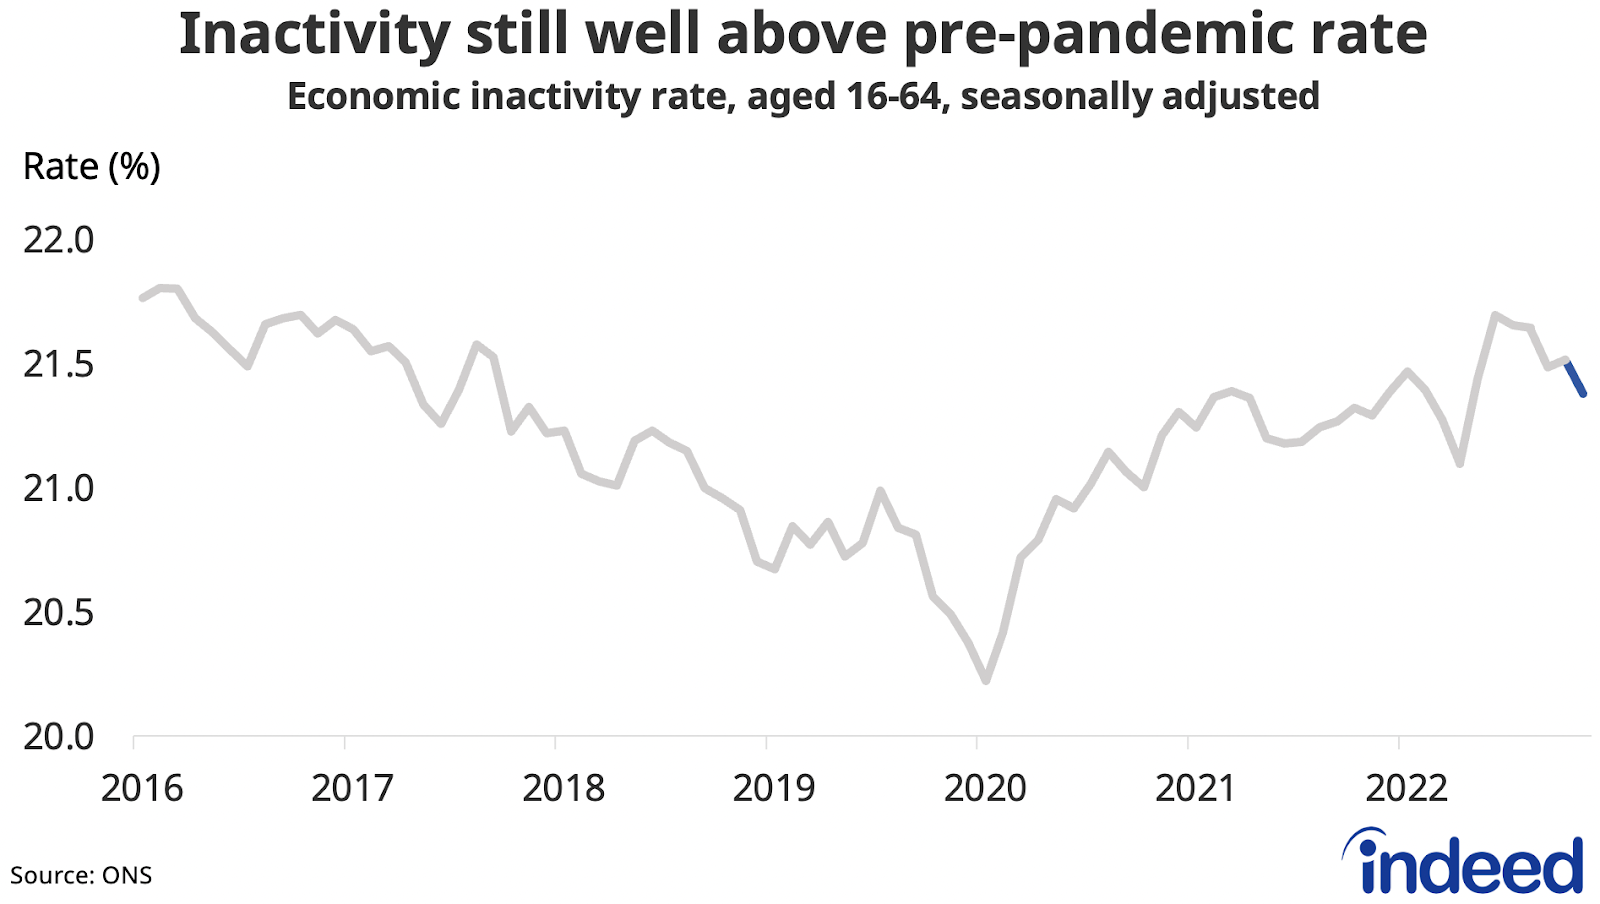
- Inactivity drops again in February, but still remains well above pre-pandemic levels, contributing to labour supply challenges.
- Wage growth remains strong, reflecting a labour market that is still tight, even as wages are eroded by even higher inflation.
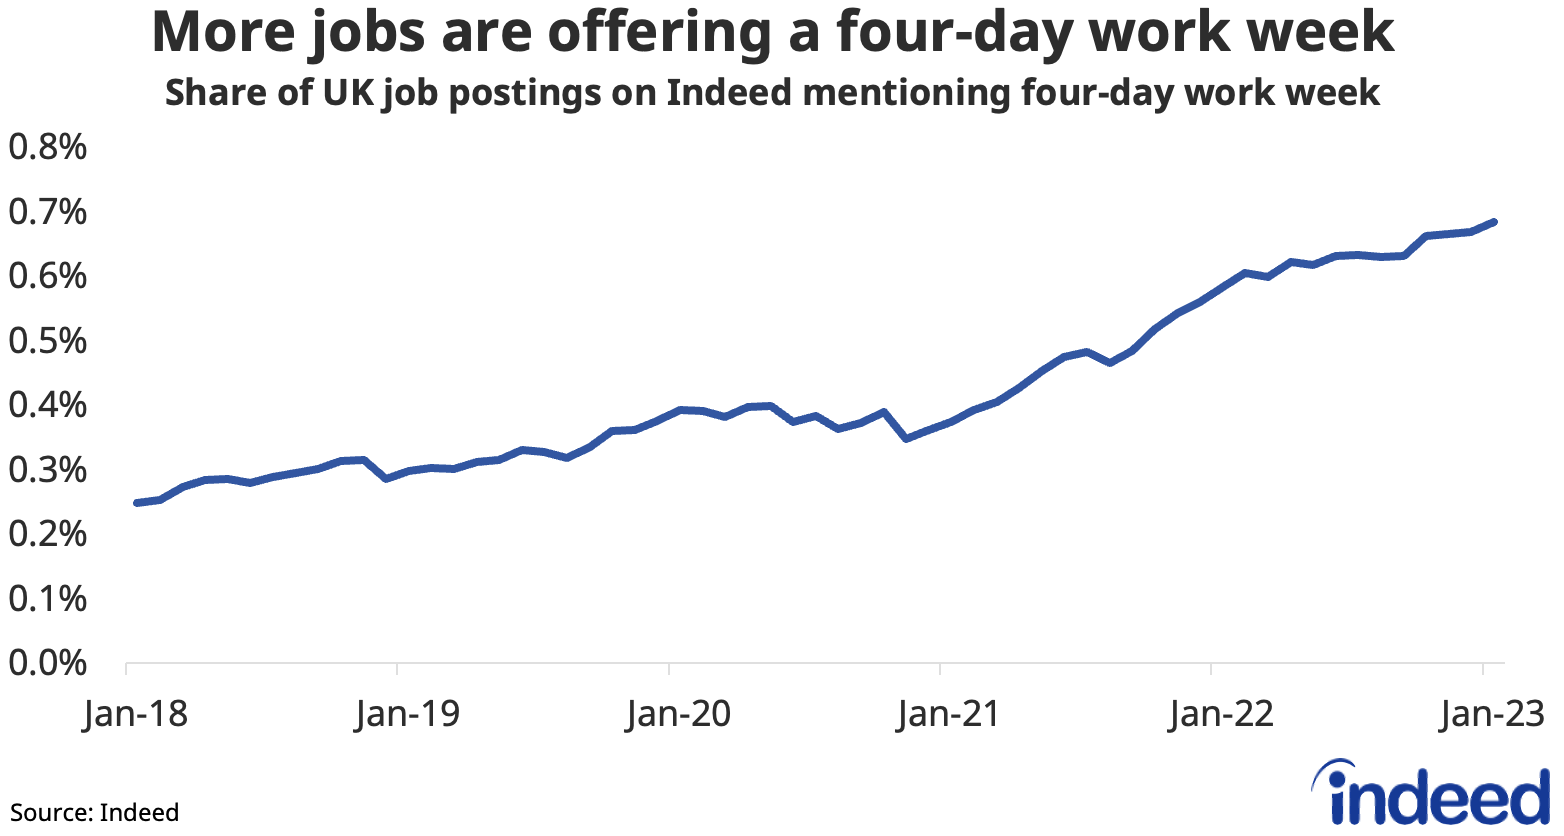
- More job postings are offering a four-day work week, as employers look for a competitive edge in a still-tight labour market.
Spotlight: More jobs are offering a four-day working week
The share of jobs offering a four-day working week has been rising. In January this year, 0.7% of UK job postings mentioned such arrangements. That’s up from 0.4% in 2021, and more than triple the measure of 0.2% five years ago. Healthcare, childcare, hospitality, and manufacturing job postings are among the most likely to offer four-day weeks.
Though these numbers represent a small share of overall postings, the popularity of four-day weeks has been gathering momentum as employers explore new ways to boost attraction and retention in a tight labour market. A national pilot scheme has been hailed as a success with the majority of participating employers opting to continue the arrangements.
Labour Market Overview
The latest Office for National Statistics (ONS) figures show further cooling in the labour market, though it remains tight. Vacancies have retreated 22% from last year’s peak but, at just above one million, are still one-third higher than on the eve of the pandemic. Indeed job postings show a similar picture of softening from the highs seen last summer.
With the unemployment rate remaining low at 3.7% in the fourth quarter, the labour market remains historically tight with just 1.1 unemployed person per vacancy.
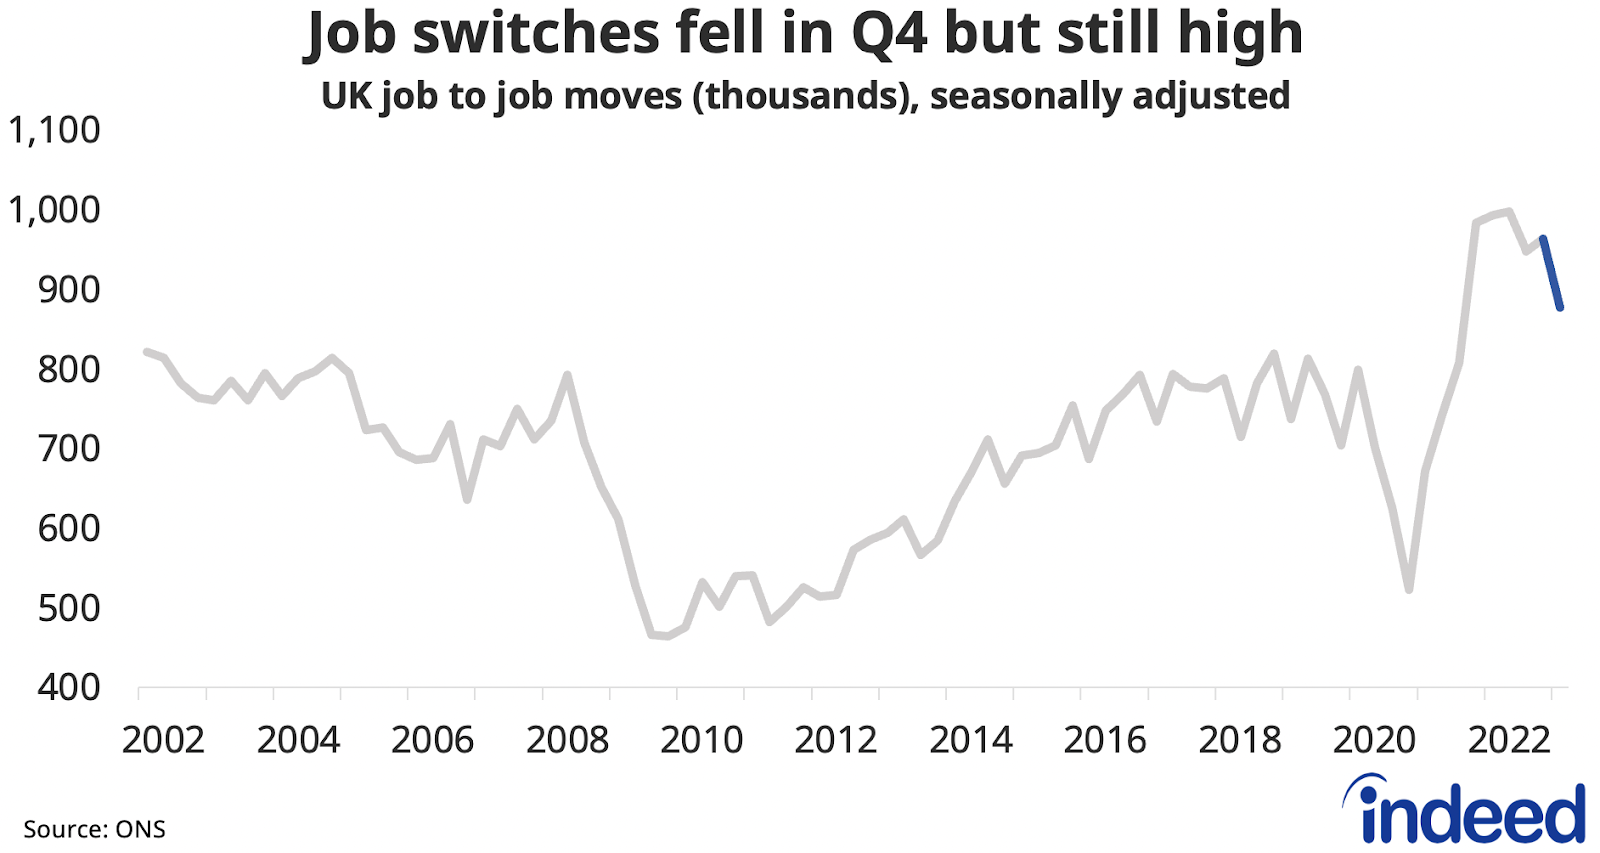
Job switching in the UK appears to be well past its peak, but at 876,000 was still high in the fourth quarter of 2022 compared to historical levels.
Meanwhile, there was a record-high net flow out of economic inactivity in the fourth quarter, driven by more students, retired and long-term sick moving into employment. At 21.4%, inactivity among working-age people is down from a peak of 21.7% last summer, but remains well above the 20.2% seen just before the pandemic. That shortfall of over 500,000 workers continues to be felt in staff shortages across many sectors.
That participation gap explains why the employment rate remains well below its pre-pandemic level.
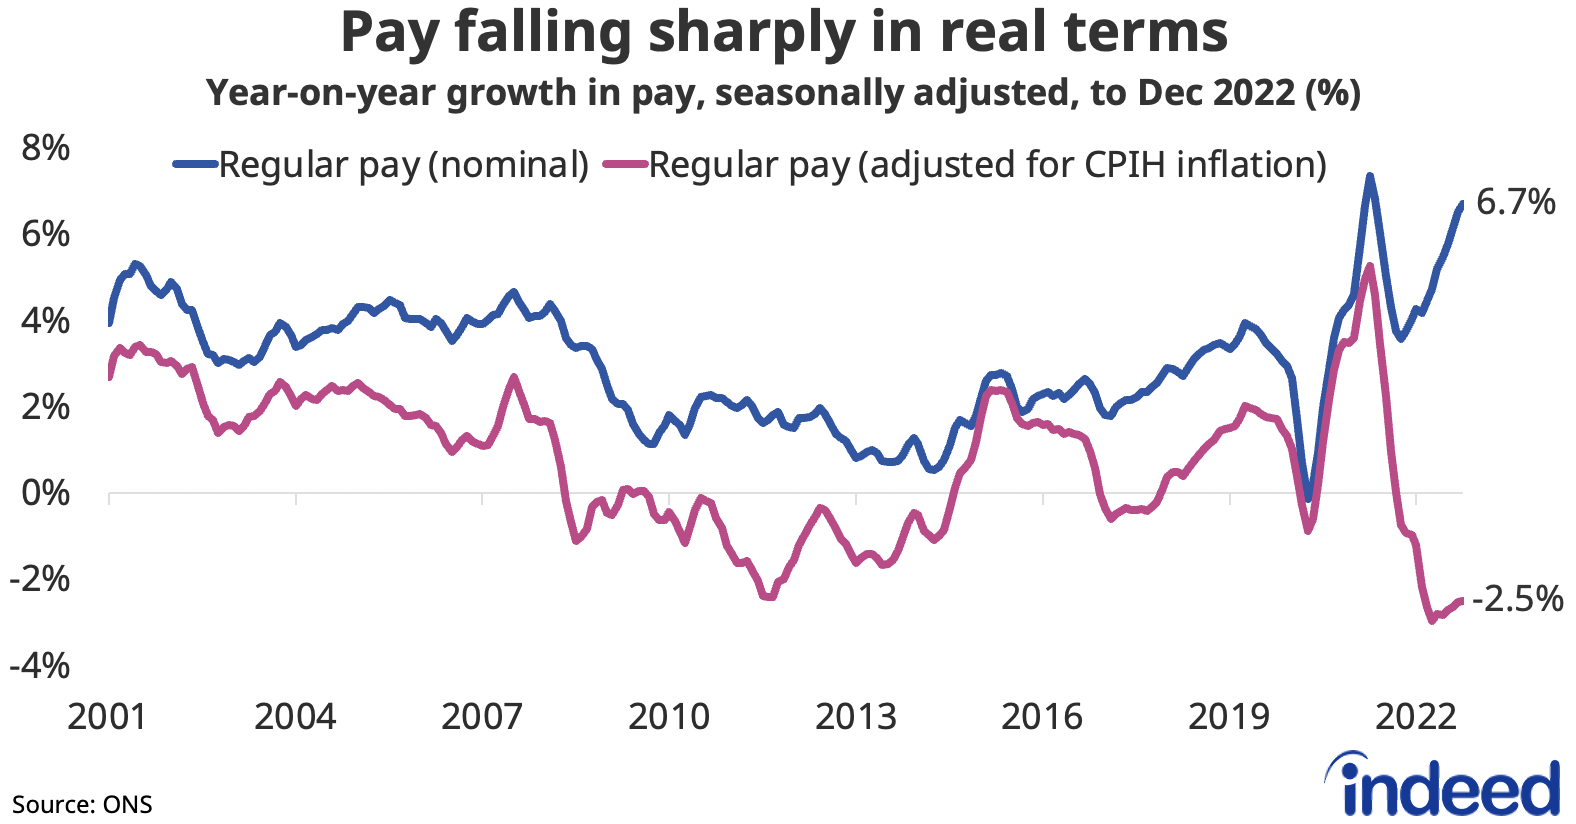
Strong wage growth eroded by high inflation
Regular pay growth accelerated to 6.7% year-on-year, the highest outside the pandemic period, keeping pressure on the Bank of England as it weighs how much further to raise interest rates. However, with inflation still very high, wages continue to be compressed in real terms, down 2.5% year-on-year.
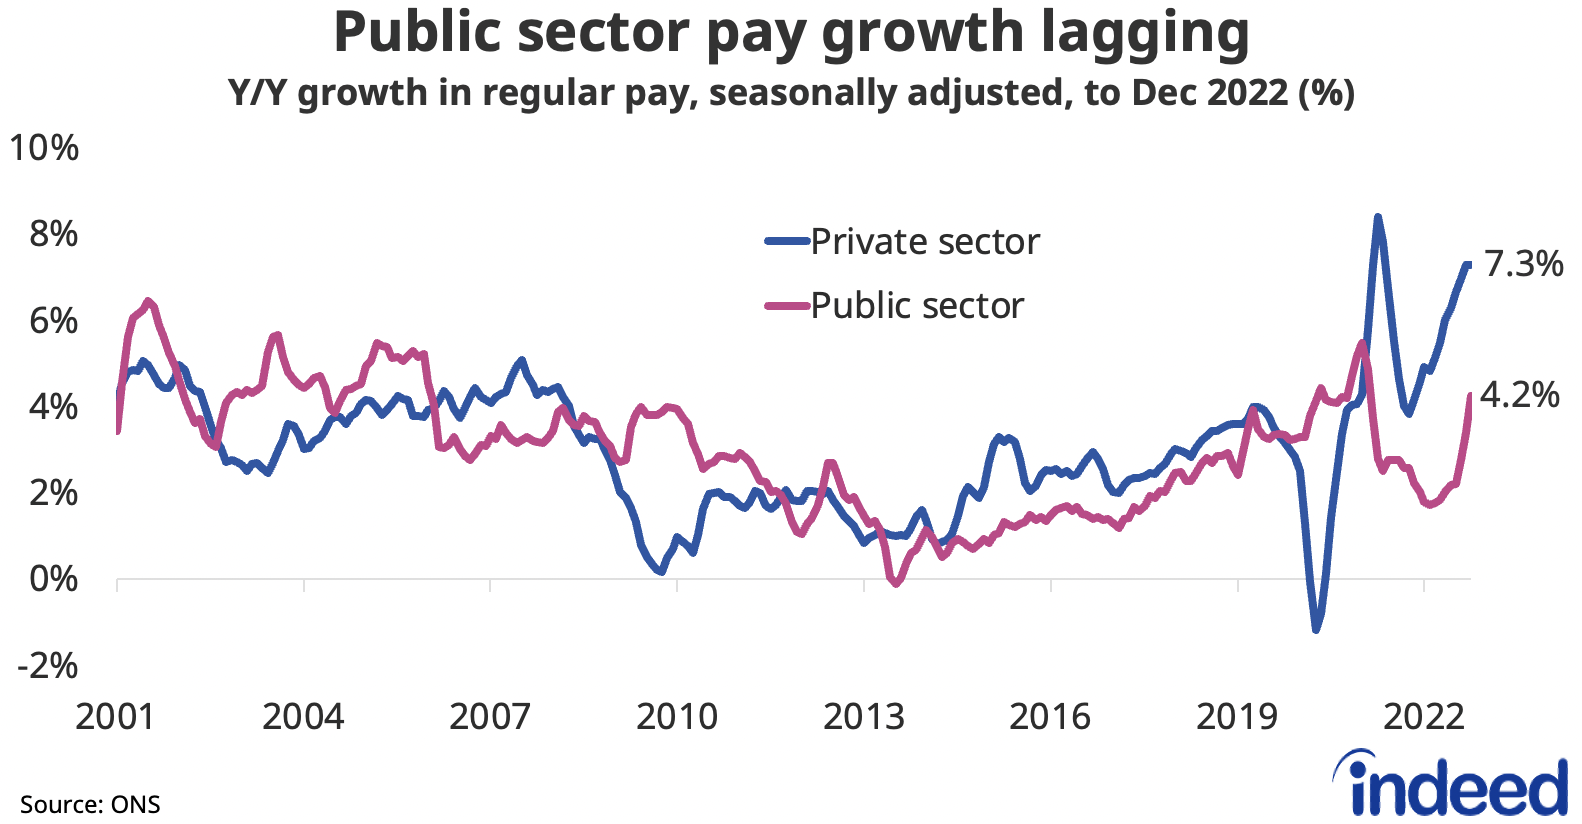
The gap in pay growth between the private sector (7.3% y/y) and the public sector (4.2% y/y) remains wide. Strikes across swathes of the public sector saw 843,000 days lost due to labour disputes, the highest since November 2011.
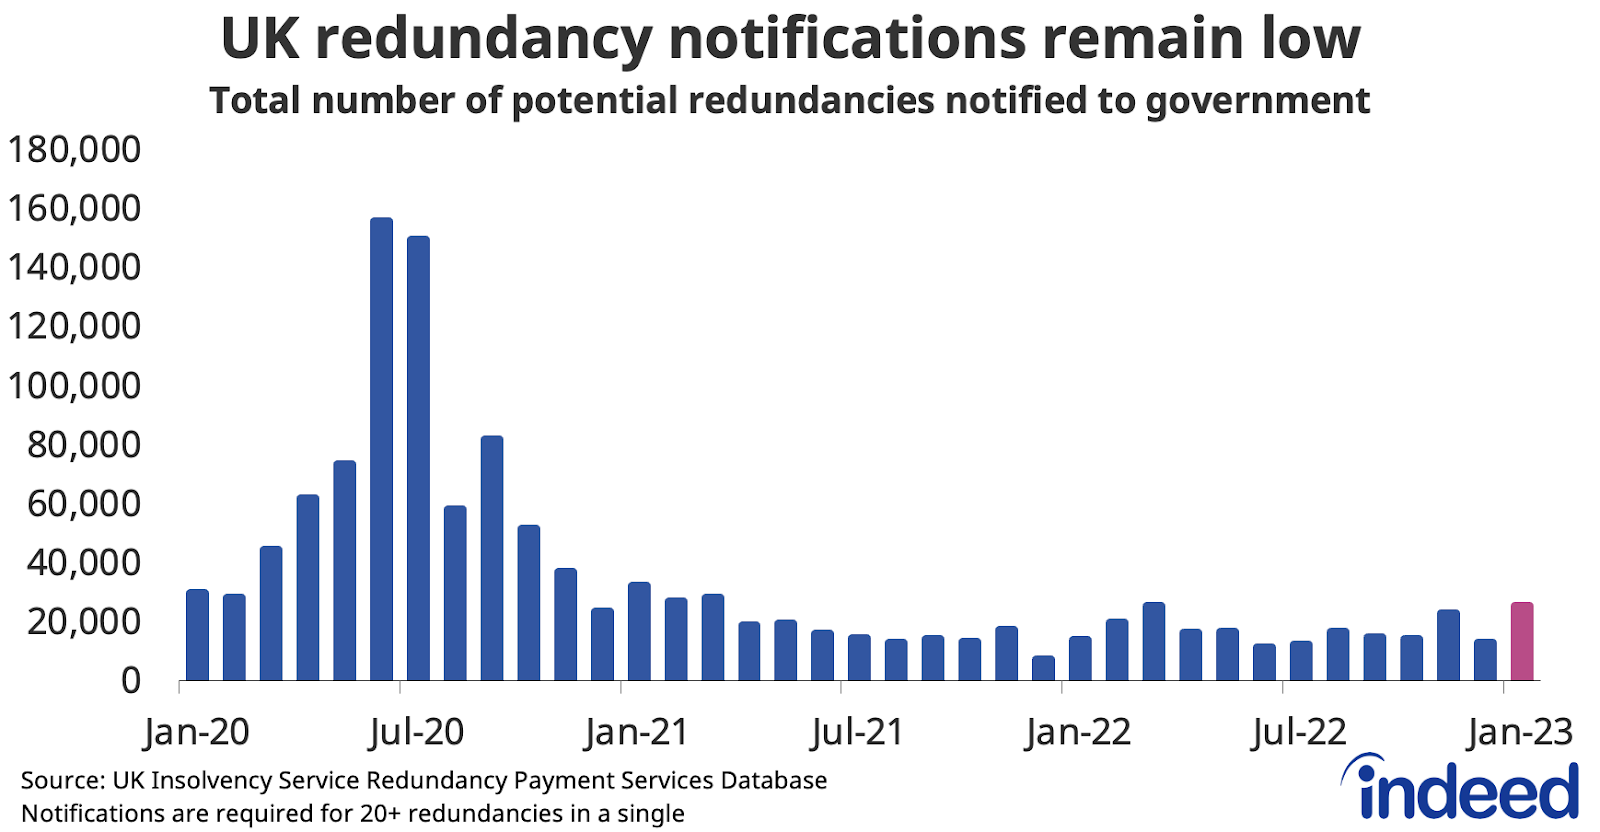
Redundancy notifications remain low
Though there has been a spate of high-profile corporate layoff announcements in the tech and professional services sectors recently and tech job postings are down significantly from their peaks, there remain few signs of a broader shake-out across the UK economy. Redundancy notifications ticked up in January but remain in a similar range to what we’ve seen over the past two years.
Conclusion
The UK labour market’s gradual rebalancing continues as the post-pandemic hiring boom fades and the economy enters a more uncertain period. Vacancies continue to drift down from elevated levels and there are some encouraging signs around participation. However, there remains a long way to go on the latter front with inactivity still much higher than before the pandemic, exerting a drag on the economy.
Constrained labour supply is one of the reasons the market remains so tight, which continues to generate strong nominal wage growth. That remains a concern for policymakers at the Bank of England as they weigh the appropriate tightening to get inflation down without derailing the economy. But high inflation means workers continue to face real-term pay cuts, reflected in the strained industrial relations we see today.
While the labour market is likely to soften further as the year progresses, hiring conditions don’t seem likely to get much easier any time soon and many employers continue to grapple with staffing gaps. A focus on attraction and retention is prompting many to review their offering to employees in a bid to gain a competitive advantage.
Hiring Lab Data
We host the underlying job-postings chart data on Github as downloadable CSV files. Typically, it will be updated with the latest data one day after this blog post was published.
Methodology
The Indeed Job Postings Index is a daily measure of labour market activity that is updated and will continue to be released weekly, superseding the Job Postings Tracker. The primary difference between the Indeed Job Postings Index and the legacy Job Postings Tracker is the level. The Indeed Job Postings Index is set to 100 on February 1, 2020, and this effectively provides a uniform level shift of 100 to the existing Job Postings Tracker across all time points.
The Indeed Wage Tracker calculates the median posted wage for each country, month, job title, region and salary type (hourly, monthly or annual). Within each country, we then calculate year-on-year wage growth for each job title-region-salary type combination, generating a monthly distribution. Our monthly measure of wage growth for the country is the median of that distribution.
The number of job postings on Indeed.com, whether related to paid or unpaid job solicitations, is not indicative of potential revenue or earnings of Indeed, which comprises a significant percentage of the HR Technology segment of its parent company, Recruit Holdings Co., Ltd. Job posting numbers are provided for information purposes only and should not be viewed as an indicator of performance of Indeed or Recruit. Please refer to the Recruit Holdings investor relations website and regulatory filings in Japan for more detailed information on revenue generation by Recruit’s HR Technology segment.