Key Points
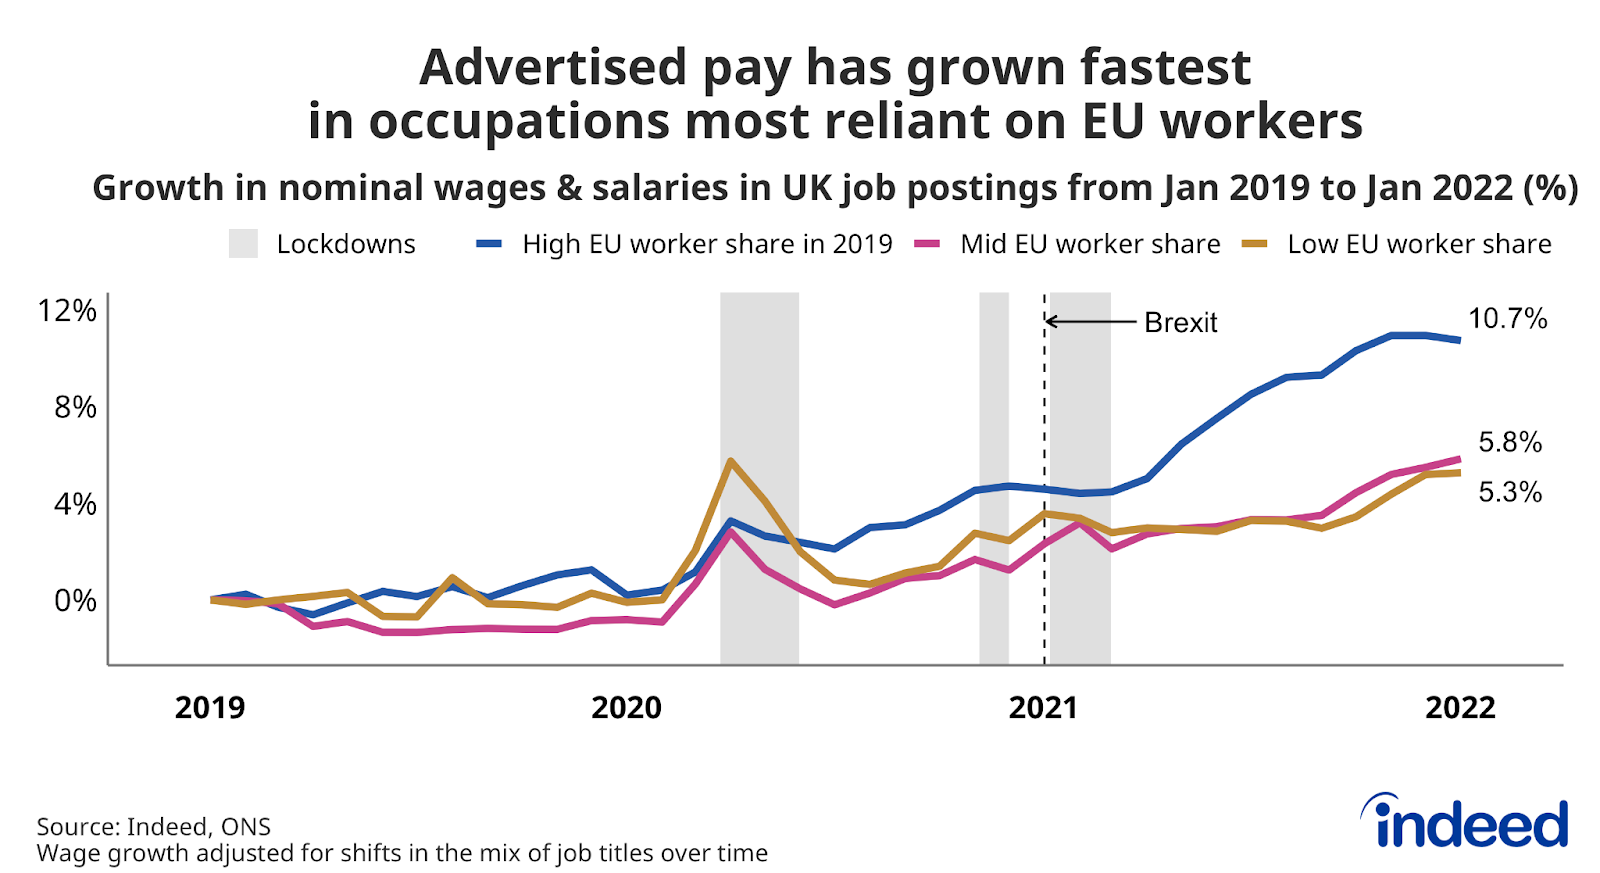
- UK occupations that employed more than one in ten EU nationals before the pandemic saw wages advertised in Indeed job postings climb 11% between 2019 and 2021, while those with fewer than one in twenty rose only 5%.
- Pay divergence widened after last spring’s reopening as rapid job posting growth led to labour shortages that could no longer easily be filled with EU workers.
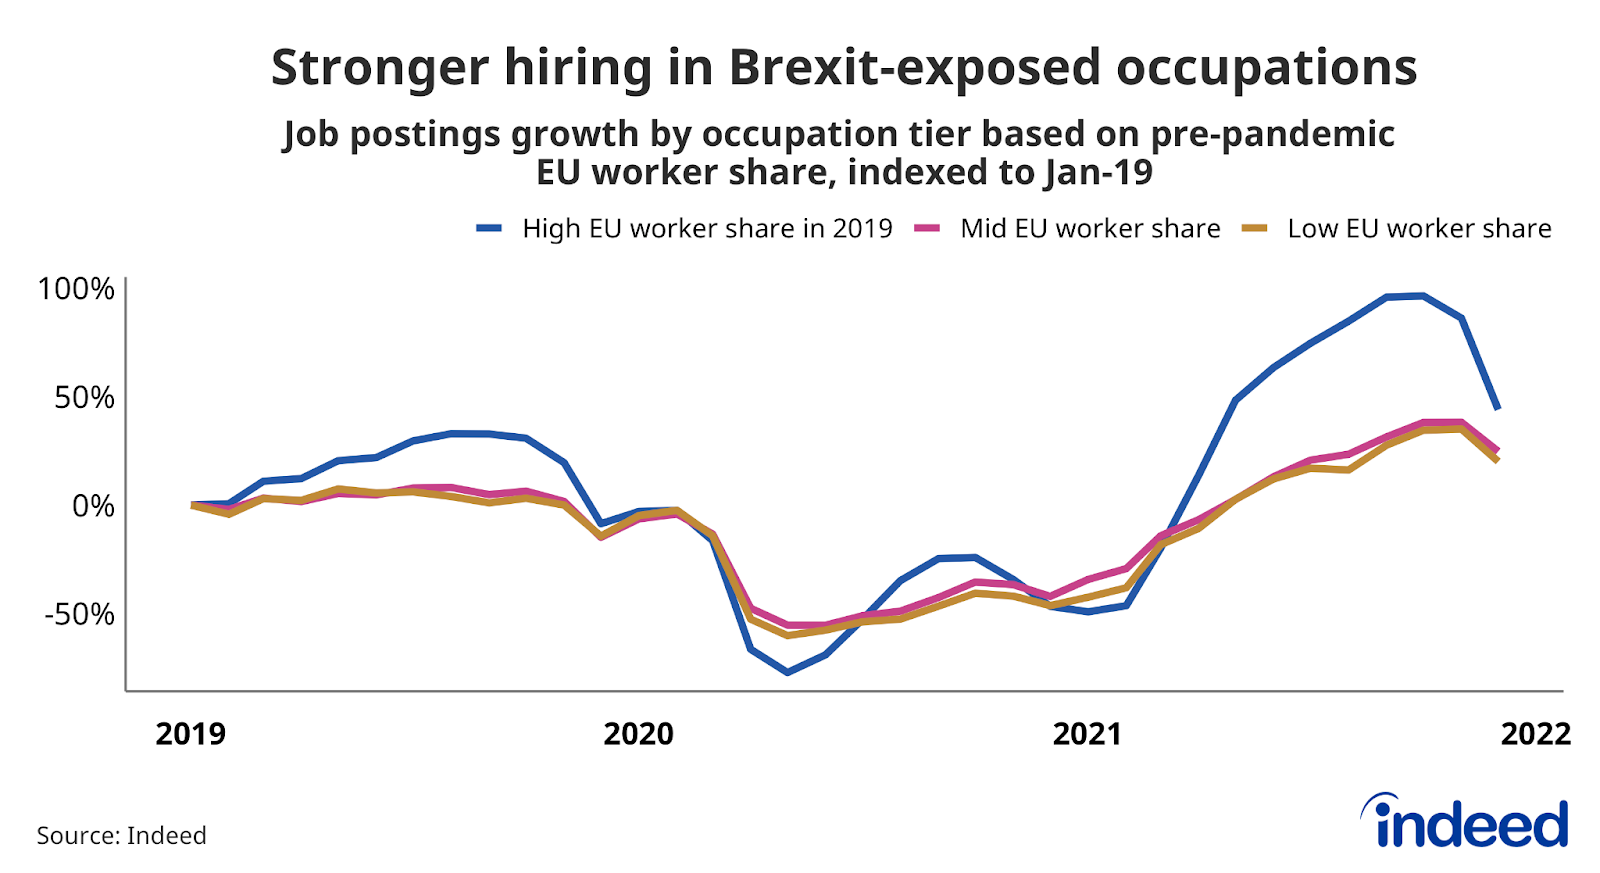
- Job postings in occupations with the highest reliance on EU workers reached double pre-pandemic levels last autumn compared with around 40% growth in ads for jobs less reliant on EU workers.
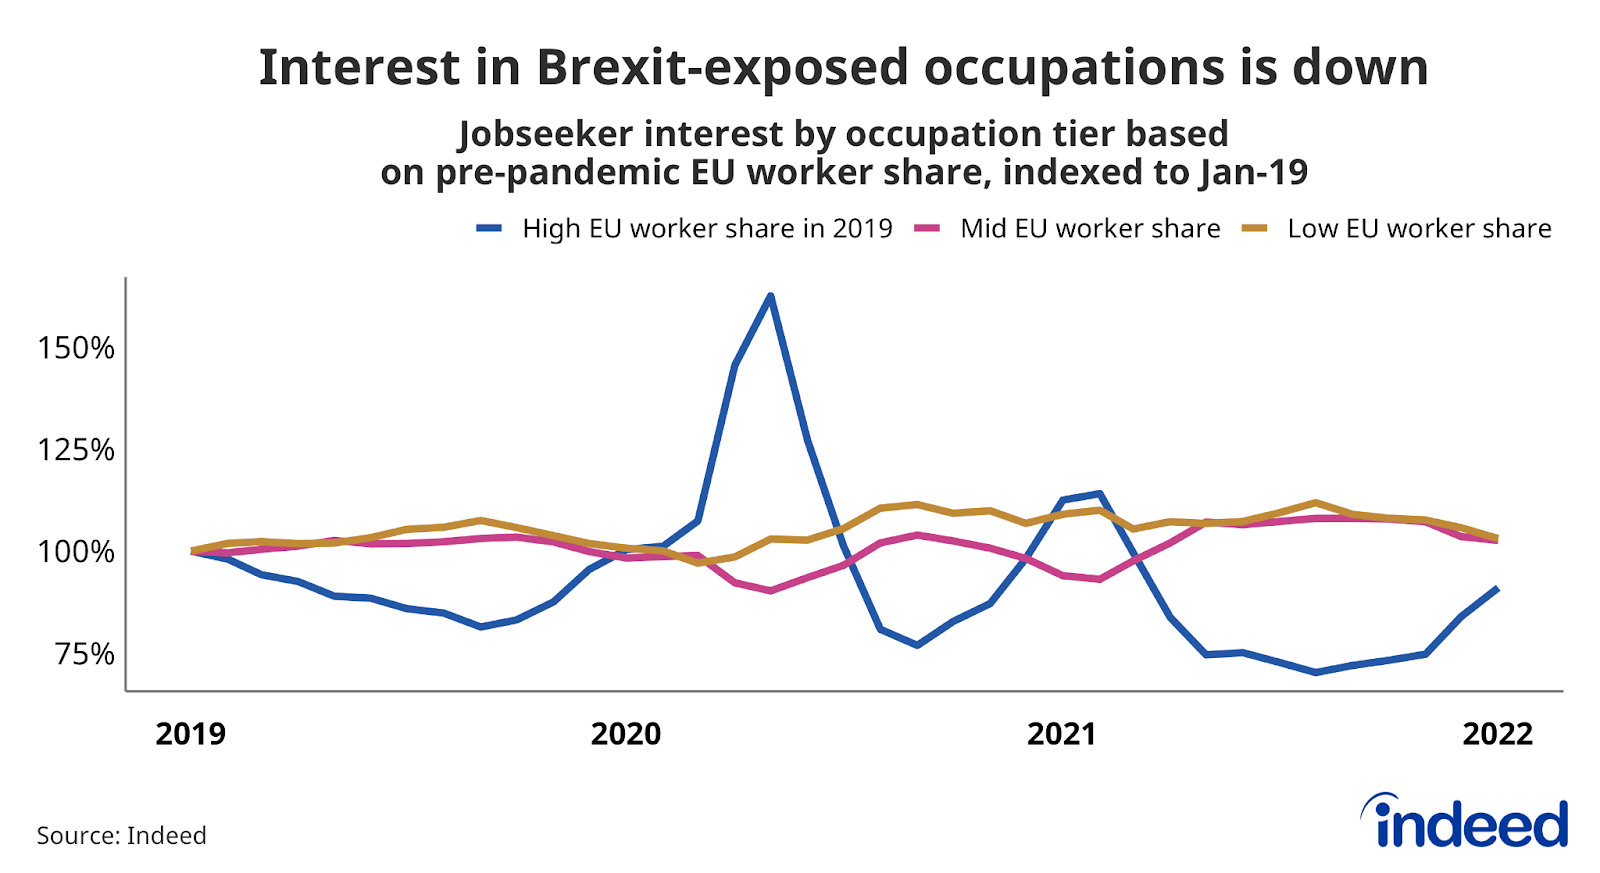
- The decline in jobseeker interest in EU-reliant occupations points to ongoing recruitment difficulties.
Occupations that relied most on workers from EU countries before the pandemic have seen much stronger recent growth in wages advertised in job postings on Indeed’s UK website than occupations that depended less on foreign employees. Most of the gap emerged after the economy’s reopening last spring, which saw job postings rebound to well above pre-pandemic levels. Labour supply has failed to keep pace, with post-Brexit immigration rules making it harder to plug gaps with foreign workers. That’s particularly the case at the lower-paid end of the labour market, which accounts for much of the recent growth in demand for workers.
Substantial numbers of EU nationals are believed to have left the UK during 2020. More recent ONS data indicate that the population of EU nationals in the UK decreased to 3.41 million in the year to June 2021, down from 3.59 million in the year to June 2020 and 3.73 million in the year before that. The number of non-EU nationals rose during that period, but not enough to offset the drop in EU workers. Meanwhile, interest in UK jobs from EU jobseekers has declined as the post-Brexit migration regime makes it harder to bring in new workers from the continent.
To compare hiring and wage trends, we placed job postings in three tiers based on pre-pandemic shares of EU workers. The low tier includes occupations with 0-5% EU workers, the mid tier those with 5-10% and the high tier those with more than 10%. The high tier comprises occupations like elementary production and assembly, construction, cleaning, driving, hospitality, leisure, storage and elementary services.
Most of the occupations in this tier are relatively low paid (see Methodology for a list of high tier occupations), with average salaries falling below the typical £25,600 threshold for a visa. Employers will therefore struggle to obtain permits for foreign workers unless they raise pay substantially or the government adds occupations to the shortage list.
Our analysis is based on job postings mapped to detailed Standard Occupational Categories (SOCs), which provides insight into trends by skill level. For example, in some sectors, like construction, lower-skilled occupations were more reliant on EU workers than mid-skilled occupations.
Wage growth fastest in occupations most reliant on EU workers
From January 2019 to December 2021, advertised wages rose most in occupations with the highest reliance on EU workers (high tier). The gap opened in 2020 and widened considerably starting in spring 2021 when the economy reopened after the third national lockdown.
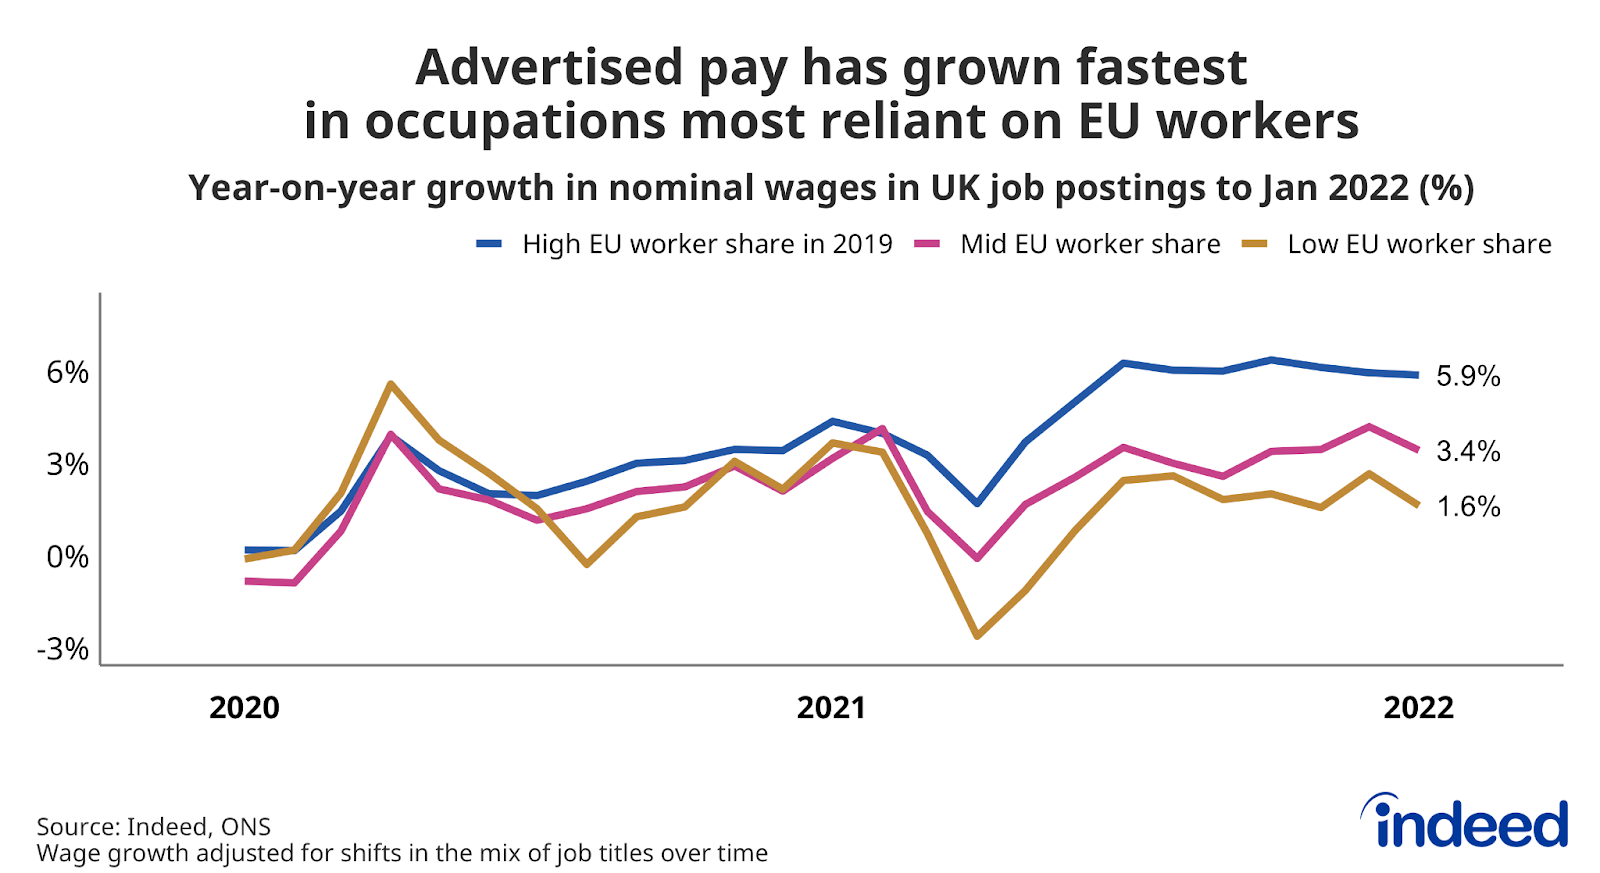
Annual rates of pay growth differ substantially according to tier. In January 2022, median advertised wages for high tier occupations rose 5.9% year-over-year, considerably higher than the 3.4% in the mid-tier and 1.6% in the low tier.
Stronger wage growth in the high tier doesn’t appear primarily to reflect minimum wage increases. Only one high tier occupation had a median hourly wage below the minimum threshold in 2021. The remainder all sat comfortably above the minimum even though most were relatively low-paid.
Job posting growth has been stronger in occupations that relied more on EU workers
Stronger wage growth in occupations exposed to Brexit reflects demand and supply trends. Recent job posting growth has been much stronger in the high tier than in the mid and low tiers. Sectors like distribution, manufacturing, construction and hospitality ramped up hiring dramatically after reopening, leading to fierce competition for workers in many occupations that had high pre-pandemic shares of EU workers. Job posting growth slowed toward year end in all three tiers in line with the usual seasonal pattern. But, as of January, posting growth in the high tier was still one-and-a-half times as strong as that in the low tier.
Jobseeker interest hasn’t kept pace in Brexit-exposed occupations
While demand for workers surged after last spring’s reopening, the supply of candidates hasn’t kept pace, leading to widespread labour shortages. That’s been a special problem for those sectors previously reliant on EU workers, where finding replacement foreign labour is now harder. Since the spring 2021 reopening, each high tier job posting has been receiving fewer clicks on average than it had previously relative to the average job posting on Indeed.
Conclusion
Pandemic-driven shifts in labour demand and supply, coupled with Brexit, have led to a crunch point in those occupations previously most reliant on EU workers. To the extent that the pandemic has suppressed international mobility, easing restrictions might help some sectors entice more foreign workers. But many positions in occupations most exposed to Brexit don’t meet UK work visa criteria, so hiring difficulties look set to persist.
That’s left employers with few options but to hike pay to lure candidates. But how long that can continue and whether it will be sufficient to draw enough workers to fill the gaps remains to be seen. If not, employers are likely to redouble efforts to persuade the government to enforce immigration rules more flexibly.
Methodology
To compare hiring trends, we split occupations into low (0-5%), mid (5-10%) and high (above 10%) tiers based on their share of EU workers in 2019, using data at the three-digit Standard Occupational Classification level from the Office for National Statistics (ONS). We then assigned UK job postings on Indeed to these tiers, having used an algorithm to map job postings to Standard Occupational Categories (SOCs).
Wage and salary data are extracted from job postings on Indeed’s UK site. When a range is mentioned, we use the midpoint. We excluded wages expressed as “up to” or “from” a certain amount since it was not possible to identify the full range in those cases. Pay growth for all job postings is adjusted for shifts in the composition of job titles and locations, consistent with our recent analysis. Moreover, advertised wages in job postings reflect demand for new workers rather than average pay across the existing workforce.
The relative jobseeker interest metric takes the average number of clicks per job posting for each occupation tier divided by national clicks per posting in the same time period. A positive change means the average job posting in an occupation tier is now more attractive to jobseekers relative to the average posting. A negative change indicates that the occupation tier has lost interest relative to the average posting.
All job posting growth figures in this blog post are the percentage change in job postings since 1 February, 2020, using a seven-day trailing average. 1 February, 2020, is our pre-pandemic baseline. For the seasonally adjusted figure at the beginning of the post, we adjusted the posting series based on historical patterns in 2017, 2018 and 2019.
Information on job posting trends and wages/salaries advertised in job postings is based on publicly available information on the Indeed website in the UK and any other countries named in the post, is limited to the UK and those countries, is not a projection of future events and includes both paid and unpaid job solicitations.
1The high tier comprises the following occupations (EU worker share in 2019 and median full-time gross pay* in annual and hourly terms in parentheses): 811 ‘Process Operatives’ (29%; £22,698; £10.83), 913 ‘Elementary Process Plant Occupations’ (29%; £21,469; £10.14), 624 ‘Cleaning and Housekeeping Managers and Supervisors’ (24%; £22,003; £10.72), 822 ‘Mobile Machine Drivers and Operatives’ (22%; £28,771; £12.50), 926 ‘Elementary Storage Occupations’ (21%; £23,061; £10.77), 923 ‘Elementary Cleaning Occupations’ (18%; £19,312; £9.62), 813 ‘Assemblers and Routine Operatives’ (18%; £23,506; £11.30), 543 ‘Food Preparation and Hospitality Trades’ (15%; £20,764; £10.00), 812 ‘Plant and Machine Operatives’ (14%; £25,004; £12.18), 211 ‘Natural and Social Science Professionals’ (14%; £38,437; £19.70), 215 ‘Research and Development Managers’ (13%; £48,623; £24.89), 821 ‘Road Transport Drivers’ (13%; £26,280; £11.74), 623 ‘Housekeeping and Related Services’ (12%; £21,952; £11.05), 312 ‘Draughtspersons and Related Architectural Technicians’ (12%; £30,131; £15.24), 122 ‘Managers and Proprietors in Hospitality and Leisure Services’ (11%; £26,410; £12.05), 541 ‘Textiles and Garments Trades’ (11%; £20,497; £10.16), 927 ‘Other Elementary Services Occupations’ (11%; £16,314; £8.91), 531 ‘Construction and Building Trades’ (10%; £28,000; £13.50), 912 ‘Elementary Construction Occupations’ (10%; £24,285; £11.14). *From ONS 2021 Annual Survey of Hours and Earnings.