This is an updated version of a post from 15th July with new data through 31st August 2020.
Key points:
- Competition for jobs varies widely across the UK and is higher in places with weaker economies, with eight times more local candidates per job posting in Middlesbrough than in Cambridge.
- Jobseekers tend to be less specific in their job searches in cities where jobs are scarcer, suggesting they cast a wider net in weaker labour markets.
- Competition for jobs has risen most in cities where jobs were already in short supply, raising concerns that geographic inequality could rise and posing a challenge to the Government’s levelling up agenda.
Covid-19 brought the British economy nearly to a halt, but job searches have carried on. As the pandemic took hold, unemployment claims rose rapidly and over 2.5 million CVs have been updated on Indeed since the start of the lockdown. At the same time, vacancies have plummeted as businesses struggle to cope, making it a lot tougher to find work. But jobseekers are not facing the same degree of competition everywhere in the UK.
Wide local differences
Job search and CV data through August shows wide local differences. Unlike the claimant count, which includes people filing for unemployment-related benefits regardless of whether they are looking for a job, activity on Indeed — the UK’s most-visited job site — captures actual job searches. Indeed data are representative of the regional distribution of people looking for jobs, according to the Office for National Statistics Labour Force Survey. Thus, comparing the number of jobseekers and job postings on Indeed measures the intensity of competition for jobs in local areas.
Such an analysis reveals the extent of disparities across the country. At the extremes, competition for each job in Middlesbrough is eight times greater than in Cambridge. Sunderland, Luton and Birkenhead also have large numbers of local jobseekers for each available job, while Oxford, Reading, Exeter, Bristol and London are among the places with the fewest local jobseekers per job posting.


Unsurprisingly, places where jobs are scarcer tend to have weaker economies. The 10 cities with the largest competition for jobs are on average 7% less productive and have 30% fewer people with high-level qualifications — a key indicator of success for a local economy — than the 10 cities with the least competition.
It doesn’t help that these most-competitive places for jobseekers were also the least likely to switch to home-working during the lockdown, suggesting these localities were less able to adapt to the challenges Covid-19 posed to the labour market. While approximately four in 10 workers in Cambridge, London and Reading could work from home during the lockdown, fewer than two in 10 in Middlesbrough, Barnsley or Doncaster were able to do so.
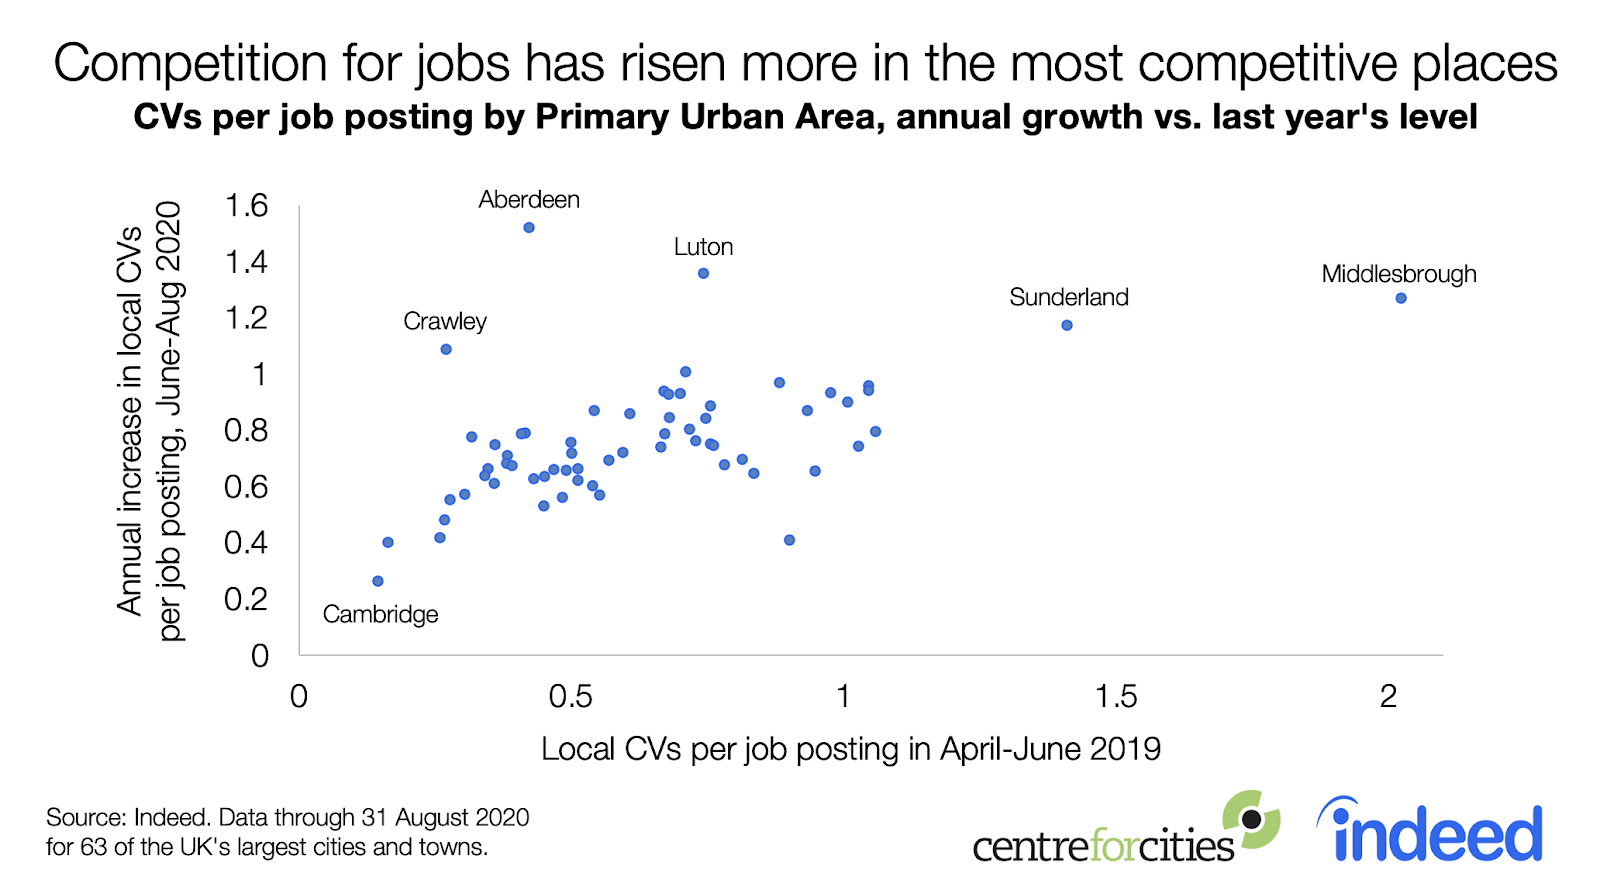
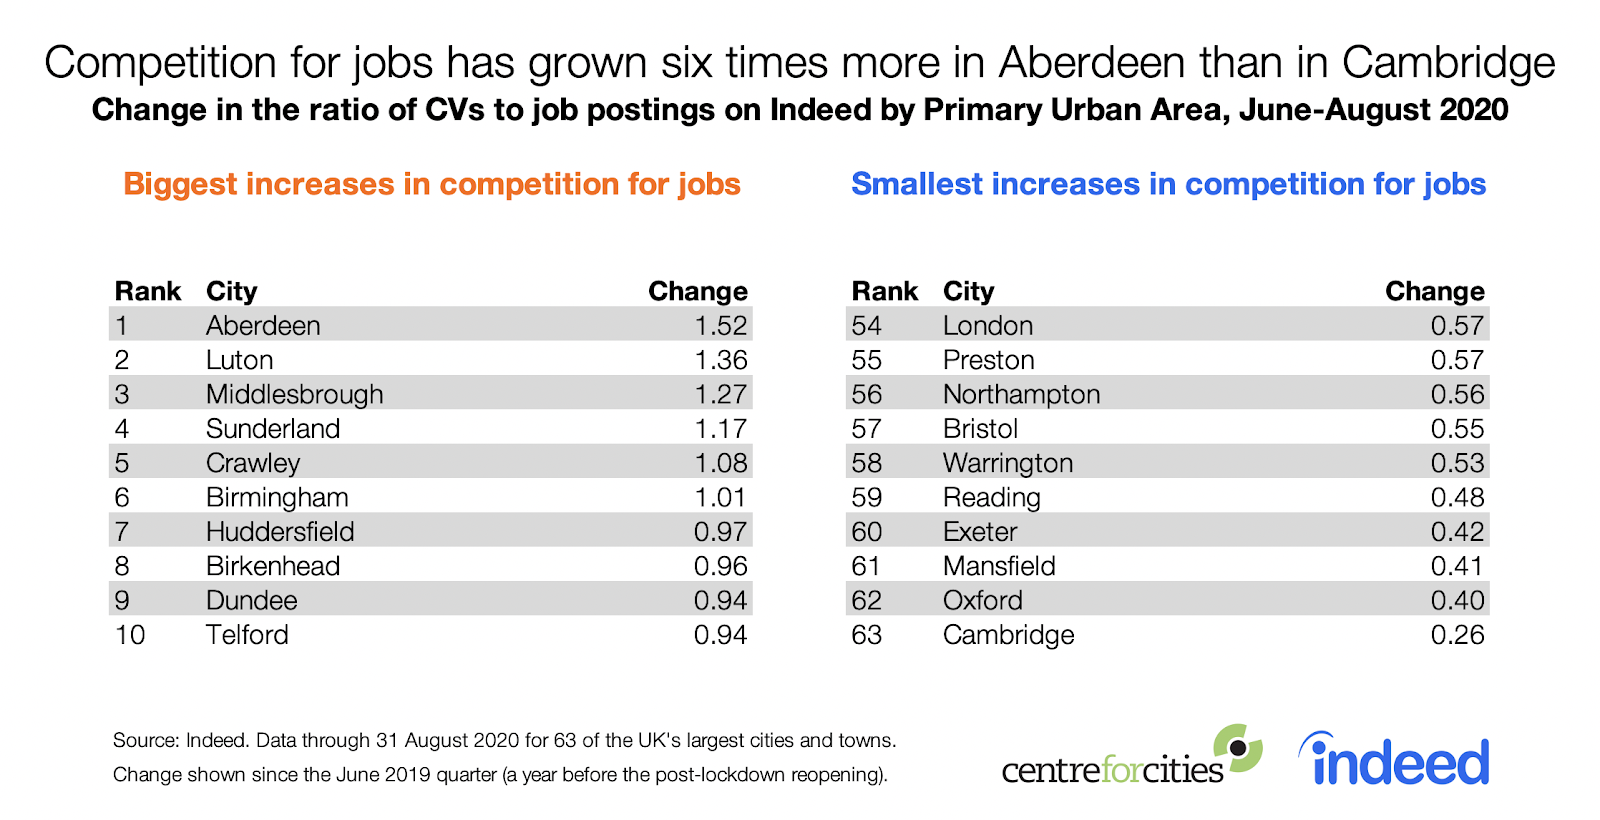
Competition for jobs has risen everywhere during the crisis, but more so in places where it was already hardest to find work. Compared with a year ago, the rise in the number of candidates per job posting is much greater in Aberdeen, Luton and Middlesbrough than in Cambridge or Oxford. The disparity threatens to widen already-substantial geographic inequality in access to jobs.
More blank queries
That’s not the only geographic difference. In cities where jobs are harder to come by, jobseekers tend to be less focused in their search. A popular way to search on Indeed is to specify a location in the ‘where?’ box and leave the ‘what?’ box blank, in what might be called the ‘I’ll take anything’ approach to finding work. Across the UK, the share of searches with blank ‘what?’ boxes rose 5 percentage points to 28% over the year to August 2020, with most of the increase happening in March. In the 25% of cities with the largest number of jobseekers per job posting, 34% of searches were blank in the three months to June compared with 28% in the 25% of cities with the least competition for jobs. At the extremes, only 19% of London searches were blank compared with 54% in Dundee.

Implications for jobseekers, employers and policymakers
These findings have three important implications for jobseekers, employers and policymakers. First, the labour market is getting more competitive for candidates. Opportunities in low-paid occupations — where entry requirements tend to be lower — have been hit particularly hard. That means having the right skills makes a bigger difference than ever in getting hired.
Second, employers are likely to receive lots of applications from people in other sectors, especially where the local labour market is weak. Finding the right candidate for a job requires adapting to this new environment, for example, by using technology to process high volumes of applications in ways that assess relevant transferable skills.
Third, geographic inequalities appear to be widening significantly, which means levelling up has a crucial role to play in the post Covid-19 economic recovery. Last week’s announcements by the Chancellor, including the launch of the Kickstart Scheme, are useful steps to counter rising unemployment, especially among young people. But our analysis suggests that, to create equal opportunities for everyone in the UK, jobs must be created everywhere in the country. That should be a central focus of government support packages for the labour market.
This post was published concurrently on the Centre for Cities blog.
Methodology
We calculated CVs per job posting in 63 of the UK’s largest cities and towns by dividing the number of CVs uploaded or updated on Indeed between 1st June and 31st August by the number of job postings available at some point during that period in each locality. The results measure the number of local candidates with an up-to-date job search profile on Indeed in relation to the number of available job opportunities.
We aggregated the results by Primary Urban Area – a measure of the built-up area of a city – based on the contact address on CVs and the location of the job. We used Primary Urban Areas in our analysis because they provide a consistent measure of economic activity in urban areas across the UK. A complete list is available here.
We measured productivity for the ten cities with the highest and lowest competition for jobs using GDP per worker in 2018. To measure workforce qualifications, we used the proportion of the working-age population with qualifications at level 4 (university degree) or higher in 2018.