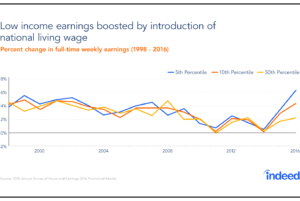
The UK’s lowest wage earners got some good news in 2016–their wages increased at the fastest rate in almost 20 years. For this bit of extra money in their pockets, they can thank the National Living Wage (NLW), introduced in April 2016, which delivered a sizable pay boost to those at the bottom of the wage ladder.
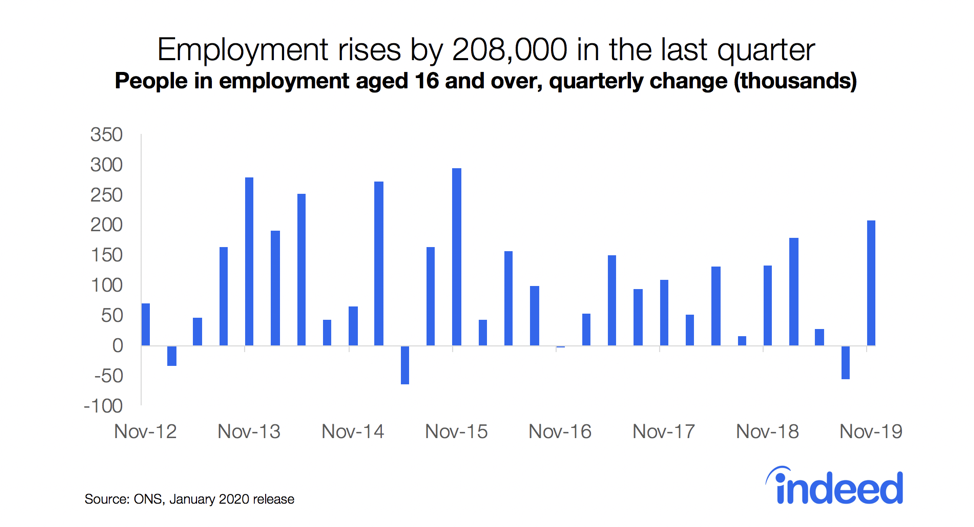
The NLW was not met with universal approval. Critics warned that rising labour costs would cause hiring to slow. But, in the first months after introduction of the policy, detrimental effects on business hiring did not materialise. Of course, it is too early to accurately quantify the NLW’s longer-term impact on labour demand and employment. The latest Office for National Statistics (ONS) job numbers show a record-high employment rate in the UK. At the same time though, regions in the North with below-average employment rates, including Scotland and Northern Ireland, posted relatively sluggish employment growth between 2016 and 2017, while the Southeast and Southwest extended their advantage. It remains to be seen whether part of this divergence may be a consequence of differential effects of the NLW on different regions.
We decided to look at the NLW’s initial impact on the wages of the lowest earners region by region to better understand where these workers enjoyed the biggest and smallest gains after adjusting for inflation. The picture that emerges is nuanced. Introduction of the new wage floor delivered larger pay rises to the lowest-paid workers in regions where wages were relatively low. But differences in the growth of living costs meant that workers in some locations saw more substantial real gains. In particular, low earners did worse in the Southeast, Scotland, and London, while they got a much better deal in the Midlands, the North, and Wales.
NLW has brought a welcome increase in nominal pay for the lowest earners in all regions
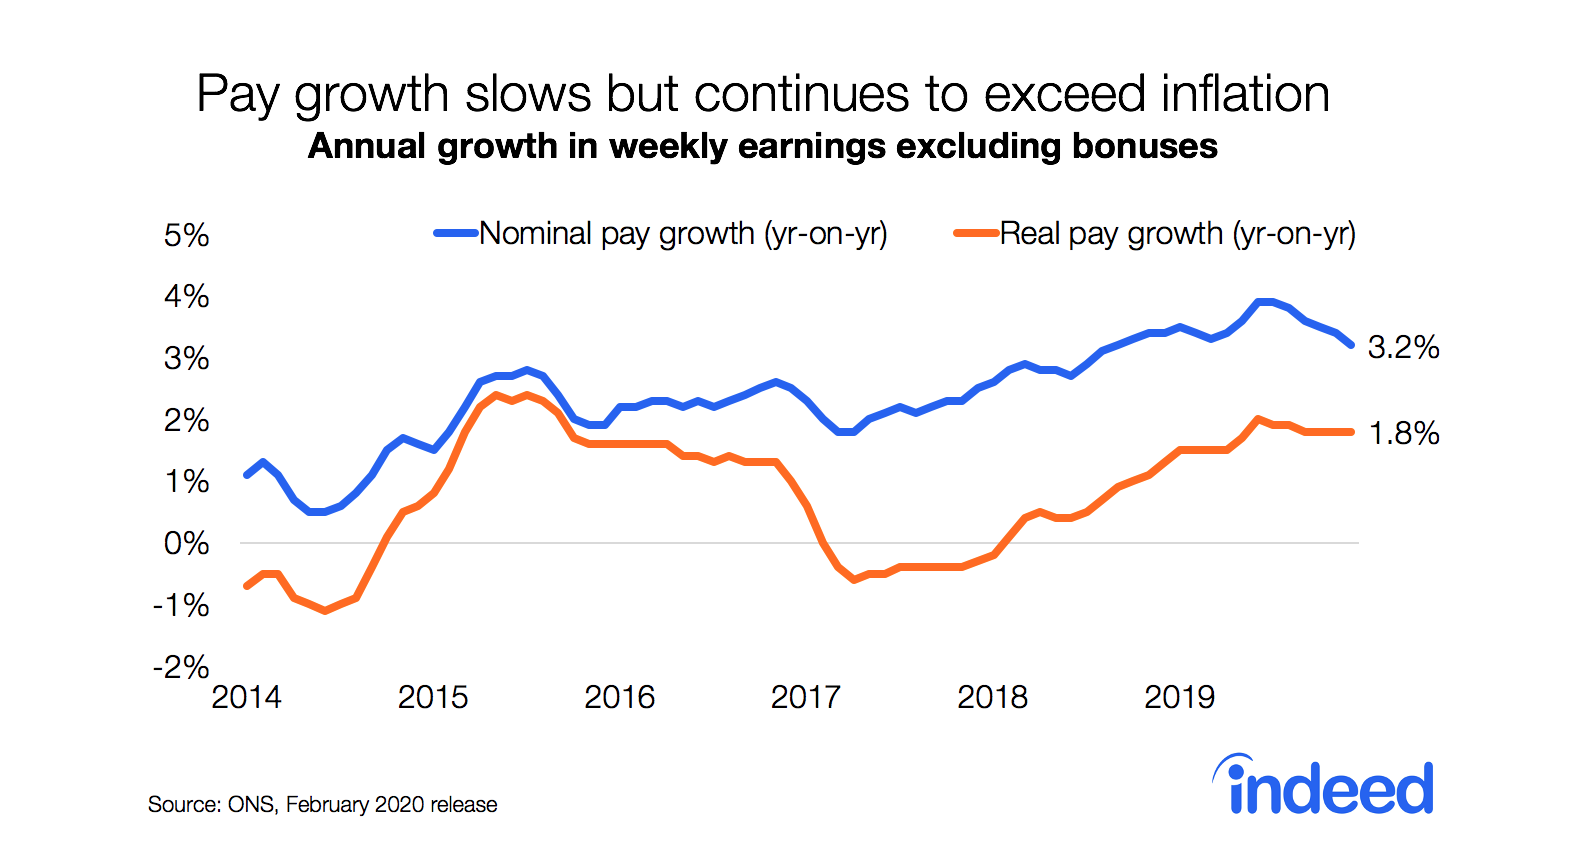
According to the Annual Survey of Hours and Earnings, between 2011 and 2016, wages at the 5th and 10th percentiles grew by 11.8% before adjusting for inflation, faster than for workers at the median and higher percentiles. (At the 5th percentile, 95% of workers earn higher wages; at the 10th percentile, 90% earn more.) These gains for the lowest earners reflected a marked pickup in wage growth in the past two years, particularly in 2016, when the NLW took effect.
Workers at the 10th percentile of the wage distribution saw earnings grow 2.5 times faster than those at the 90th percentile in 2016. Although wages of low-paid workers grew nominally throughout the UK, gains varied across regions.
The lowest earners in the East Midlands, the North, and Wales experienced the strongest nominal wage increases. By comparison, in London, wages of employees at the 10th percentile grew significantly more slowly following the NLW introduction. This is no mystery. Before the new minimum wage was introduced, London’s low-paid workers made roughly 11% more than the lowest earners in the UK overall. And they collected fully 14% more than comparable wage earners in the East Midlands – the region with the lowest wages. Moreover, in 2015, the 10th percentile of the wage distribution in London was 107% of the £7.20 NLW minimum rate, which kicked in April 2016. In other words, more of London’s low-paid workers were already earning above the NLW floor when the policy took effect.
By design, the NLW is a national minimum. As a result, it disproportionately affects regions where wages and living costs are lower. For example, take housing. The average price of a London house–and don’t even ask–is almost twice the national average. This disparity does not necessarily mean that the lowest earners are doing better in regions with the strongest nominal wage growth and cheaper living costs. To determine how much workers have actually gained, the rates at which wages and living costs have risen both matter. Inflation can cause some of those much-welcomed wage gains to melt away in real terms.
Differences in cost of living changes across regions
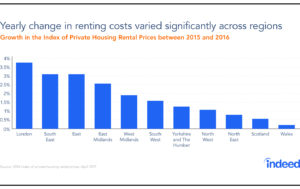
No official cost of living or inflation measures are available at the regional level. To estimate regional inflation, we looked at the growth rate of rents. For simplicity, we assumed that nonhousing costs rose at the same pace throughout the country. To calculate a region’s increase in real wages, we subtracted from nominal wage growth the rate of increase in local rental costs, which on average account for 27.5% of the average household’s spending, and the national nonhousing inflation rate. In the year ending April 2016 – the month the NLW was introduced – rents grew at very different rates in different regions. The North, Scotland, and Wales posted increases of 1% or less, while rents in the London area–where growth was fastest–jumped 3.7%.
Low earners in London saw the smallest gains in real pay
When local living costs are taken into account, we can determine real post-NLW wage gains for the lowest earners by region. London workers registered the smallest gains. Between 2015 and 2016, the city’s lowest earners saw wages grow by 3.9% in inflation-adjusted terms–half the rate posted in the fastest-growing regions. Real wage gains for London’s lowest paid workers reflected the fact that nonhousing inflation at 0.3% was virtually zero over the same period. The Southeast did a little better. Low-earners there enjoyed 5.2% real pay increases.
The regions where the NLW benefited lowest earners most were the East Midlands, Wales, and the Northeast. Even after taking rent increases into account, the pay of workers at the 10th percentile of wages rose between 7% and 7.4%. Interestingly, East Midlands’ lowest earners enjoyed the highest real pay increases despite the fact that rents rose at the highest pace after the increases in the Southeast, London, and the East.
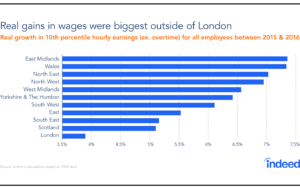
The lowest earners in the Northwest, West Midlands, Yorkshire, and the Southwest all posted 6% or 7% real pay growth over the year, less than their counterparts in Wales and the Northeast because of higher rent growth and a slightly weaker rise in nominal wages.
The NLW has delivered real wage gains in all regions, but surging inflation poses risks
The data show the NLW has boosted nominal wages throughout the UK since its introduction in April 2016. When changes in living costs are considered, a more nuanced picture emerges. Low-paid workers in England’s Southeast–and London in particular–saw the smallest real gains even though nonhousing inflation was close zero over the period. However, inflation is once again rising at a steady clip and is expected to climb even faster in the months to come. That is likely to cause the real wage gains registered after the introduction of the NLW to start to evaporate. If that occurs, the lowest-paid workers in London and surrounding regions will feel the pinch first.
Notes
¹ Northern Ireland is excluded from the analysis.
² Index of private housing rental prices
³We use the change in the 12 months ending in April 2016 of CPI special aggregate “All items excluding housing, water, electricity, gas & other fuels” as published by the ONS.