Immigration from other member countries of the European Union (EU) was one of the most contentious issues in the Brexit campaign last year. Despite the controversy surrounding the topic, little attention was given to the contribution brought in recent decades by EU27¹ citizens who have come to the UK to work.
However with the triggering of Article 50 imminent, the potential consequences of an exodus — or even reduction in their numbers — will soon move from the realm of the hypothetical and become concrete reality. In the absence of a crystal ball, quantifying the size of EU workers’ contribution in terms of employment and detecting which industries are most reliant on them today can help us get a better sense of what the British labour market might look like post-Brexit.
To do this, we looked at official employment data from the Labour Force and Annual Population Survey.² Just how big a contribution do EU27 workers make to overall employment in the UK? And which specific economic sectors are most at risk from a drop in their numbers?
Key Findings:
- 44.3% of new jobs created in the UK since 2008 were filled by workers from elsewhere in the EU.
- 26% of all EU nationals employed in the UK today work in Manufacturing and Accommodation and Food Services – making these the two sectors most reliant on EU27 labour.
- In addition, EU27 workers are often more likely than UK and non-EU workers to work in industries that report an above average incidence of skill shortages — while only 20% work in “high skill” occupations.
Let’s take a look at the data.
The Number of EU-born Workers in the UK Has Almost Tripled Since 1997
Around 7% of all people employed in the UK today were born in one of the other 27 EU countries³, up from a share of 2.4% twenty years ago. However even though EU27 workers make up a relatively small part of the entire labour force, when we look at jobs created over the last two decades, we can clearly see the extent to which they have played an increasingly significant role.
According to the latest employment numbers from the Office for National Statistics (ONS), 5.7 million more people are employed in the UK — of whom 1.7 million were born in another EU country — compared to 20 years ago.
This means that roughly one out of every three new jobs created since 1997 in the UK labour market was filled by a EU27-born worker. Over the same period UK-born workers made up 36% of all employment growth, while the contribution from workers born in a country outside the EU stood at an almost-equal 34%.
44.3% of All Jobs Created Since the Recession Were Filled by EU Workers
If we take a closer look at employment growth since the recession hit the British economy in 2008, it becomes clear that the contribution of EU27-born workers has been even more remarkable over this period.

Of the 2.3 million new jobs created since January 2008, about 1 million (or 44.3%) were filled by workers born in one of the other 27 EU member states. Compared to the decade before the recession, the contribution of EU27-born workers to employment creation more than doubled over this period.
Meanwhile, even as the contribution of EU27-born workers to job creation surged, the employment rate of all groups (including UK-born) reached record high levels.
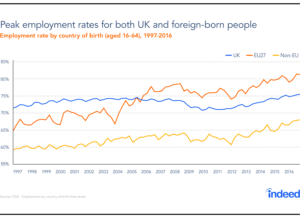
In fact, at the end of a decade that saw EU27 immigration hit an all-time peak, both UK and foreign-born people of working age are more likely to be in employment than at any other time since 19974.
And so, regardless of whether one thinks that more or less immigration would be desirable for the UK today, it is indisputable that the contribution of foreign-born workers to employment growth in recent years has been very significant indeed.
Accommodation, Manufacturing and Admin Support Are Most Reliant on EU Workers
Having established how much EU27 and other non-EU workers contributed to the UK’s recent strong record of employment growth, we wanted to better understand which industries today are most reliant on them.
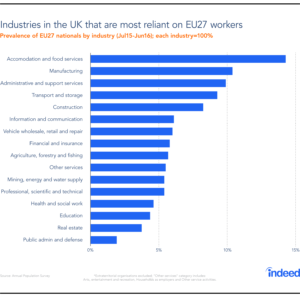
With the exception of Public Admin & Defence, 3% or more of the people working in every single industry in the UK are nationals of the other 27 EU member states. They also outnumber non-EU workers in most of these broad sectors.
Five industries — namely Accommodation & food services, Manufacturing, Administrative & support services, Transport & storage, Construction — are most reliant on workers coming from the rest of the EU: EU27 nationals make up between 8.2% and 14.2% of these industries’ workforces.
Only 20% of EU Workers Are Employed in “High Skill” Occupations
Industries that rely on EU27 workers the most tend to offer wages that are either average or towards the low end of the national distribution.
At £8.40, the median gross hourly wage for full-time employees working in Accommodation and food services, which includes the Hospitality sector, was the lowest of all industries in 2016, for example, while people working in Manufacturing made a median gross hourly wage of £13.505, just below the overall median for all full-time employees.
This also reflects the fact that EU27 workers tend to be somewhat less educated, as only 20% of them are employed in occupations defined as “high skill”, compared to 28% of British and 32% of non-EU nationals6.
How Do EU27 Workers Compare to Natives and Other Foreign-born Workers?
But how do EU27 workers compare to those from the UK, or non-EU countries? Do they have a higher or lower or equal propensity to work in specific industries such as (for instance) Manufacturing as their peers from outside the bloc?
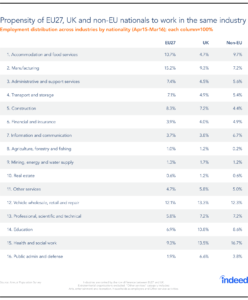
The same five industries (Accommodation & food services, Manufacturing, Administrative & support services, Transport & storage, Construction) that have the highest share of EU27 nationals are also the ones in which EU27 nationals are most likely to be employed in comparison to UK natives.
The biggest differences between EU27 and native workers can be seen in Manufacturing and Accommodation and food services, as EU27 nationals are much more likely to be employed in these two sectors in comparison to natives.
In fact, while 26% of all employed EU27 nationals work in either Manufacturing or Accommodation and Food Services only 14% of British nationals do so.
EU27 Nationals Are More Likely to Work in Industries Reporting Skill Shortages
Of course, it could be argued that these are probably the types of job that most migrants do anyway, regardless of where they come from. However, this argument also implies that if immigration from the EU were to significantly decrease, other migrants could easily step in and fill the gap. For this reason, it is interesting to compare EU nationals with workers from other non-EU countries and see how they fare.
When compared to other non-EU nationals, EU27 nationals are still more likely to be employed in the same five sectors. Construction and Manufacturing show the biggest differences this time: Non-EU nationals are less likely than EU workers and even less likely than UK nationals to work in these industries. Accommodation and Food Services stands out as the only broad sector that employs similarly large shares of both EU and non-EU workers in comparison to UK nationals.
It is worth pointing out that three out of the five industries in which EU27 workers are both more likely to work in and make up a bigger share of the overall workforce (Manufacturing, Transport and Storage, Construction) are also industries that report an incidence of hard to fill vacancies due to skill shortages of between 30% and 35%. This is much higher than the average of 23% for all industries, and among the highest overall7.
This is also reflected in the fact that EU27 workers are more likely to be employed in the Skilled Trades occupations than natives and other migrants. This is the broad occupation with the highest density of skill-shortage vacancies — 43%.
Towards a Different British Labour Market?
Controversies surrounding Brexit and the immigration debate aside, it cannot be denied that the contribution of EU27 workers to the strong performance of the UK labour market in recent years has been remarkable.
Today EU27 workers make up a significant share of employment in a number of industries. They tend to work in sectors such as Manufacturing, Transport and Storage and Administrative Services, as well as occupations like Skilled Trades, more than natives or non-EU nationals do. Employers in most of these industries and occupations are also the ones who most often report difficulties in hiring due to skill shortages.
With the reduction of EU immigration a top priority of the imminent Brexit negotiations, the impact that a substantial fallout in the number of EU27 nationals working in the UK will have on the labour market will probably be serious.
It is also likely that specific industries may be more affected than others and may find it harder to hire as the pool of candidates they have access to gets smaller and less international. For better or worse, a British labour market with a significantly smaller presence of EU27 workers will be immediately confronted with a range of complex questions that will need to be resolved quickly to prevent major disruption.
The stakes are high: Now we are about to start learning the outcome.
- The following countries are included in ‘EU27’ – Austria, Belgium, Bulgaria, Croatia, Cyprus, Czech Republic, Denmark, Estonia, Finland, France, Germany, Greece, Hungary, Republic of Ireland, Italy, Latvia, Lithuania, Luxembourg, Malta, Netherlands, Poland, Portugal, Romania, Slovakia, Slovenia, Spain and Sweden.
- All the data used in this blog is publicly accessible on the ONS website (here and here).
- ONS Labour Market Statistics release – Employment by country of birth time series (not seasonally adjusted); February 2017.
- The ‘Employment by country of birth” time series starts in 1997. The employment rate (the proportion of people aged from 16 to 64 who were in work in the UK) was 74.6% in the last quarter of 2016, the highest since comparable records began in 1971.
- Annual Survey of Hours and Earnings: 2016 provisional results
- Annual Population Survey; Data refers to October 2015 to September 2016. 2. Skill level has been categorised using the Standard Occupational Classification (SOC), for more information see ONS.
- Source: UK Skill Survey 2015