キーポイント
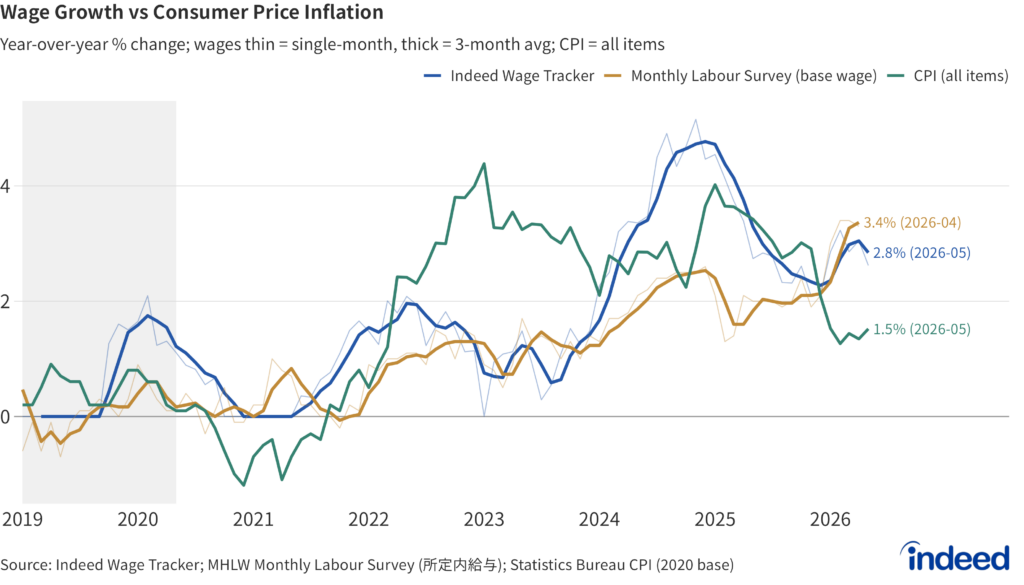
- 求人賃金・所定内給与とも3%台が続く一方、消費者物価上昇率は2%を下回り、実質賃金はプラスに転じつつある。
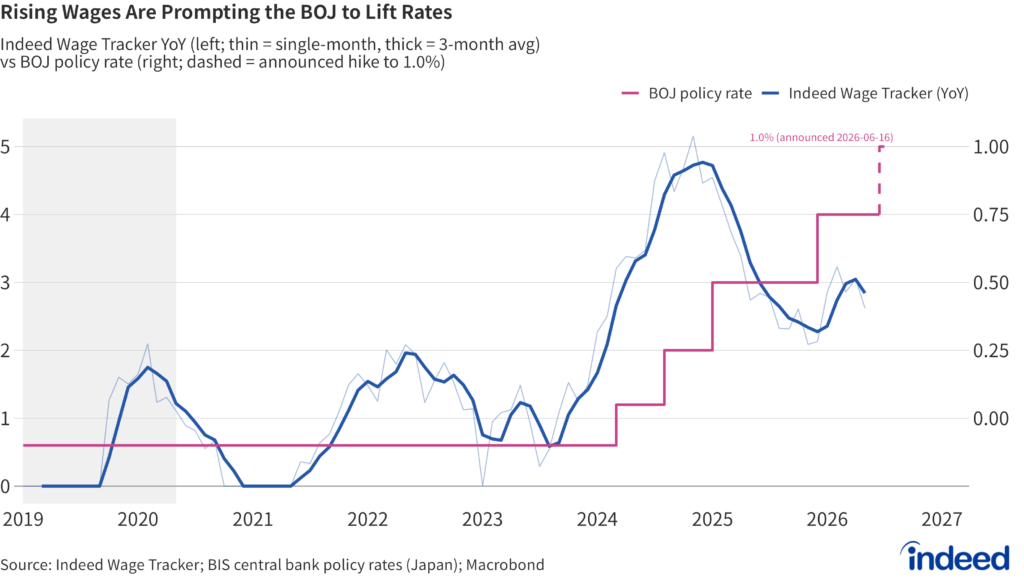
- 日本銀行は賃金等の底堅さを踏まえつつ政策金利を1.0%(1995年以来の高水準)へ引き上げた。もっとも、消費者物価上昇率の2%割れは政府のエネルギー対策によるところが大きく、原油高の価格転嫁が上振れリスクとなり、実質賃金のプラスはなお脆い。
日本労働市場チャートブック全文もあわせてご覧ください。You can find the English-language version of the chartbook overview here.
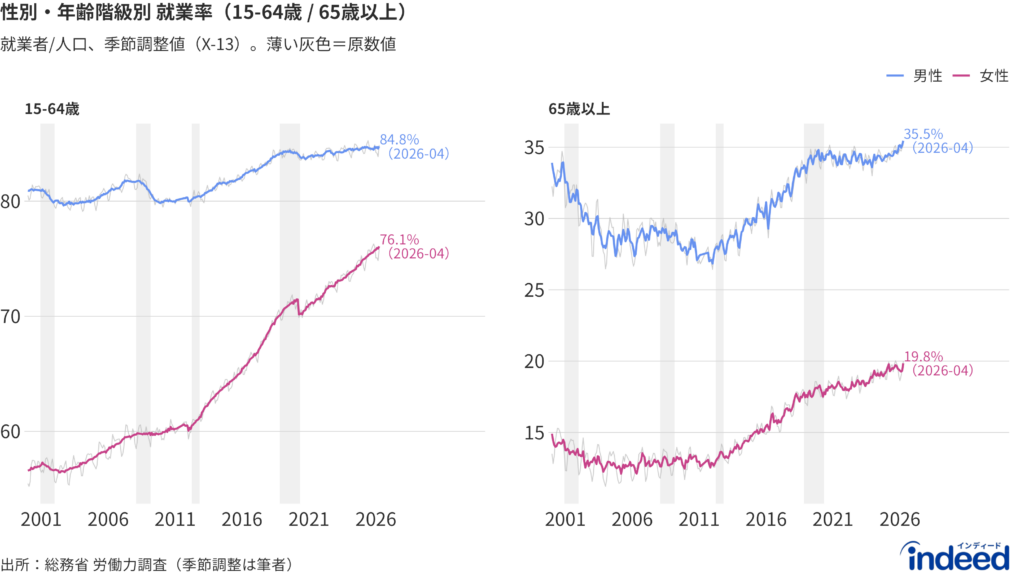
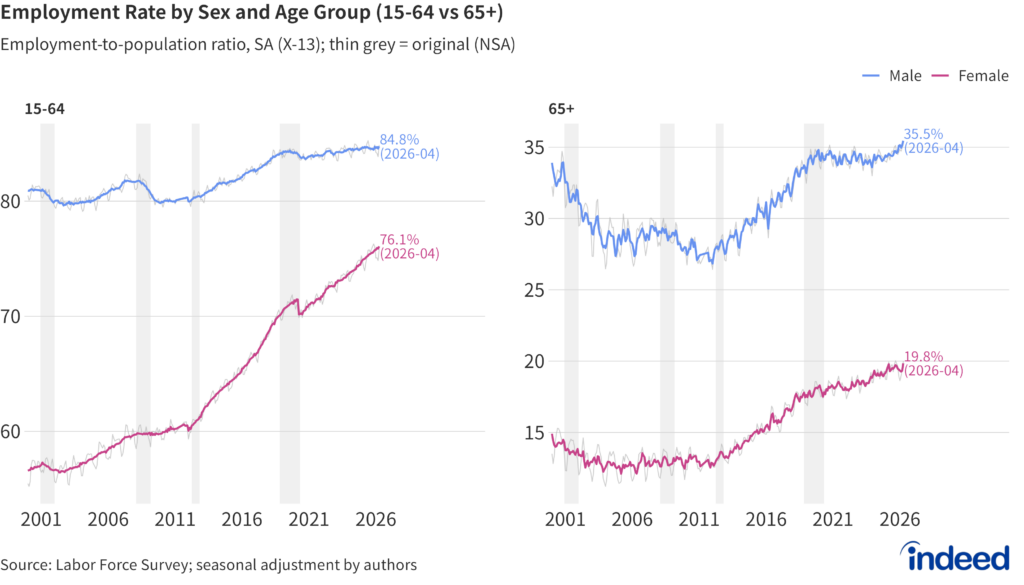
人口減少のなかでも、高齢者・女性・外国人の労働参加によって、労働供給は増え続けています。2026年初にかけては、失業から就業へ移る入職確率が低下するなど、一部に足踏みの兆しもみられました。しかし、その後も就業者数は2026年4月にかけて増加傾向にあり、人手不足は根強く、労働市場の逼迫は全体としては続いているとみるのが妥当です。
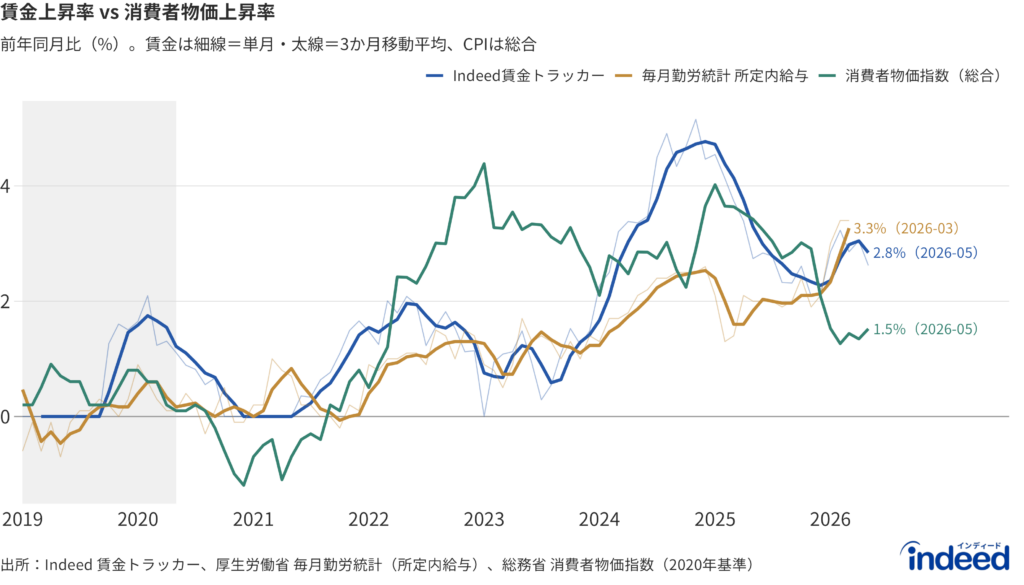
賃金面では、Indeed 賃金トラッカーと毎月勤労統計の所定内給与がそろって3%前後の伸びを維持しています。一方で消費者物価上昇率は2026年5月1.5%(総合)と、2026年に入って鈍化し、日本銀行の2%目標を下回りました。インフレが賃上げを追い越し実質購買力が目減りしている欧州とは対照的に、日本の労働者は実質賃金のプラスを取り戻しつつあります。
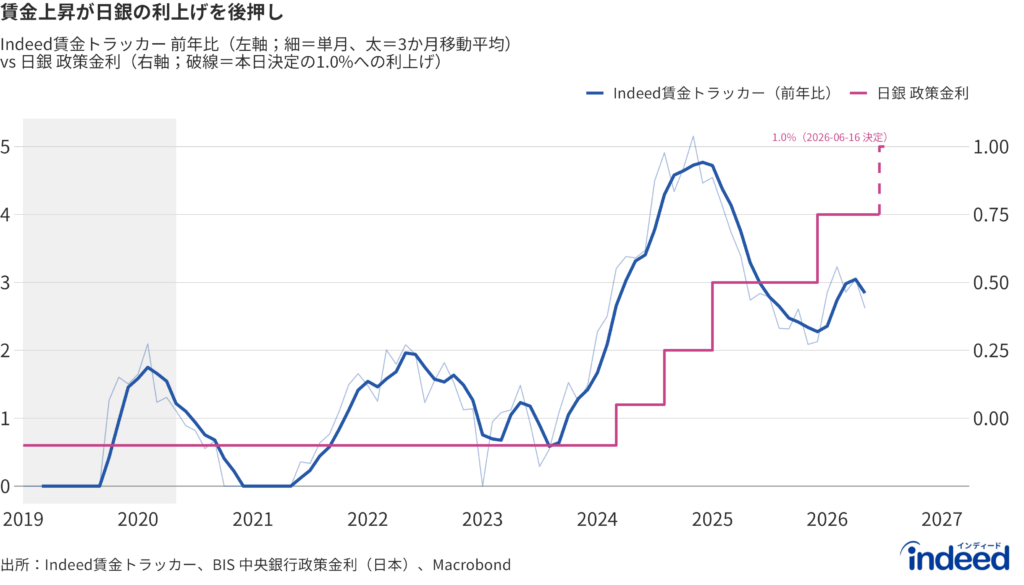
こうした賃金の底堅さは、日本銀行を金融政策の正常化へと動かしています。日本銀行は2026年6月16日、政策金利を0.75%から1.0%へ引き上げる決定をし、1995年以来の高水準としました。求人賃金の伸びと政策金利の歩調は、近年ますます連動しています。
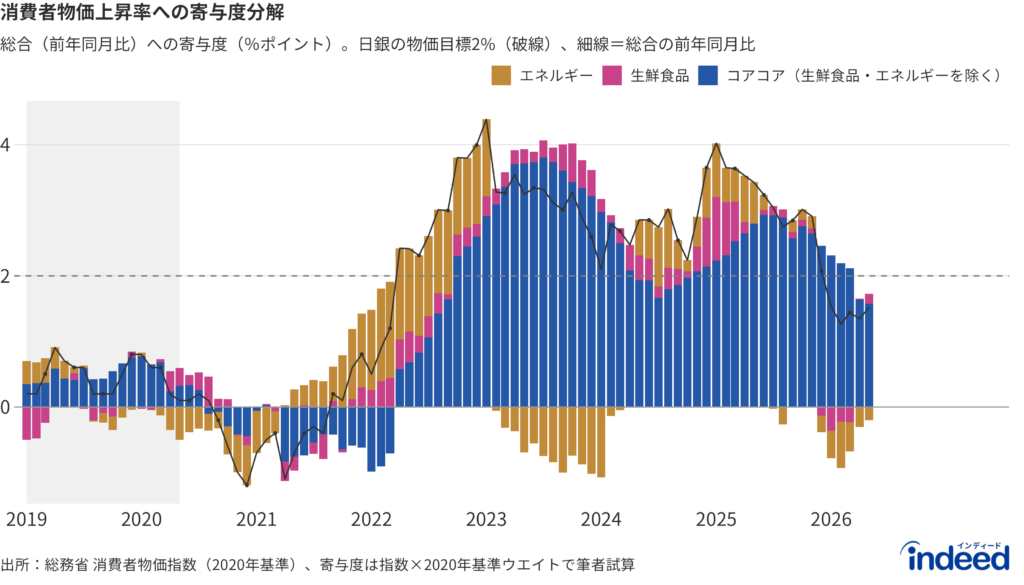
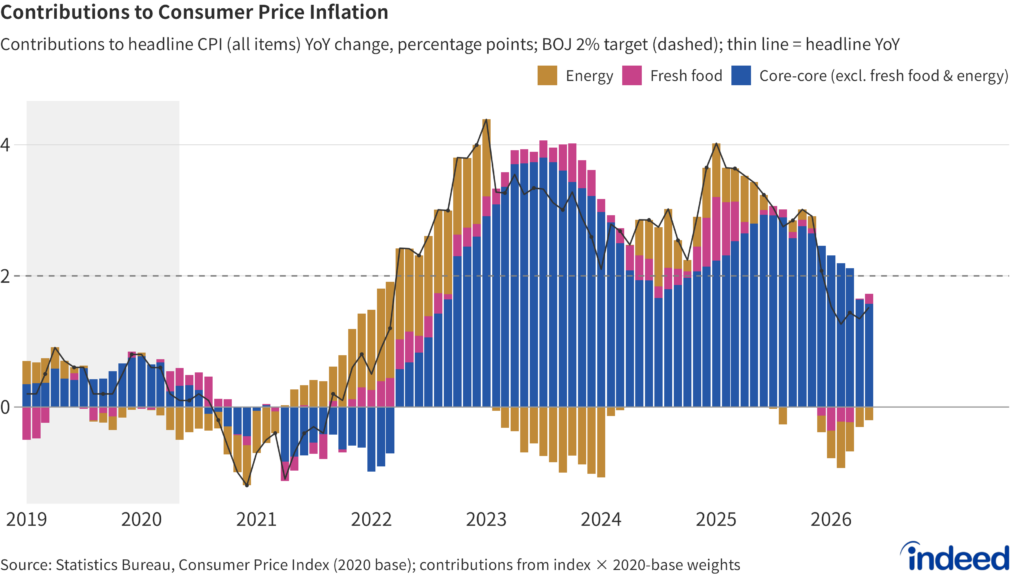
ただし、この実質賃金のプラス転換も盤石ではありません。足元の物価鈍化は、エネルギーと食料という基調外の要因に支えられた面が大きいためです。生鮮食品・エネルギーを除くコアコアCPIは5月で1.8%と、2%目標をわずかに下回るものの、なお粘着的で、ヘッドラインに対する最大のプラス寄与となっています。CPIが2%を下回っている原因は政府のエネルギー高対策によるものが大きいと考えられます。日本銀行も同様の整理を示しています。その一方で、輸入依存度の高い日本にとって原油価格の再高騰(ブレントで1バレル106ドル)は物価の上振れ要因であり、原油高の価格転嫁が企業間取引で速く進み、幅広い品目で消費者物価に波及する可能性があります。名目賃金が頭打ちとなるなかで物価が再加速すれば、いま欧州が直面している実質購買力の目減りが、日本でも時間差で訪れかねません。
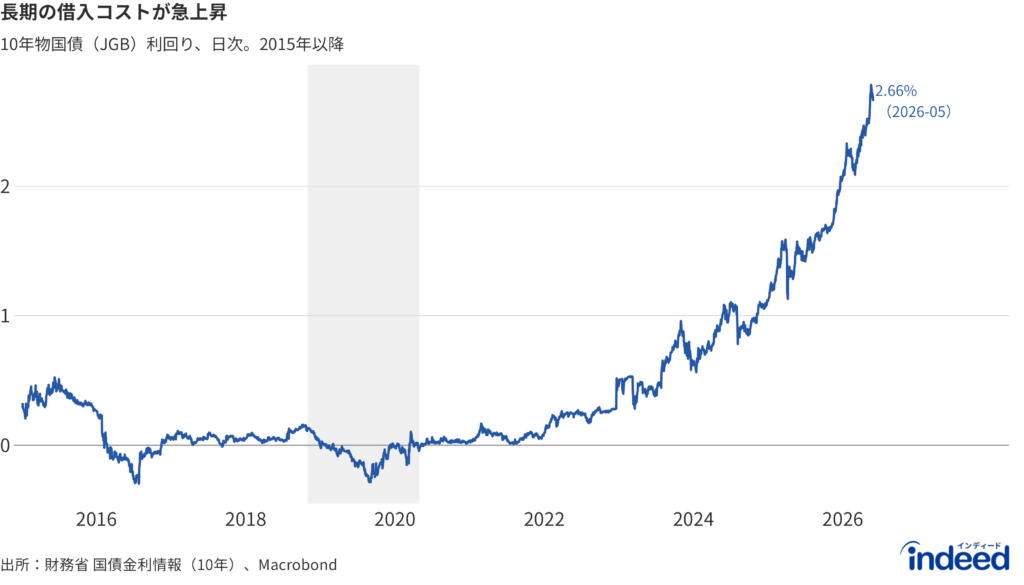
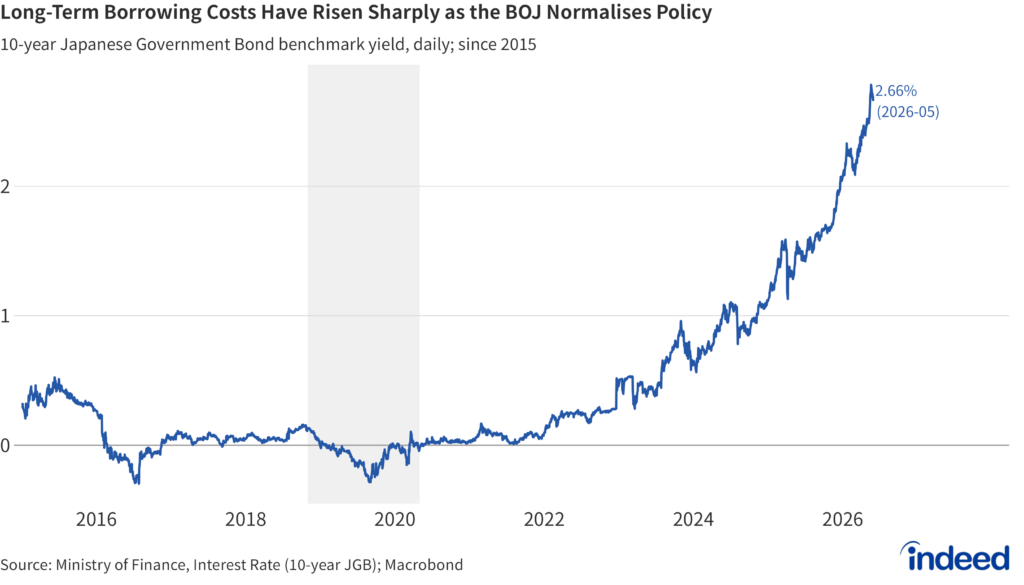
また景気ウォッチャー調査は50を下回り、政策不確実性も歴史的平均を上回るところをみると、需要見通しの慎重さもうかがえます。さらに10年国債利回りも2.5%を超える水準まで上昇しており、利上げと相まって資本コストの上昇は、歴史的に強いペースで伸びてきたソフトウェア投資や、採用計画には向かい風となります。
今回の利上げは、ここから注視すべき点をより明確にします。第一に物価です。利上げによって、依然として最大の上振れ要因である輸入物価の圧力をどこまで抑えられるかが注目されます。円高を通じた抑制が狙いの一つですが、実際に円高が進むかどうかは見通せません。第二に、名目賃金です。昨年までのピークからは鈍化したものの、利上げのもとでも大きく鈍化する兆しは今のところ見られず、名目賃金の伸びはある程度維持されそうです。第三に、目先のエネルギー価格です。中東情勢を受けて原油・ガス価格が上昇するなか、政府は7〜9月の電気・ガス料金支援を昨夏を上回る規模で実施することを決めており、当面はヘッドラインの物価上昇が抑えられる見込みです。ただしこの支援は9月使用分までの一時的なもので、上流の価格でなお強まりつつあると日銀が指摘する物価上昇圧力を覆い隠しているにすぎません。より大きな試練は、この支えが外れ、抑え込まれてきたエネルギー価格が再び表面化するときに訪れます。こうした局面で家計の消費がどう動くかは重要です。労働市場では、その先行指標となる賃金・採用の動きについて、Indeed のデータが一つの手がかりとなるでしょう。
補論:賃上げは「十分」か
賃上げが進んだことは確かですが、「十分」かどうかは何を基準にするかで変わります。賃金の伸び率だけを見れば、数年前のゼロ近傍から3%前後へと明確に改善しました。
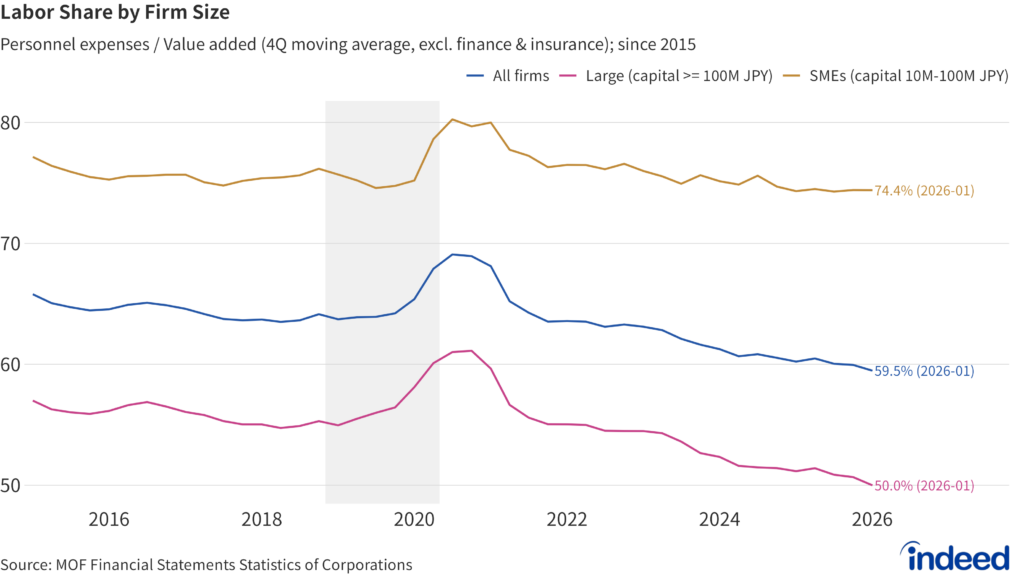
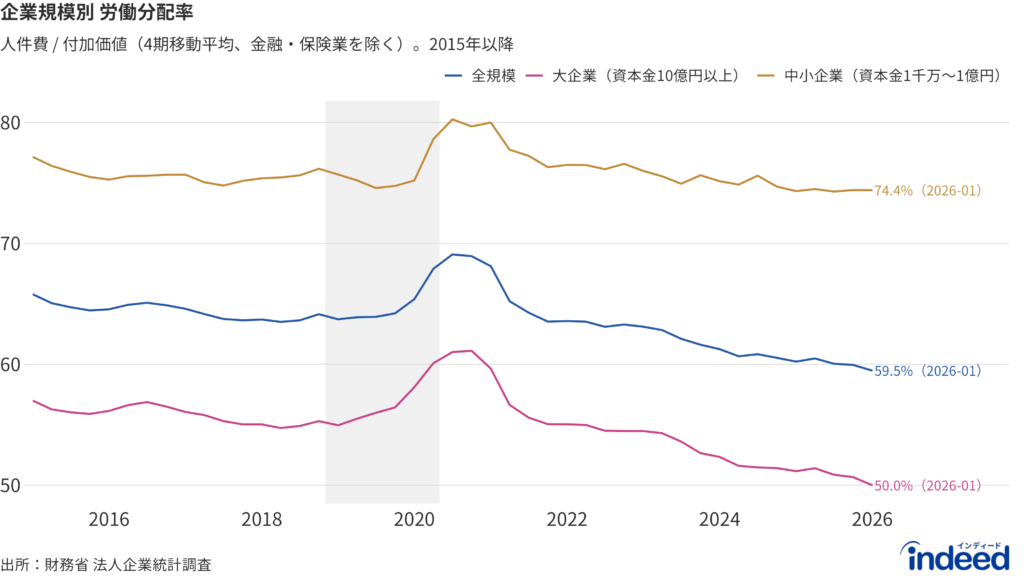
労働分配率(付加価値のうち人件費に向かう割合)は長期的に低下傾向にあり、企業規模が大きいほど低く、大企業では5割程度にとどまります。もっとも、労働分配率の低下は日本に限らず多くの先進国に共通する現象で、分配率の水準そのものは資本装備率の上昇、産業構成や測定要因にも左右され、解釈に幅があるのも事実です。それでも、生産性が高まるなか、労働分配率が低下してきていることは、成長の果実が労働者に回るにはまだ課題があることには変わりはないでしょう。
EN
June 2026 Japan Labor Market Chartbook
Key points:
- Posted wages and base (scheduled) wages are both still growing around 3%, while consumer price inflation has slipped at 1.5%. Real wages are turning positive, in contrast to Europe, where inflation is eroding pay.
- The Bank of Japan raised its policy rate to 1.0% — the highest since 1995 — as wage growth proved resilient, but it sees the sub-2% CPI as propped up by government energy measures and flags rising oil pass-through as an upside risk, leaving the real-wage gain fragile.
See our full Japan Labor Market Chartbook for a more comprehensive view of the Japanese labour market.
Japan’s population continues to shrink, yet its labour supply keeps expanding, lifted by older workers, women and a growing foreign workforce. The job-finding rate eased into early 2026, hinting at some cooling, but employment has kept climbing through April. On balance, labour shortages remain acute and the market stays tight.
Pay growth is holding up: both the Indeed Wage Tracker and base (scheduled) wages in the Monthly Labour Survey are running at around 3%. Inflation, by contrast, has cooled with headline inflation at 1.5% headline, sitting below the Bank of Japan’s 2% target. The upshot is a return to positive real wage growth, the mirror image of Europe, where inflation has overtaken pay and real purchasing power is slipping.
That wage resilience is nudging the Bank of Japan toward normalisation. On 16 June 2026, it raised the policy rate to 1.0% from 0.75%, the highest level since 1995. Posted-wage growth and the policy rate have increasingly moved in step in recent years.
The turn in real wages is far from secure. Much of the recent disinflation comes from outside the underlying trend, in energy and food. Core-core CPI, which excludes fresh food and energy, ran at 1.8% in May: just below target, still sticky, and the largest single contributor to the headline rate. The BOJ itself attributes the sub-2% reading to government measures that cushion households from higher energy costs. For an economy as import-dependent as Japan’s, a fresh climb in oil prices — Brent crude near USD 106 a barrel — is a clear upside risk: the pass-through from crude is already moving fast through business-to-business transactions and could broaden to consumer prices. Should inflation reaccelerate while nominal wages plateau, the real-income erosion now underway in Europe could reach Japan with a lag.
Demand signals are softening in parallel: the Economy Watchers Survey has dropped below 50, and policy uncertainty remains above its long-run average. The 10-year JGB yield has pushed above 2.5%, and alongside the rate hike, a higher cost of capital is a headwind to hiring plans and to software investment, which has been expanding at a historically strong pace.
The rate move sharpens what to watch from here. The first is inflation: how far the hike actually curbs imported price pressure, still the main upside risk. A firmer yen is one channel it is meant to work through — though whether the currency strengthens is far from assured. The second is more reassuring: wage growth, though off its recent peak, shows no sign yet of slowing sharply even as the BOJ tightens — a sign that nominal wage growth can be sustained, at least to a degree. For now, the government has expanded its energy subsidies for July–September, larger than last summer’s, to offset the Middle East-driven jump in oil and gas prices and keep headline inflation contained. But that support is temporary, set to run only through September, and papers over pressure the BOJ says is still building in upstream prices; the sterner test comes when it is unwound and suppressed energy costs resurface, squeezing real incomes. How households spend through that test will matter most of all. On the labour market side, Indeed’s real-time data should offer an early read on the wage and hiring signals that tend to run ahead of it.
Appendix: Is pay rising enough?
Wage growth has clearly picked up. But is pay rising enough? It depends on the measure. By growth rate, the improvement is unmistakable, from near zero a few years ago to around 3%. By labour share, the picture is less reassuring: the portion of value added flowing to workers keeps falling, and has reached 50% at large firms. That the share has slipped even as productivity has risen suggests the gains from a growing economy are not yet reaching workers in full.