
Key points:
- The labour market began 2026 on a soft note, as employment slipped from December levels according to both the Labour Force Survey (LFS) and the Survey of Employment Payrolls and Hours (SEPH). Overall, employment was relatively flat from a year earlier, as gains in health care offset losses in manufacturing and retail.
- With the working-age (15-64) population in slight decline, flat employment has been sufficient to keep the unemployment and underutilization rates stable, after deteriorating in 2023 and 2024.
- The static job market has kept conditions for youth depressed, but has been playing out differently for teenagers compared to those in their early 20s. Teenage employment rates have plunged, the net decline concentrated in retail trade and accommodation and food services. Retail has also contributed to the (less severe) weakness among those in their early 20s, but a drop in professional, scientific, and technical services has loomed larger, pushing some recent grads to find work in lower-paying industries.
- As of late April, Canadian job postings on Indeed were steady year over year, following earlier declines, suggesting the tepid job seeker market will continue. Postings for occupations with greater exposure to generative AI remain relatively weak compared to pre-pandemic levels, but have evolved more similarly to other fields since mid-2023.
The Canadian labour market began 2026 on a downswing. But zooming out, the rough start is more consistent with the stable, underwhelming conditions that have prevailed since late-2024 than with a more material downward shift.
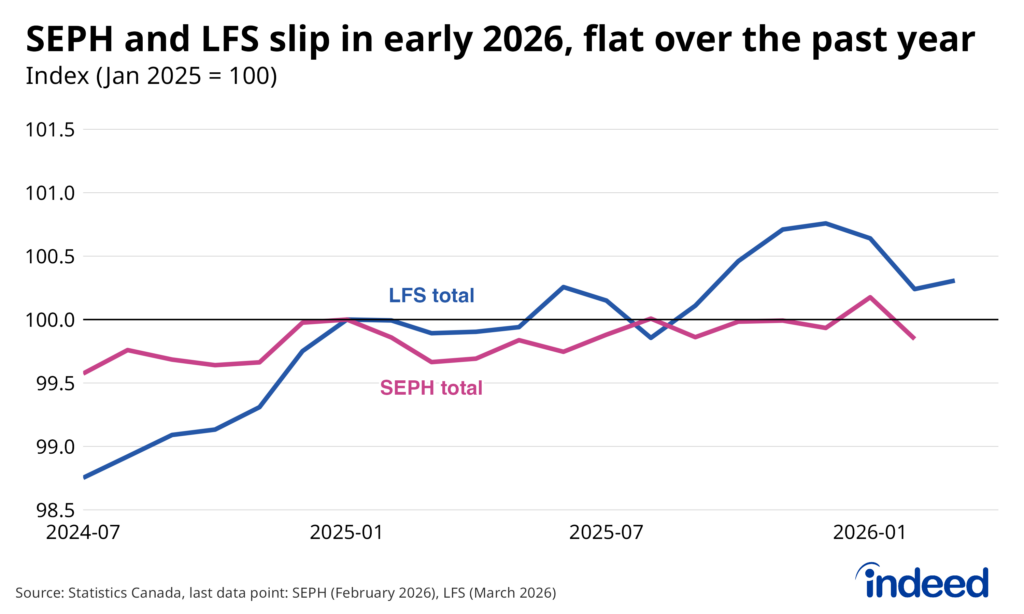
Employment dropped during the first two months of the year, including an eye-popping decline in February of 84,000, according to the Labour Force Survey (LFS). However, the -33,000 monthly average employment change in Q1 2026 followed a surprisingly strong +45,000 monthly pace in Q4 2025. Meanwhile, payroll employment, as measured by the Survey of Employment, Payrolls and Hours (SEPH), was mixed, rising in January before falling back in February after holding steady in late-2025. Despite showing different recent momentum, the two datasets are aligned that there’s been very little net employment change in either direction over the past year (the latest year-over-year growth is 0.4% and 0.0% in the LFS and SEPH, respectively).
Health care and construction job growth among sectors offsetting weak trends in manufacturing and retail
Among industries, a few patterns stand out beneath the flat headline SEPH payroll numbers over the past year. Employment trends in both manufacturing – especially transportation-related production – and forestry have been weak, likely reflecting impacts of the trade war. Retail and wholesale trade have also slipped, coinciding with declining job seeker applications in these sectors.
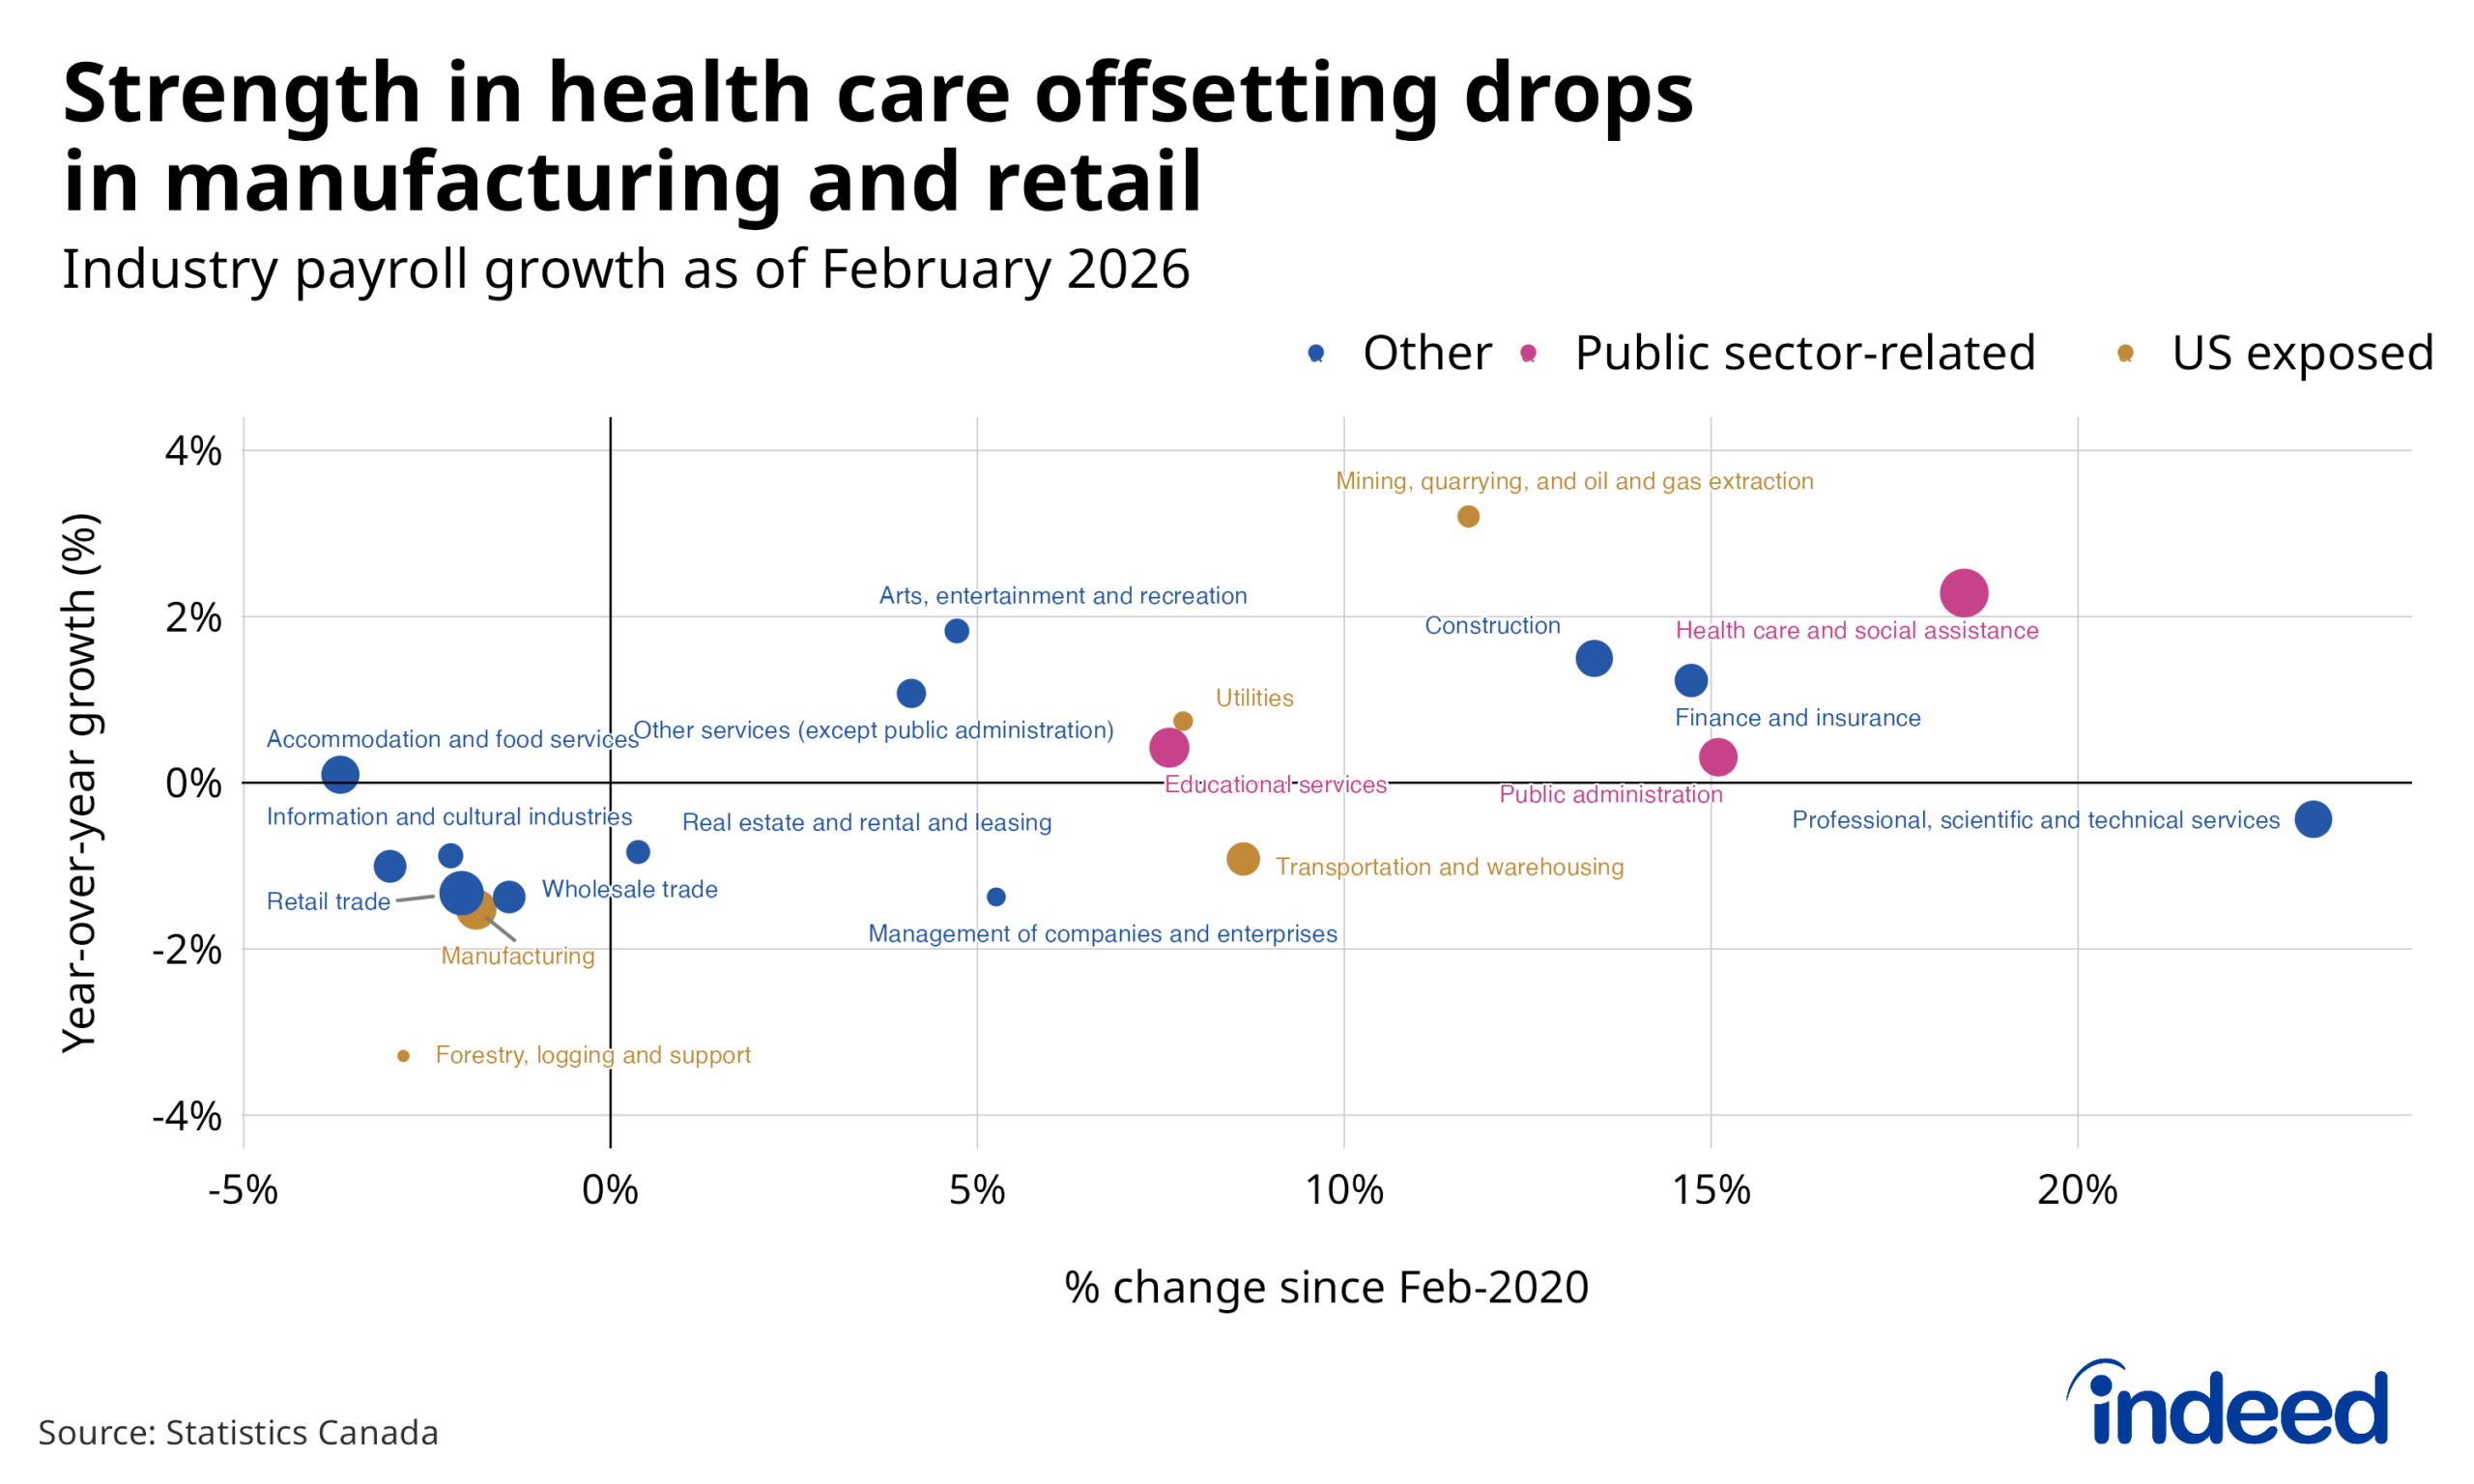
Meanwhile, ongoing job growth in health care and social assistance – the largest overall industry by employment – has offset weakness elsewhere. Both segments have grown quickly in recent years: health care, in part driven by population aging, and social assistance, with childcare services a main contributor since the Federal government rolled out its national program in 2021. However, other industries grew similarly or even faster than health care over the past year, including mining, oil, and gas, arts, entertainment, and recreation (particularly in the recreation subindustry), and construction (particularly non-residential buildings).
Steady unemployment despite little employment gains due to flat population
As the working-age (15-64) population has slipped into a slight decline (due to both the recent whiplash in Canadian immigration policy and population aging), the “breakeven” pace of job growth consistent with a stable labour market has flattened. The result is that both the unemployment rate and the labour underutilization rate (which also includes those working part-time for economic reasons, and those out of work not searching due to discouragement) have been relatively steady over the past year, despite little job growth. This is in contrast to 2023-2024, when the job market deteriorated, as employment growth lagged population growth.
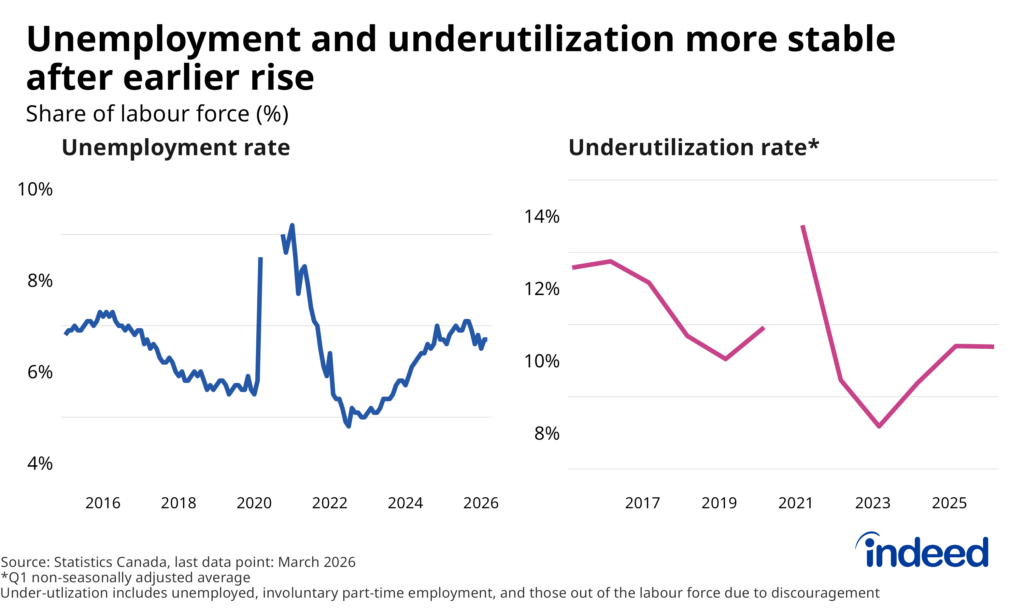
From a longer-term perspective, the 6.7% unemployment rate in March 2026 matched the level in 2017, but remained nearly a full percentage point higher than 2019. Meanwhile, the 10.4% average underutilization rate in Q1 2026 was closer to its Q1 2019 level, and somewhat lower than in the same period in 2016. The stronger longer-term trend in underutilization compared to unemployment mainly reflects a decline in the number of part-time workers (who usually work less than 30 hours per week) doing so for economic reasons.
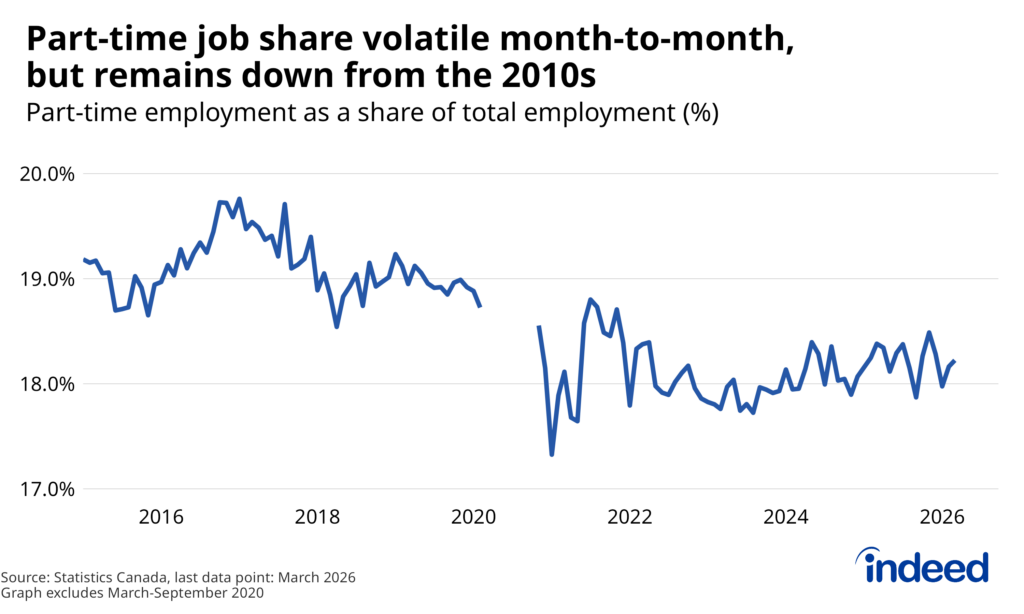
Some of this decline in involuntary part-time work reflects a drop in the share of workers in part-time employment more broadly. Over the past year, the part-time share of total employment has been quite volatile on a monthly basis, bouncing between 17.9% and 18.5% over the past year, standing at 18.2% in March. Nonetheless, the share of workers who typically work less than 30 hours per week remains below the near 19% share seen at the onset of the pandemic.
Youth employment rates remain depressed
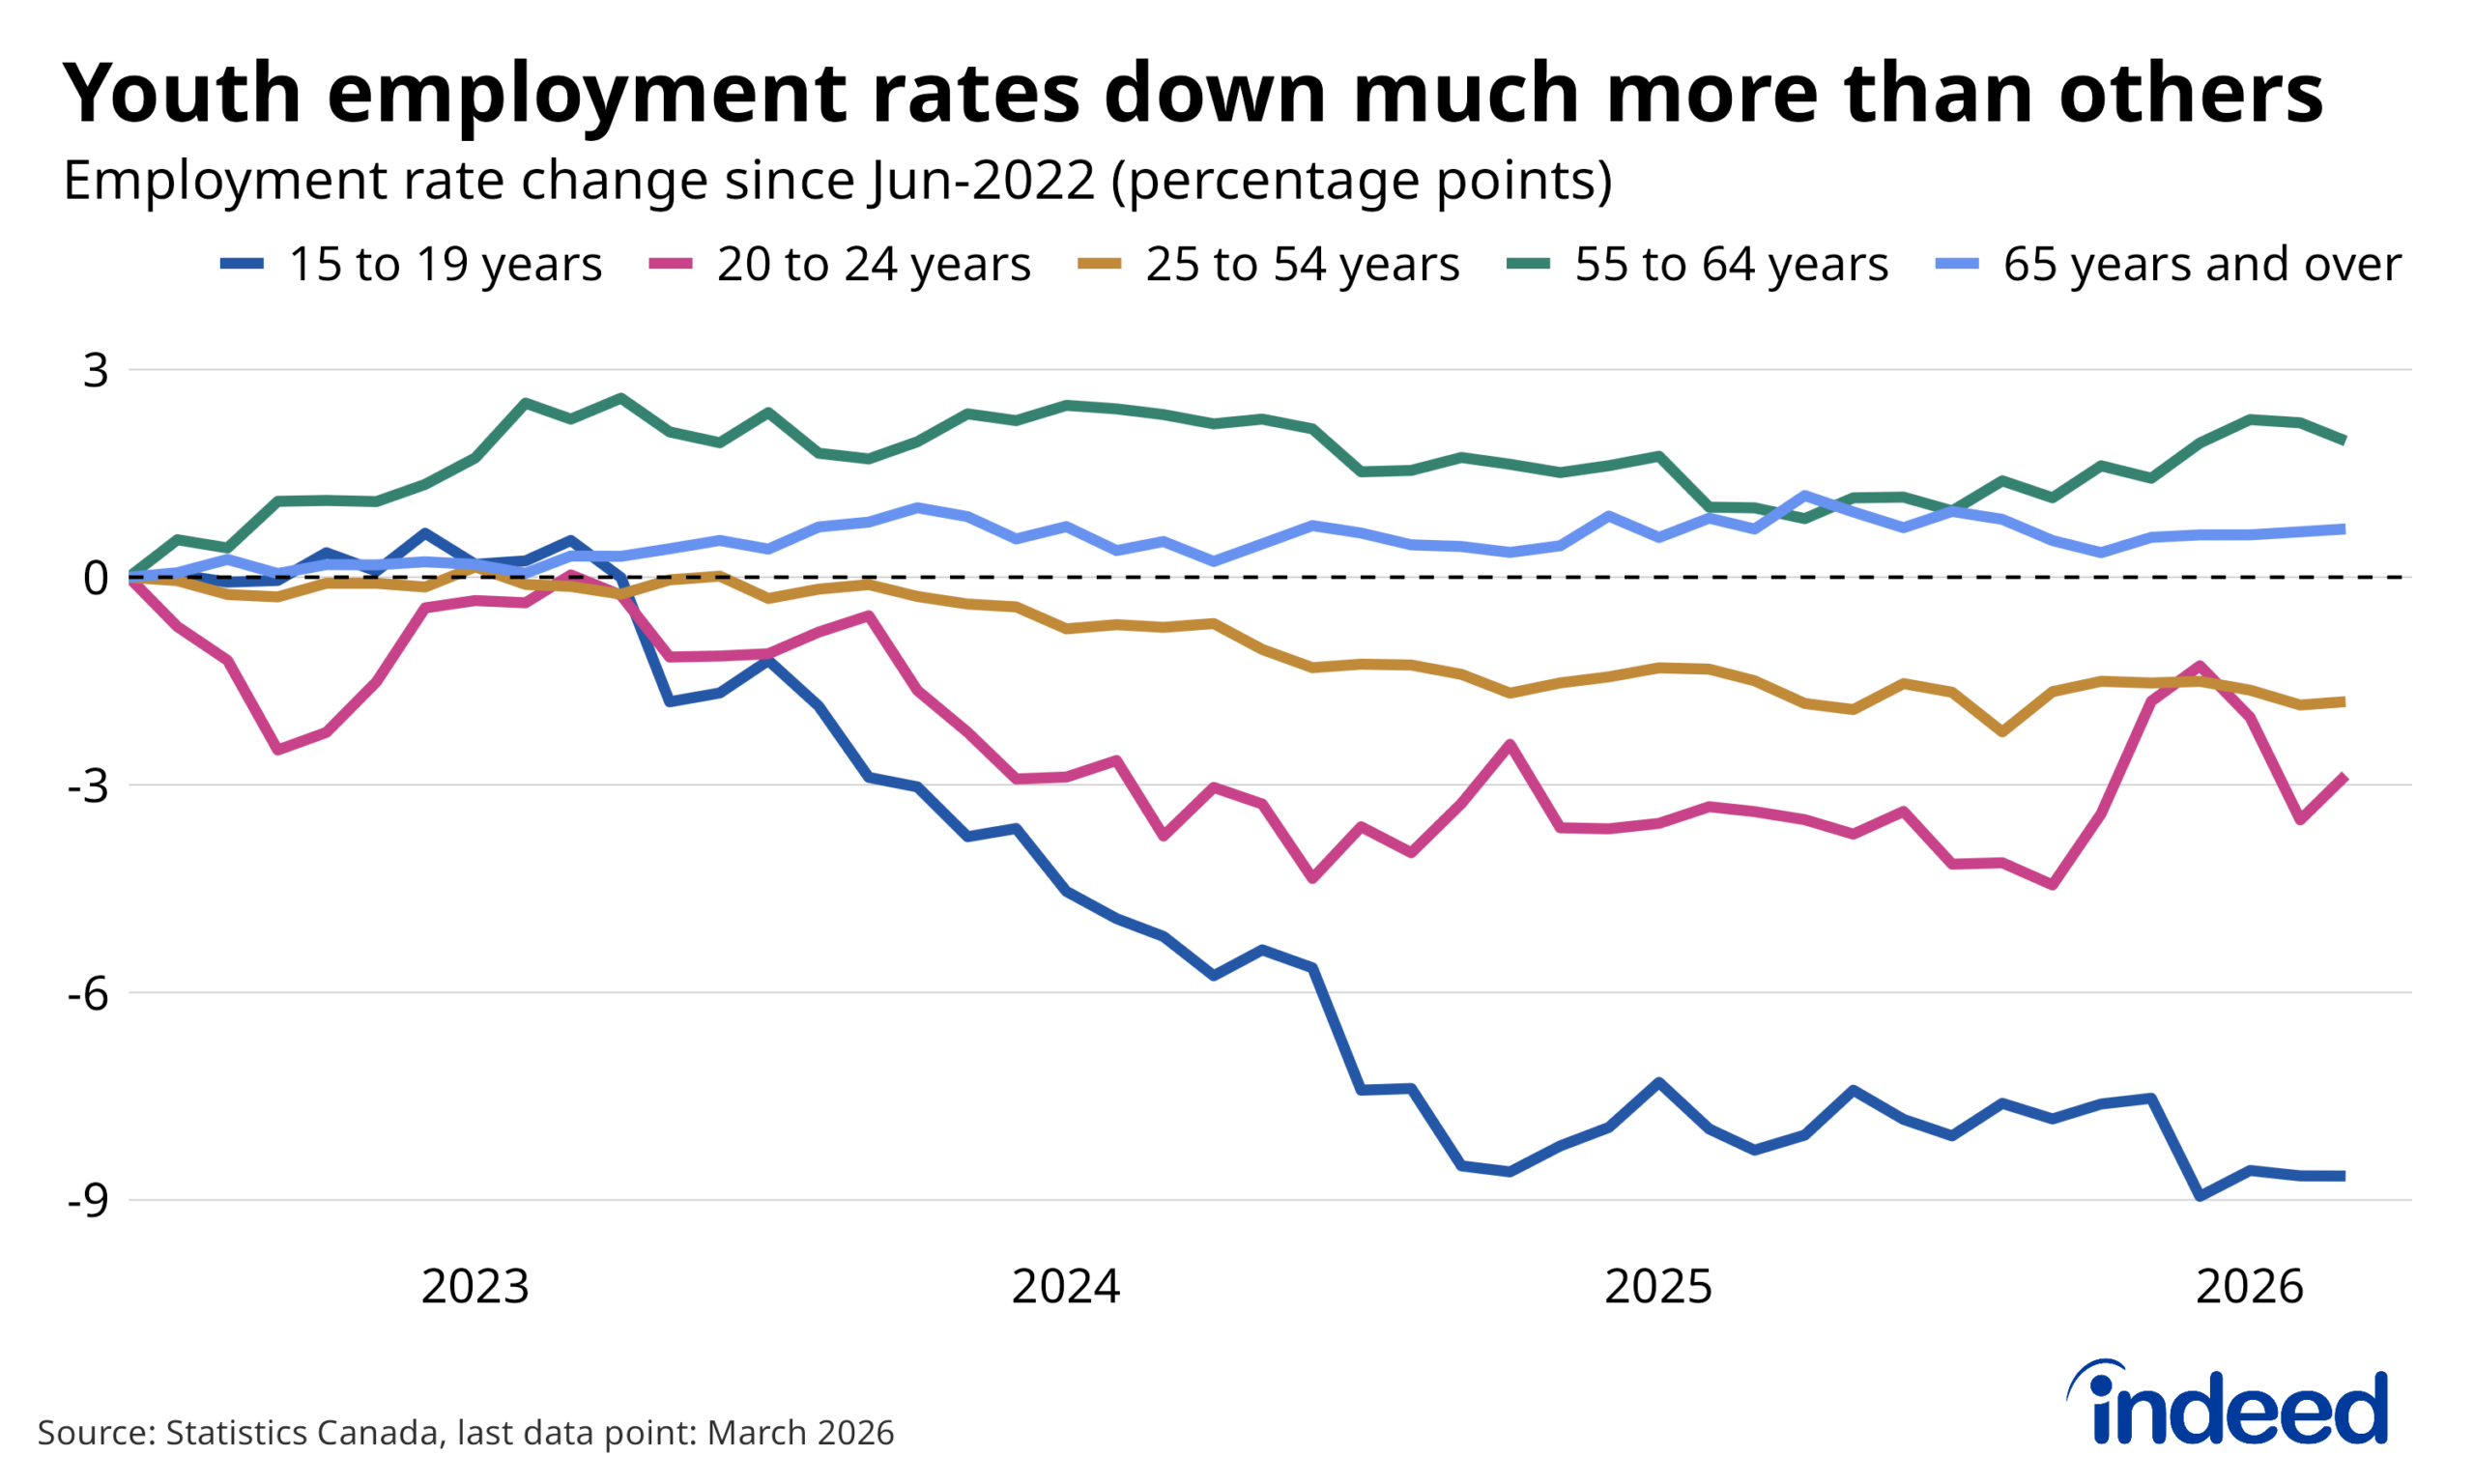
Despite being relatively stable over the past year, the labour market damage from the 2023-2024 slowdown hasn’t reversed, which is particularly bad news for younger Canadians. At one end of the age distribution, as of March 2026, the share of adults aged 55-64 and 65+ who are working is actually somewhat higher than in mid-2022. Meanwhile, there’s been moderate deterioration among core-age workers, whose employment rates are down 1.8 percentage points over the same period. But the decline has been sharper among youth, including falls of 2.9 percentage points among people aged 20 to 24 (which had been even greater, prior to partial rebound in Q4 2025) and a whopping 8.7-point drop among 15 to 19-year-olds.
Though both segments of youth have struggled in recent years, the industries leading their respective declines have been somewhat distinct. Nearly all of the net decline in teenage employment rates has come from two industries – retail trade and accommodation & food services – which together in Q1 2023 accounted for two-thirds of employment among those aged 15 to 19, and have fared relatively poorly in terms of overall job growth in recent years.
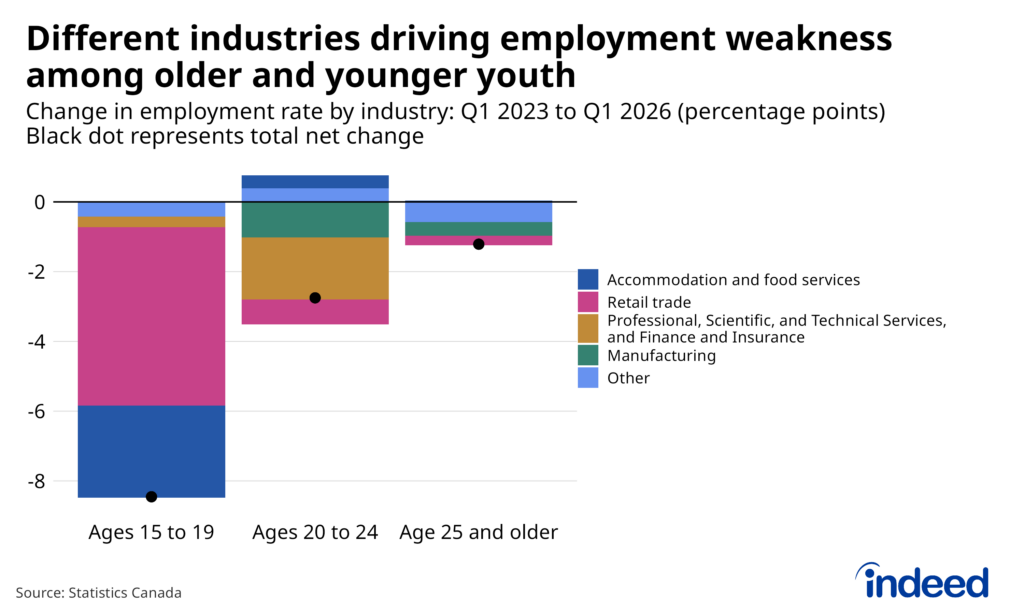
Retail employment is also down, to a lesser degree, among 20- to 24-year-olds, but accommodation and food service employment has been fairly stable. Looming even larger among the 20- to 24-year-old cohort has been a decline in the share of people working in manufacturing, and to an even greater extent, professional and technical services, as well as in finance and insurance. Employment in these higher-paying service industries boomed among young and older workers alike over the decade through 2023, but much of this earlier rise has reversed among 20- to 24-year-olds, while plateauing among those over 25.
The partial overlap of industries driving employment weakness across the two segments of Canadian youth highlights how the causes of their respective declines are both similar and distinct. The employment situation of labour market entrants is historically sensitive to shifts in hiring appetite, which has declined across the economy since 2022, impacting both groups. Moreover, rising numbers of non-permanent residents in Canada between 2022 and 2024 were working in both retail and accommodation and food services, as well as in professional services, increasing job seeker competition as demand cooled.
At the same time, there are also signs that the weaker job market facing 20-to-24-year-olds is spilling over into employment conditions for teens. For instance, as recent university grads have found it tougher to enter professional services and finance, a growing number are working in accommodation and food services instead. These slightly older, and likely more experienced, job seekers finding work in lower-paying fields represents an additional challenge to the tough market facing Canadian teenagers, and could be one reason why recent declines in the non-permanent resident population haven’t translated to material improvement. It also raises the possibility that potential employment effects of AI could spillover to impact workers who typically work in jobs not directly related to the new technology.
Job postings trends suggest the subdued job seeker market will continue.
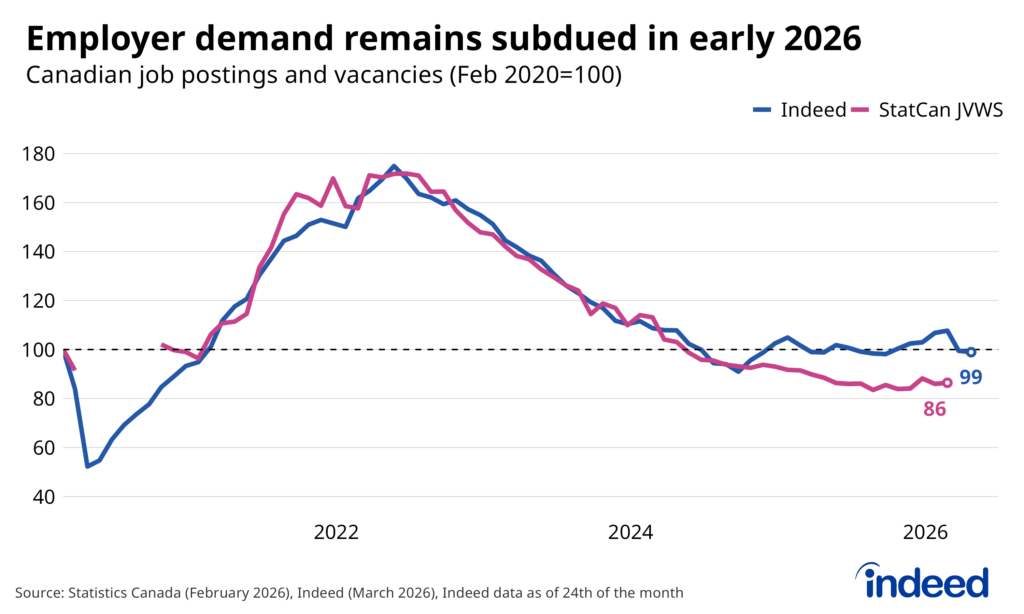
Relatively stable (but static) employment trends over the past year have also shown up in measures of employer demand. While somewhat volatile to start the year, as of April 24, 2026, Canadian job postings on Indeed were unchanged from a year earlier, roughly matching their pre-pandemic level. Job vacancies tallied by the Job Vacancy and Wage Survey (JVWS) were somewhat weaker in January 2026 from a year earlier (-5.5%), but were flat over the prior six months. Both metrics show hiring appetite remaining far below the highs of 2022 and 2023, with little sign of renewed momentum.
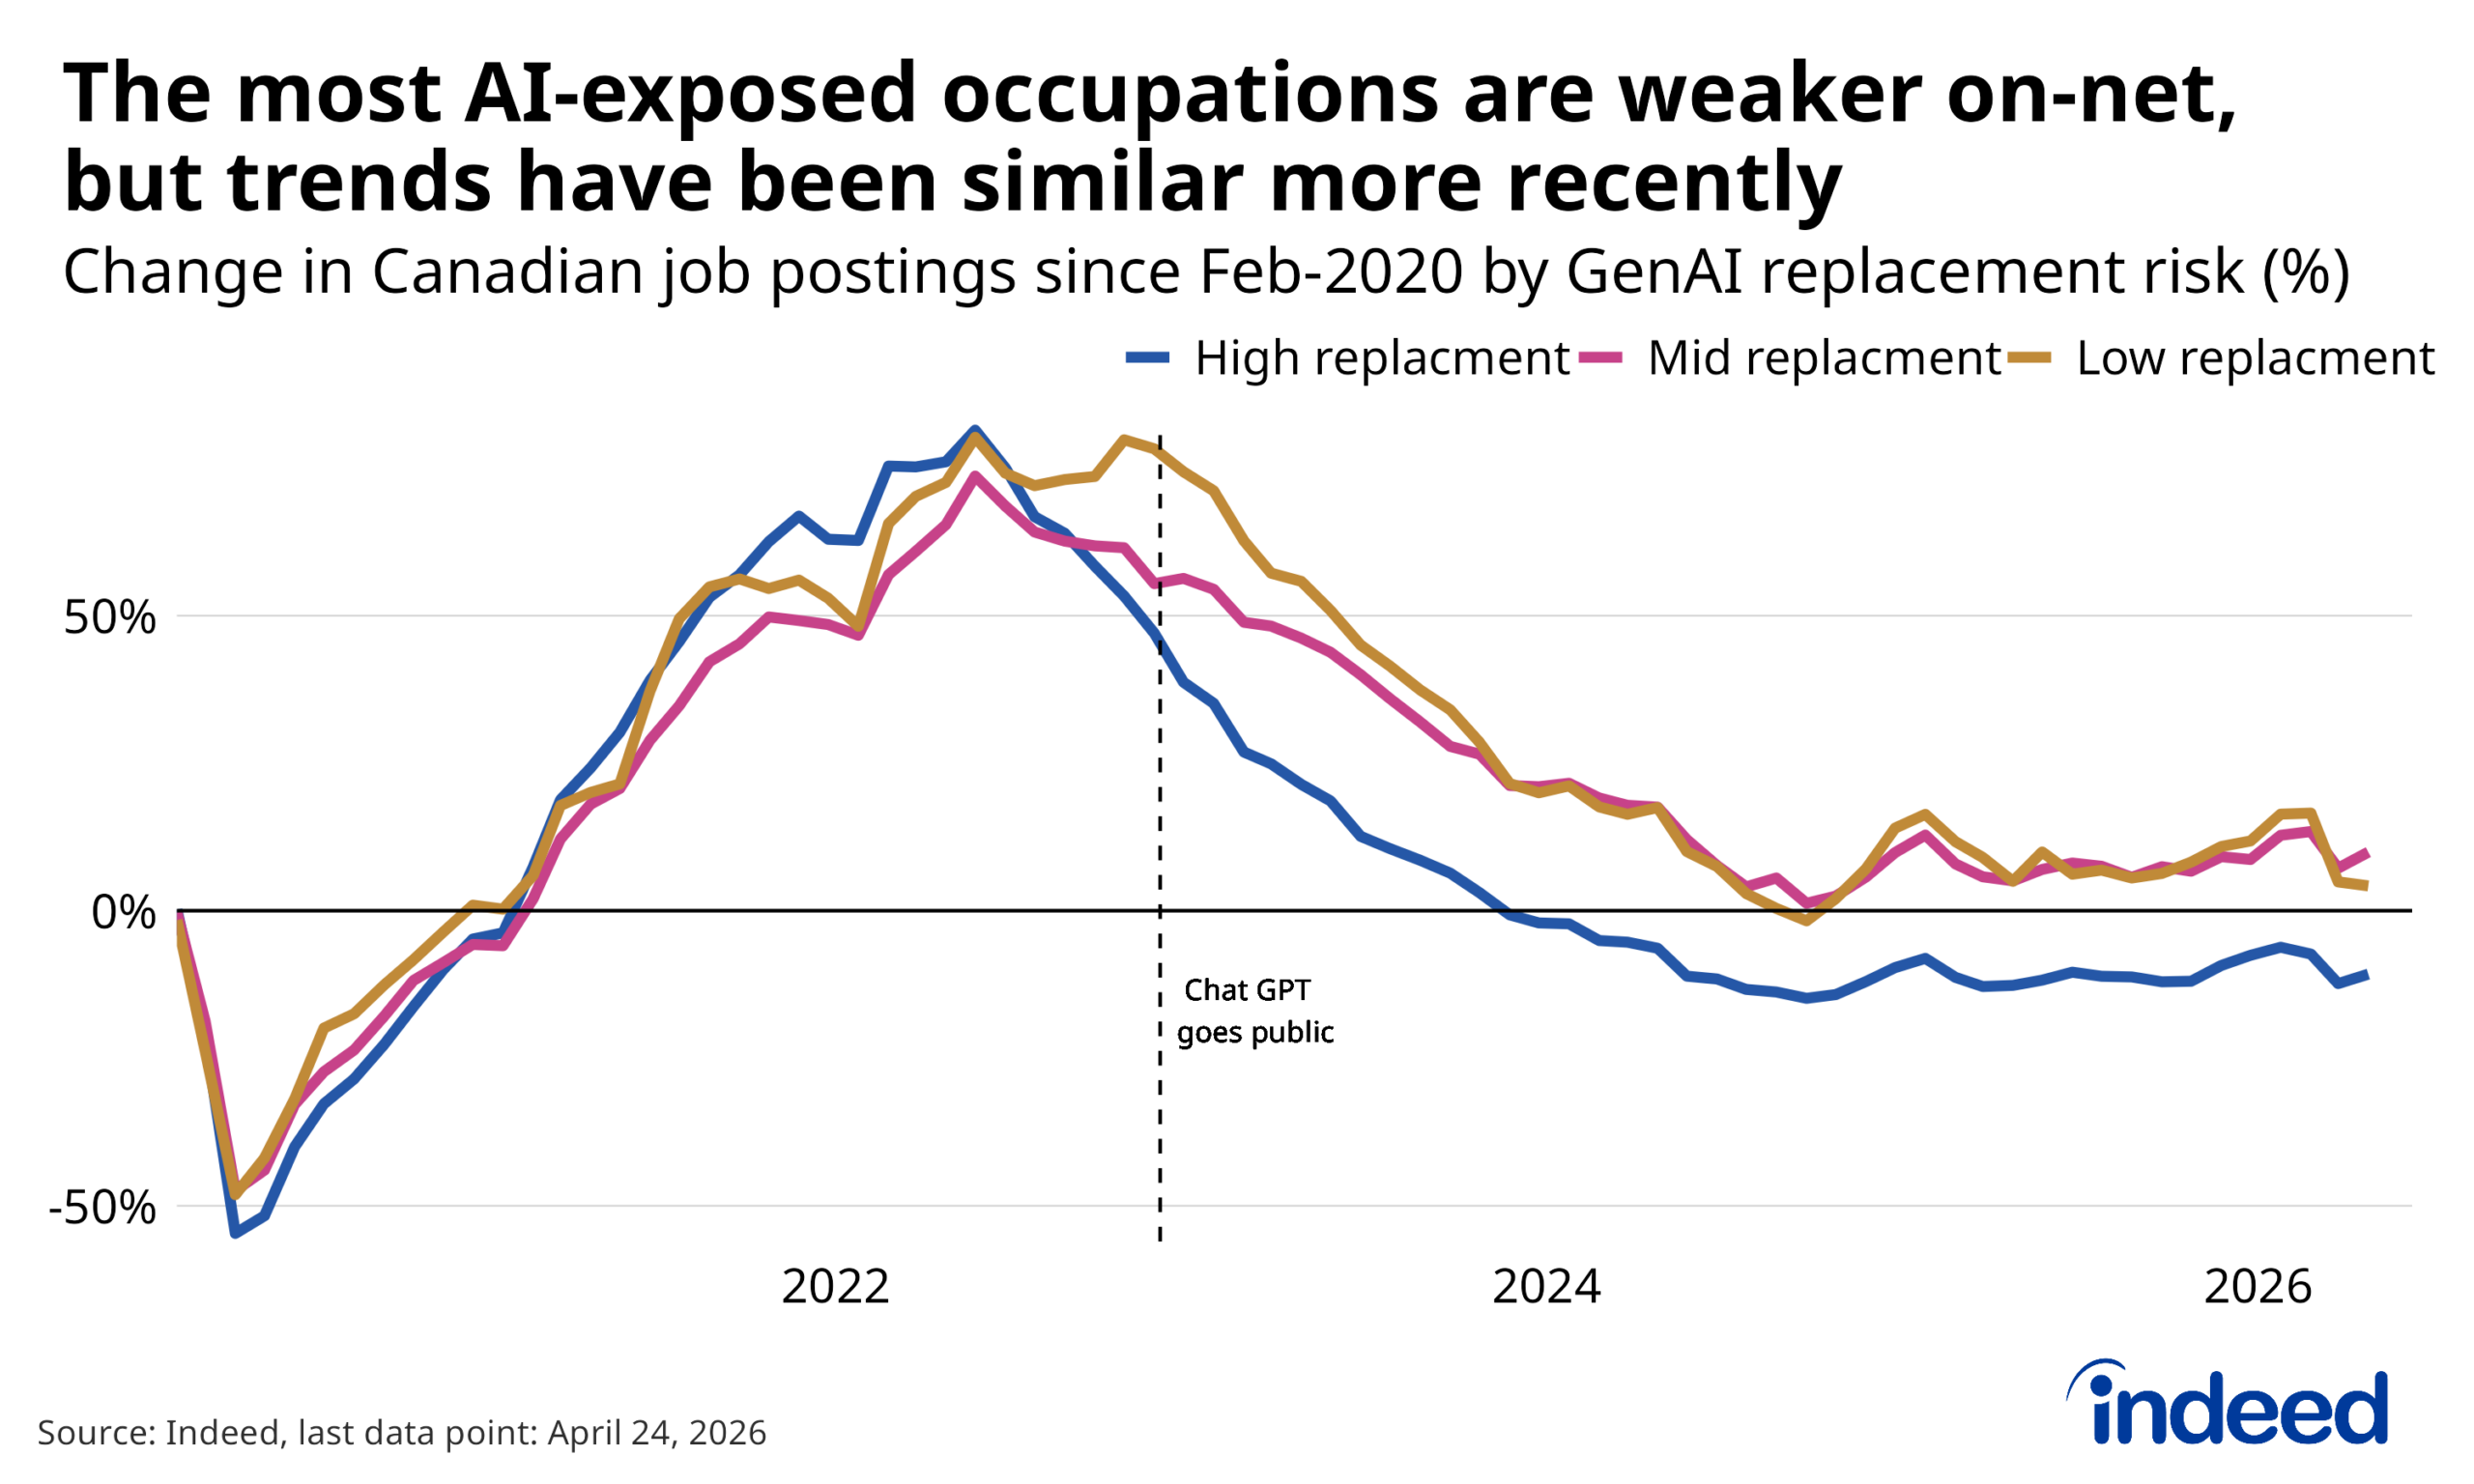
Broadly similar job posting trends across disparate sectors highlight how the cyclical evolution of the economy will likely remain the key determinant of the direction of overall job postings going forward. At the same time, as artificial intelligence increasingly looms as a potential source of automation, potentially driving demand for workers in AI-exposed occupations down compared to the rest of the economy.
So far, it remains difficult to pinpoint a specific impact from AI on Canadian job postings. Postings among occupations particularly vulnerable to GenAI replacement including tech, marketing, and sales are, in fact, weaker relative to pre-pandemic levels than those in other fields. However, this gap first emerged in early 2022, prior to the popularization of ChatGPT. Since mid-2023, job ads in highly exposed occupations have evolved similarly to the rest of the economy, and the weakest categories over the past year were in roles with little near-term replacement risk, such as nursing, and personal care and home health.
The new AI-era clouds over a subdued labour market
Despite remaining relatively stable over the past year, the Canadian job market remains static, leaving many job seekers in the lurch. The broad-based nature of the soft hiring environment highlights how the economic cycle is likely driving much of the recent weakness. Yet whether coincidence or not, demand for workers in many higher-paying AI-exposed roles has been weak during the new AI era, naturally raising concerns for the most likely impacted groups, particularly recent grads. Heavy AI investment, further technological advances, and the adoption of the technology raise concerns about whether these opportunities will bounce back at all.
The subdued but otherwise stable outlook for the Canadian economy this year suggests clarity on the future of AI-exposed professional occupations won’t be forthcoming in the near-term. A stronger economy that boosted hiring appetite in less-exposed sectors would be a good test to see if these exposed fields followed suit. But with little signs of momentum in labour demand across most of the economy, the clouds of what the new AI era could mean for the job market will likely be lingering for the time being.
Methodology
All job postings figures in this blog post are the index of seasonally adjusted Canadian job postings on Indeed, rebased to February 1, 2020, using a seven-day trailing average.
The number of job postings on Indeed, whether related to paid or unpaid job solicitations, is not indicative of potential revenue or earnings of Indeed, which comprises a significant percentage of the HR Technology segment of its parent company, Recruit Holdings Co., Ltd. Job posting numbers are provided for information purposes only and should not be viewed as an indicator of performance of Indeed or Recruit. Please refer to the Recruit Holdings investor relations website and regulatory filings in Japan for more detailed information on revenue generation by Recruit’s HR Technology segment.