
Key points:
- The labour market was soft but fairly stable amid a tumultuous 2025 for the Canadian economy. Forecasts project a moderate pickup in GDP growth in 2026, which suggests a modest decline in unemployment and more stable job vacancies in the year ahead.
- That said, it is unclear if growth will be sufficient to boost hiring enough to meaningfully reverse the negative trends that have impacted job seekers in recent years.
- The general direction of the labour market has been similar across the country, but conditions still vary, most notably between Ontario — which has one of Canada’s highest unemployment rates — and Quebec, which has the lowest.
- Policy changes, including the trade war, were apparent in many of the industries with the strongest and weakest job growth in 2025: payroll employment dropped sharply in auto-parts manufacturing and at community colleges, while social assistance (e.g., childcare) jobs were among the fastest-growing.
- Population growth will likely slow further in 2026, depending on if the number of non-permanent residents leaving the country continues to rise, but the pace of the shift and the ultimate labour market impacts remain uncertain.
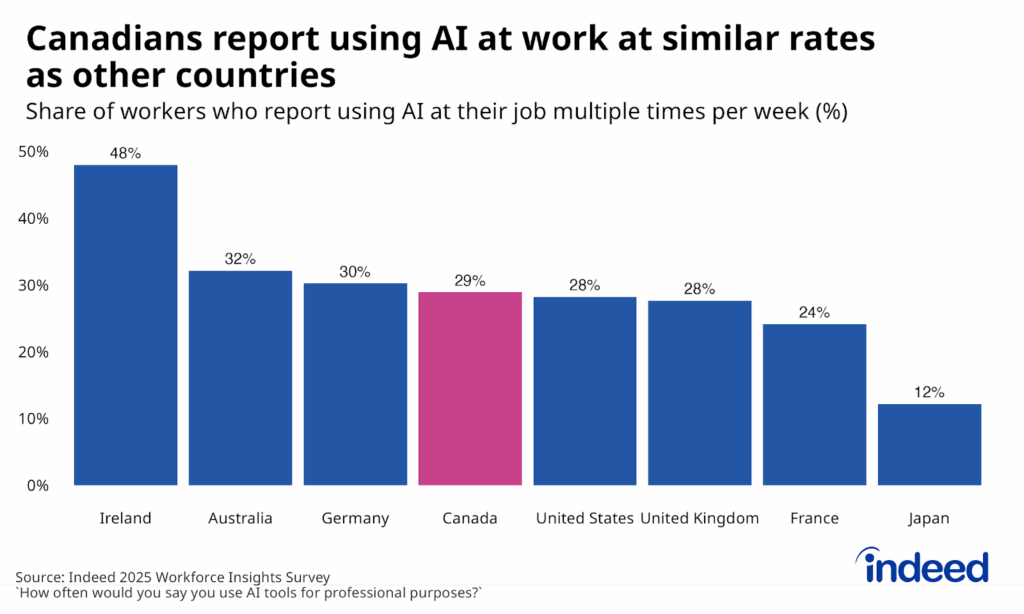
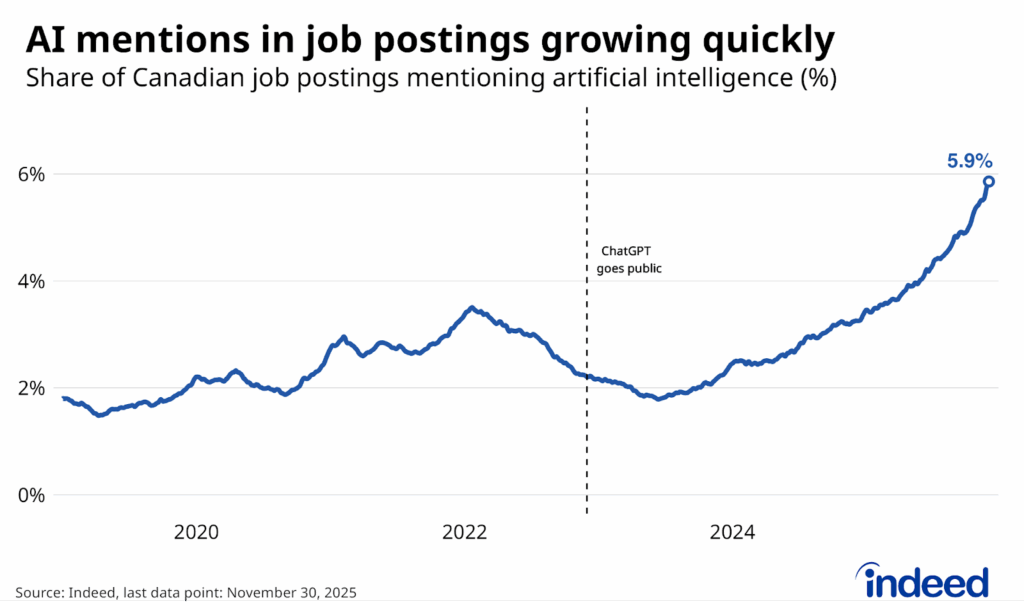
- Mentions of artificial intelligence (AI) in job postings nearly doubled in 2025 to 6% of total postings, while 29% of Canadian workers report regularly using AI at work. However, it remains difficult to pinpoint AI’s broader effects. For instance, the share of Canadians in their twenties working in high-paying occupations with high AI-exposure has slipped since 2022, but following a sharp rise in earlier years.
Sometimes the recent past is a useful guide for what to expect in the future. Many of the themes that defined the Canadian labour market in 2025 have been in place since at least 2022, and it’s a safe bet that many will continue into 2026. Still, more recent, fast-moving trends related to trade, immigration, and the new AI era will also leave their marks on the year ahead.
The labour market came through 2025 soft, but intact
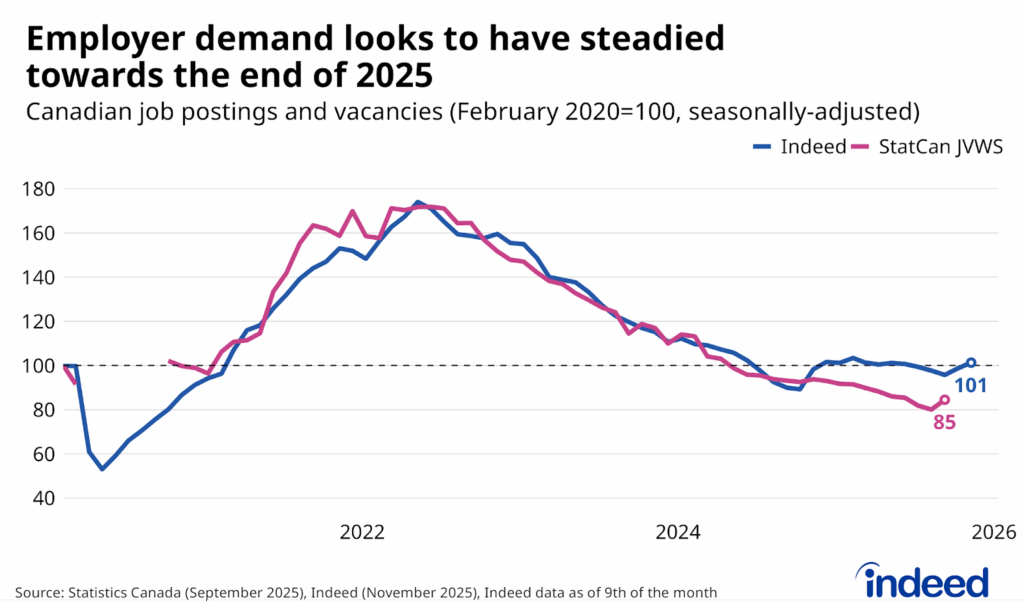
The Canadian labour market was lackluster for a third straight year in 2025. But given the circumstances, conditions could have been worse. Exports plunged in Q2, delivering an immediate hit to the economy, and the rebound since has been far from sufficient to get real GDP growth back to its prior trend. However, while these developments filtered into employer demand, the response wasn’t dramatic: the job vacancy rate fell from 3.1% in Q3 2024 to 2.8% in Q3 2025, a shallower decline than the prior year’s drop (4.0% to 3.1%). Stable job postings on Indeed between September and November 2025 suggest little change in employer demand since.
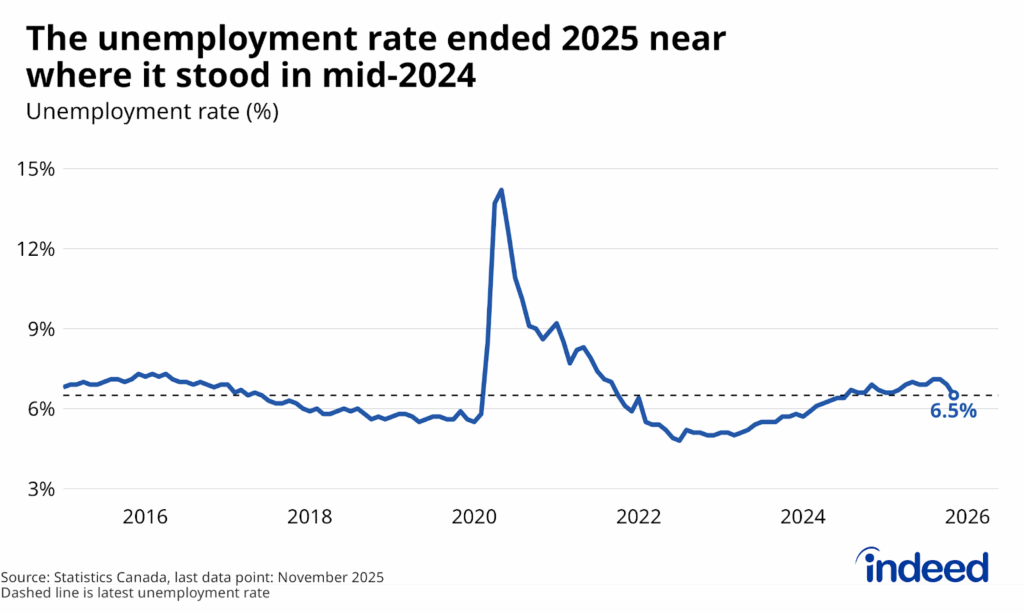
The unemployment rate in 2025 wasn’t particularly sensitive to the further dip in demand either. The jobless rate rose from 6.6% in mid-2024 to a 7.0% average in Q3 but fell back to 6.5% in November. Other components of labour market weakness — including involuntary part-time employment and the prevalence of discouraged workers — edged up marginally. Taken together with the jobless rate, overall labour force underutilization captured by the Labour Force Survey over the three months through November, ticked up a modest 0.2 percentage points over the course of the year.
Economic forecasts suggest modest labour market improvement in 2026
Recent economic forecasts suggest the prospect for modest improvement heading into 2026: the Bank of Canada and other forecasters project real GDP growth to bounce back to about 1.6% year-over-year by the end of 2026, up from an estimated just 0.5% growth in 2025. While not especially strong, this pace would likely exceed expected population growth and is slightly above estimates of potential GDP growth (roughly 1.4%).
Economic growth near this level will likely be sufficient for the unemployment rate to edge lower and the job vacancy rate to stabilize. The November 2025 Federal Budget (with economic assumptions based on a survey of private sector forecasters) projects a slight 0.2 percentage point decline in the annual average unemployment rate over the next year, from 7.0% to 6.8%, with a further 0.4 point drop in 2027.
There are still substantial risks to the Canadian outlook in 2026, the most prominent being further disruption to the U.S. trading relationship. Professional forecasters place a fairly low 9% probability of an outright contraction in GDP in 2026, but a 20% likelihood of very slow growth of between 0% and 1%. Historical correlations between shortfalls in GDP growth relative to potential and the unemployment rate suggest this downside scenario could push the jobless rate up about 0.4 percentage points.
Firmer conditions won’t necessarily mean a robust market for job seekers
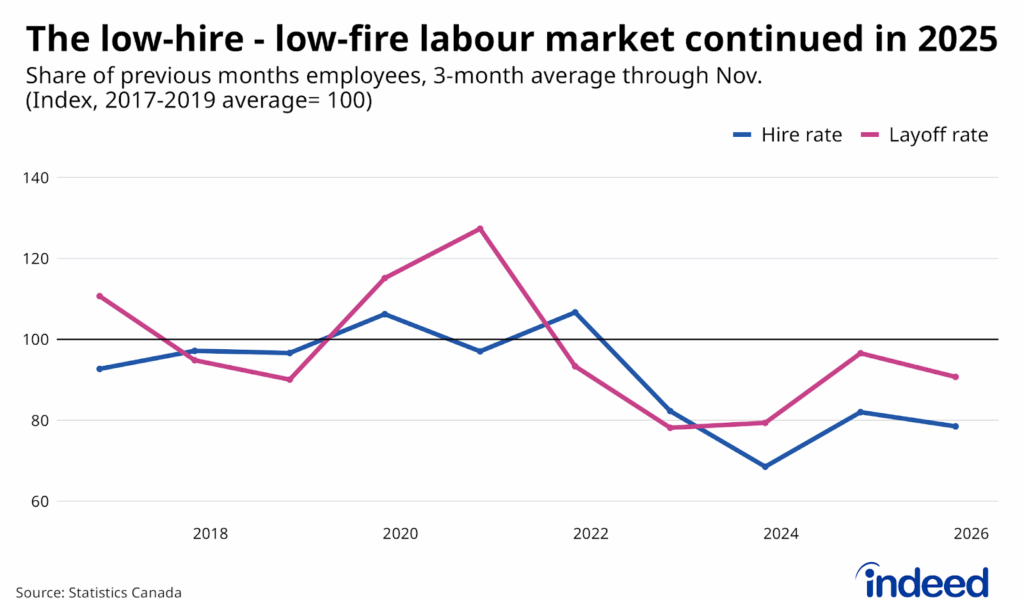
While baseline forecasts point to a potential labour market improvement in 2026, it might not be enough to disrupt the “low hire-low fire” dynamic that has characterized the Canadian (and US) labour market in recent years. Over the three months through November 2025, the layoff rate of employees was down 9% from its 2017-2019 average, while hiring rates were down 22% over the same period.
A continuation of this trend may mean that while job security remains solid, job seekers might see only minor progress in reversing the negative trends that have developed since 2022. Some challenging dynamics for job seekers deteriorated further in 2025, including:
- The share of Canadians between the ages of 15 and 24 who’ve never had a job continued to rise, reaching 26%, up from 21% three years earlier.
- Long-term joblessness rose, with 3.4% of Canadians ages 25 to 54 out of work longer than six months (despite wanting a job), up from 2.5% in late 2022.
- Only 0.4% of Canadian workers changed jobs in November 2025, down by almost half from the 0.7% rate that prevailed in 2019.
Strength varies across provinces
Labour markets have softened across almost all provinces since 2022. However, their prevailing strength heading into 2026 varies, both in terms of where unemployment rates stand today and how they compare to their pre-pandemic levels.
Ontario is struggling on both dimensions: not only is the province’s unemployment rate among the highest in Canada, averaging 7.6% over the three months through November, it has also experienced the largest increase (2.1 percentage points) since late 2019. B.C. has also experienced an outsized increase, but from a lower starting point. As a result, the province has gone from one of Canada’s strongest labour markets to middle of the pack. Elevated house prices and household debt in both provinces likely left the two economies more vulnerable to the rise in interest rates since 2022, which could be weighing on their labour markets.
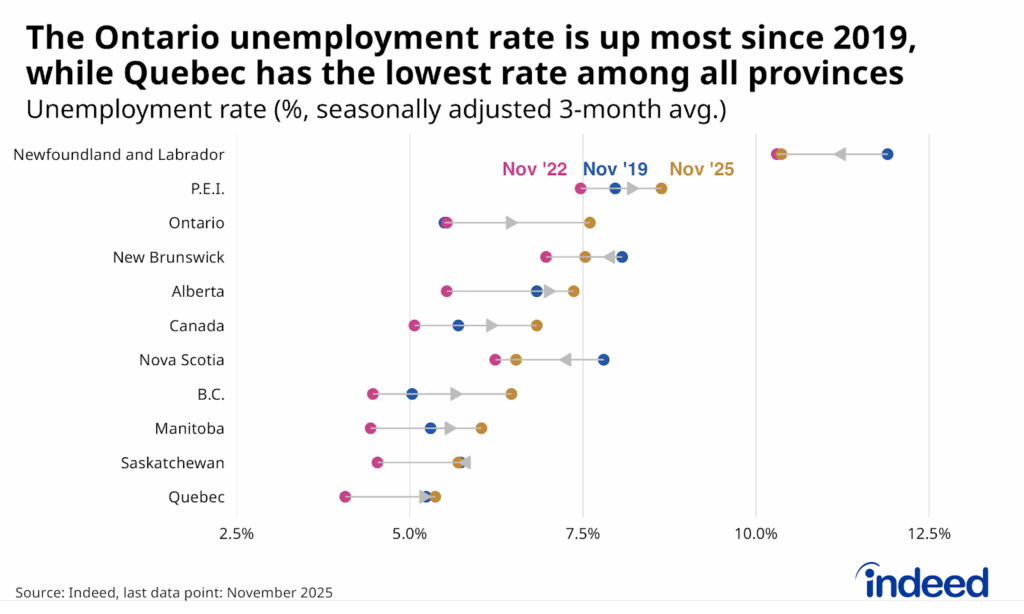
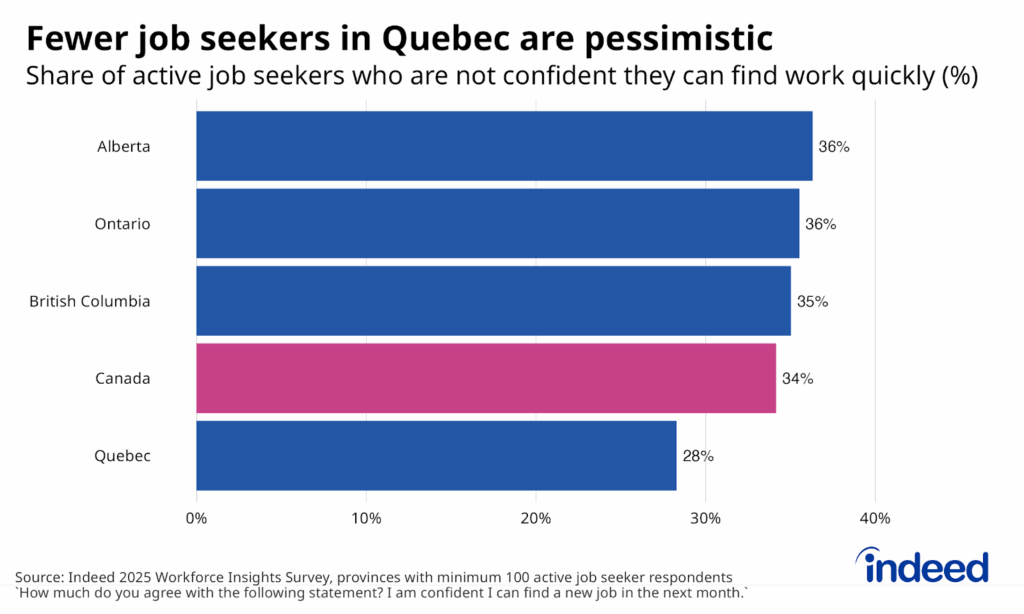
Conversely, Quebec is faring well. Not only is its recent 5.4% unemployment rate the lowest in Canada, but it also roughly matches where it stood in 2019. Quebec’s labour market was improving relative to the rest of Canada in the late 2010s, and that trend has continued this decade. Meanwhile, unemployment rates in Nova Scotia and New Brunswick haven’t deteriorated much since 2022, and remain below 2019 levels.
These trends have also made Quebec job seekers more optimistic about their job-finding prospects going forward. Indeed Hiring Lab’s 2025 Workforce Insights Survey asked respondents actively looking for work to rate how confident they were that they could find a new job within the next month. Just 28% of respondents from Quebec said they disagreed with the statement that they were confident in finding work quickly, compared to 34% of respondents Canada-wide. While the overall Canadian labour market might stabilize in 2026, it appears that regional differences in conditions will persist.
Growing and declining industries highlight policy, technology, and societal trends
Payroll employment, tracked by Statistics Canada’s Survey of Employment Payrolls and Hours, was mixed across Canadian industries in 2025, and there were several standouts on both the upside and downside. Between Q3 2024 and Q3 2025, employment fell by more than 4% in 10 of the 84 industries with at least 50,000 employees. Over the same period, it rose by a similar amount in only four categories.
Jobs fell fastest at motor vehicle parts manufacturers, a leading casualty of the trade war, with payrolls down almost 7% year-over-year. But while employment in certain other industries exposed to US demand, such as steel, and machinery manufacturing also slipped, many of the next-largest declines after parts-manufacturers were concentrated in sectors sensitive to other policy changes. Declining international student enrollment led to falling employment at community colleges, and the ranks of the federal public service shrank after earlier rapid growth. Meanwhile, ongoing technological and structural trends hit employment in industries including motion pictures and sound recording (which also faces trade uncertainty), telecommunications, and business support services, categories where employment trends were already weak prior to 2025.
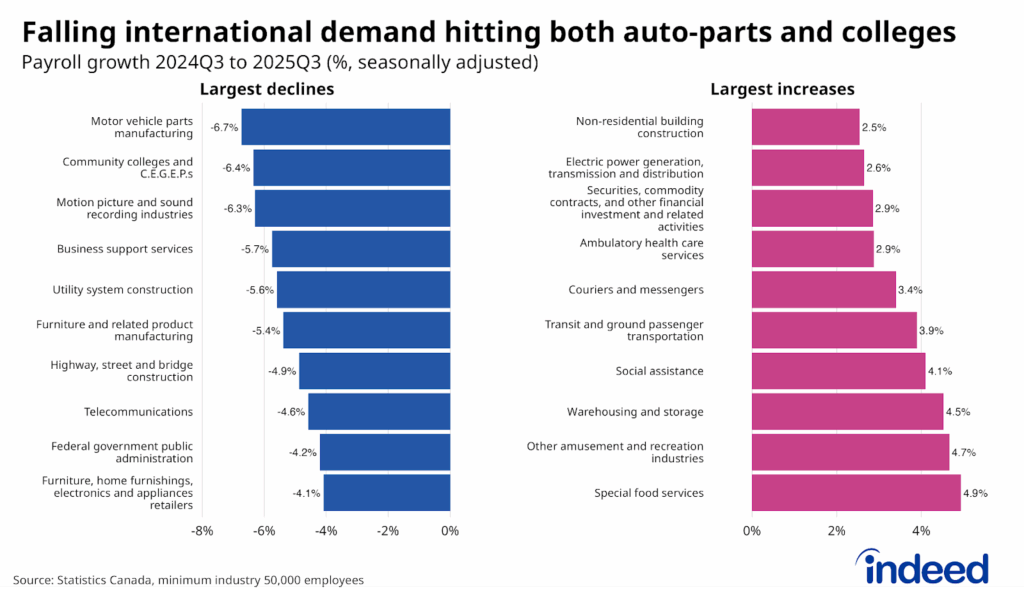
On the flipside, some of the industries that expanded fastest in 2025 were areas of the economy that had already grown substantially in recent years. Jobs in warehousing and storing, as well as couriers and messengers, rose at a solid year-over-year pace, a sign that the infrastructure underpinning the “on-demand” economy continued to grow. The same was true in social assistance (mainly childcare facilities) and ambulatory health services (e.g., clinics), supported by public funding and demographic shifts.
For many industries where job growth in 2025 continued with pre-existing trends, it’s a decent bet that these patterns continue in the year ahead. One risk is that trade-impacted businesses beyond the auto-parts industry, like motor vehicle manufacturing itself, join the list of sectors experiencing particularly sharp employment declines. Meanwhile, although trends impacting labour demand often drive industry-specific dynamics, changes in labour supply could also play a role in the year ahead.
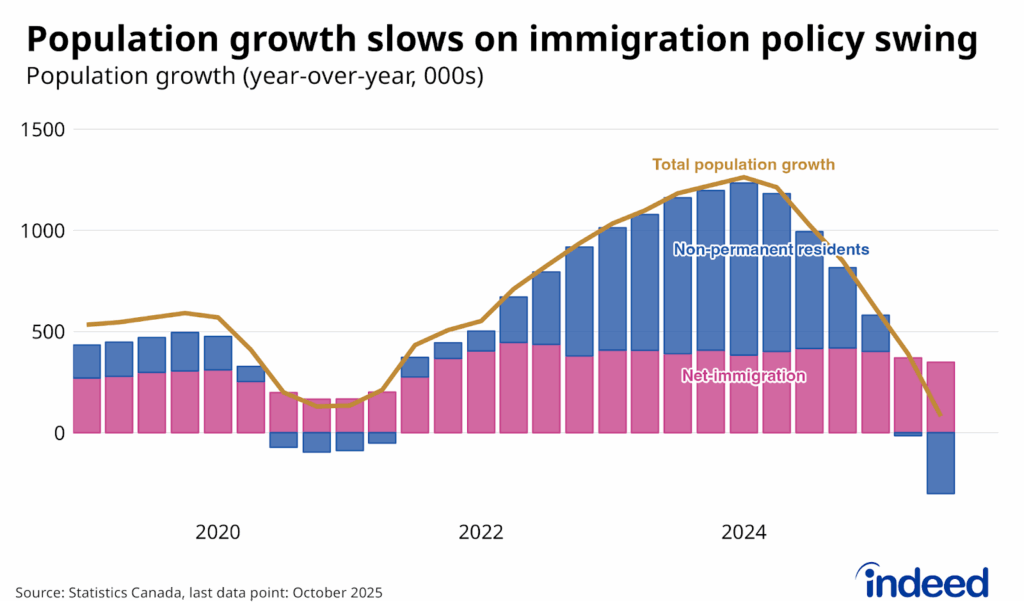
Population growth could turn negative in 2026
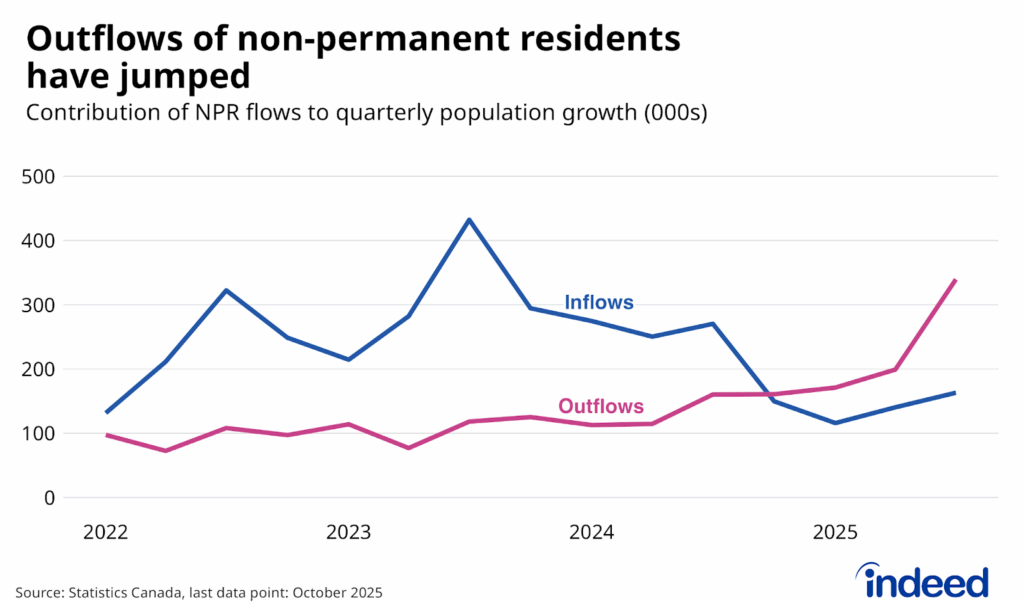
In mid-2025, year-over-year population growth hit its slowest rate (outside of the pandemic) since 2016. The swing in Canadian immigration policy driving these trends could be even more significant in 2026. The ranks of non-permanent residents (NPRs) as a share of the total population slipped from a peak of 7.6% in late 2024 to 6.8% by late 2025, as inflows of newcomers have slowed since early 2024 while outflows tripled.
The Federal government’s stated target that the number of non-permanent residents in Canada return to 5% of the population, where it stood in early 2023, provides a broad indication of how migration trends will evolve. Inflows of NPRs, particularly international students, have already plunged. But ultimately, the pace of outflows — and whether they occur through people actually leaving Canada or transitioning to permanent resident status — will be the main driver of both near-term population growth and the labour market impacts of the government’s policy shift.
While timely data is limited, all indications suggest that the NPR share of employees has jumped across industries in recent years. Their presence is likely greatest in the food service sector, where StatCan estimates that the NPR share of employees nearly doubled between 2019 and 2023, from 11% to 21%.
The elevated number of non-permanent residents working in lower-paying service occupations is likely to decline in the year ahead, but it’s unclear by how much and how employers will respond. Elevated youth unemployment suggests backfilling some of these vacated positions won’t be particularly difficult, especially outside of less-populated regions. Still, the large number of people on post-graduate work permits who are working across the economy with an uncertain future in Canada is going to create challenges for these workers and their employers alike in 2026.
AI’s presence in the labour market is rising, but the effects are less certain
The presence of artificial intelligence (AI) in the labour market, not to mention daily life, continues to grow. Our 2025 Workforce Insights Survey found that 29% of Canadian workers reported using some form of artificial intelligence at work multiple times per week, on par with workers in several other advanced economies, including the US.
Meanwhile, the rate at which employers mention AI in job postings on Indeed — which captures demand for AI-related skills and the use of AI in the workplace — surged in 2025. As of November 30, 2025, 5.9% of Canadian job postings included some mention of AI, nearly double where it stood a year earlier. And while mentions of AI in late 2025 were particularly common in fields like data & analytics (41% of posts), and software development (37%), they’re also increasingly appearing in occupations related to marketing (16%), business and finance (10%), and management (7%).
While the application of AI throughout the economy has grown, the technology’s impacts on the labour market more broadly are less clear. As of early November 2025, Canadian job postings on Indeed were relatively weak compared to early 2020 across several occupations where generative AI has the greatest automation potential, including software development, marketing, and customer service. That said, there were still a few cases of high AI-exposed fields like accounting, and business and finance, where trends looked closer to the trend in overall job postings.
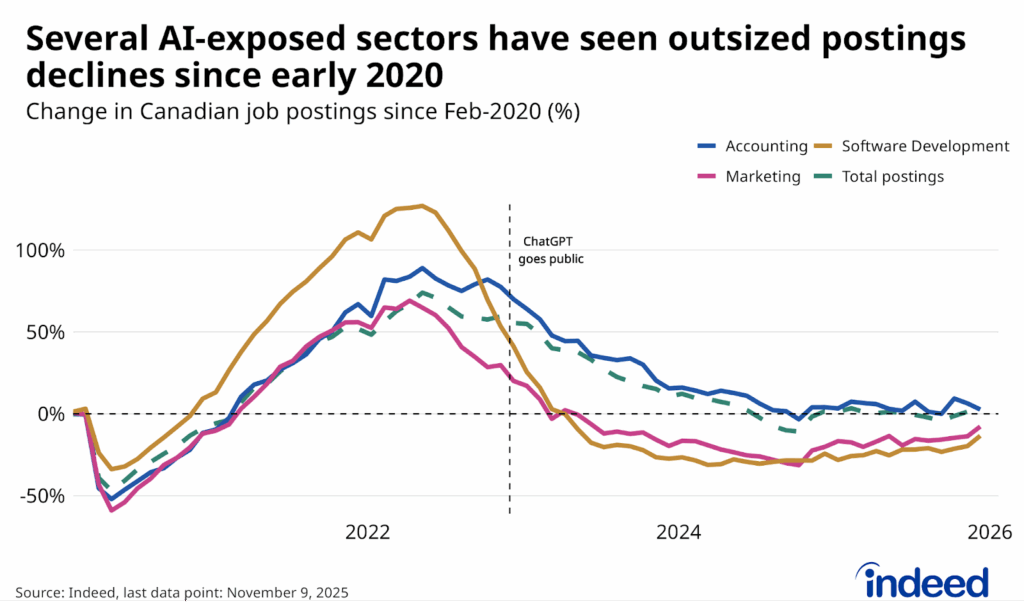
How much the outsized weakness in hiring appetite for the most AI-vulnerable occupations reflects the impact of the technology itself is difficult to pinpoint, including in the tech sector. In particular, the divergence in posting trends with other occupations mainly occurred between the six months prior to, and after the public arrival of ChatGPT in late 2022. Since mid-2023, postings across the board have evolved similarly and were relatively stable in 2025, despite AI adoption generally ramping up during the period.
Regardless of the specific drivers of the soft demand, there’s an understandable concern over what the rise of AI means for opportunities for young workers in high-paying occupations, many of which were previously considered relatively immune to automation. Employment in high-paying, AI-exposed occupations (the latter identified by Statistics Canada, mainly consisting of professional and management occupations) grew rapidly between 2015 and 2022, particularly among Canadians in their twenties. The share of Canadians aged 20-29 employed in these jobs soared from 13.0% in 2014 to 18.4% in 2022, with particularly rapid growth over the final two years. There was also a less dramatic increase among Canadians thirty and older.
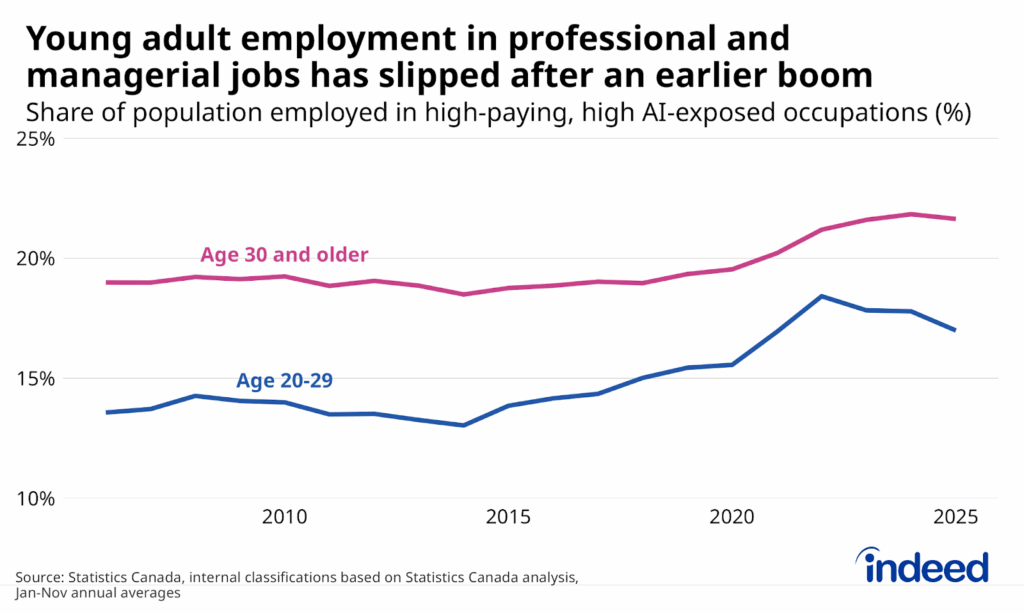
The situation has since turned, particularly for younger workers. While the share of the over-thirty population working in high-paying, highly AI-exposed roles has plateaued, it has declined since 2022 among Canadians in their twenties, falling back 1.4 percentage points to 17.0% in 2025.
The share of younger Canadians working in AI-exposed professional and managerial occupations remains quite elevated by historic standards. The decline since 2022 brought the employment rate back to where it stood in 2021, highlighting how rapid the growth was preceding the dawn of the AI-age, and the potential that recent trends are simply a partial reversion to the mean. Nonetheless, given the potential transformative impact of generative AI, it’s fair to wonder if the recent decline is the canary in the coal mine of what AI might mean for the job market.
Conclusion
The Canadian labour market enters 2026 in a unique situation. Trends including the rise of AI, the whiplash in immigration policy, and the uncertain future of Canada-U.S. trade relations all could leave substantial marks for years to come. And yet on the ground, recent experience suggests the day-to-day functioning of the labour market could remain relatively static. A slightly brighter economic outlook could drive some modest improvement in metrics like the unemployment rate. But there’s little sign so far that this will be sufficient to kick-start hiring to a degree that will substantially reverse the job seeker challenges that have accumulated in recent years.
Methodology
All job postings figures in this blog post are the index of seasonally adjusted Canadian job postings on Indeed, rebased to February 1, 2020, using a seven-day trailing average.
The number of job postings on Indeed, whether related to paid or unpaid job solicitations, is not indicative of potential revenue or earnings of Indeed, which comprises a significant percentage of the HR Technology segment of its parent company, Recruit Holdings Co., Ltd. Job posting numbers are provided for information purposes only and should not be viewed as an indicator of performance of Indeed or Recruit. Please refer to the Recruit Holdings investor relations website and regulatory filings in Japan for more detailed information on revenue generation by Recruit’s HR Technology segment.
This post uses data from the 2025 Indeed Workforce Insights Survey, an online survey conducted for Indeed Hiring Lab by YouGov, of more than 80,000 adults from the US, UK, Germany, France, Japan, Ireland, Australia, and Canada. Sampling was random and representative, with all responses weighted based on age, gender, education, and region in all markets, and by race, aligned to the U.S. Census Bureau, American Community Survey, 2022. Fieldwork was conducted during the months of May and June 2025, with a total of n = 80,936 interviews globally, and a minimum of n = 10,000 interviews per market. This sample size provides a margin of error of ±1% at the 95% confidence level within each market.
Employment data on high-paying highly AI-exposed is based on Occupational Classifications from Statistics Canada’s September 2024 report Experimental Estimates of Potential Artificial Intelligence Occupational Exposure in Canada, filtered for occupations with average hourly earnings above $35/hr in 2022, and occupations where the share of jobs with “low exposure” to AI is below 15%.