
Key points:
- After a weak start to the year, Canadian employment perked up in Q2 2026. Amid slow population growth, stable employment over the past year was sufficient to bring the working-age employment rate to its highest level since mid-2024.
- Job postings have edged lower since the start of the year but have remained relatively steady overall, with most occupations following suit except for health care and education, where postings have declined over the past year.
- Wage growth eased below 3% year-over-year in Q2, catching up to an earlier deceleration in the Indeed posted wage tracker.
- Employer mentions of location flexibility in job postings have held steady, suggesting that new jobs being started are partially offsetting a gradual return to the office among existing employees, keeping the overall prevalence of remote work elevated.
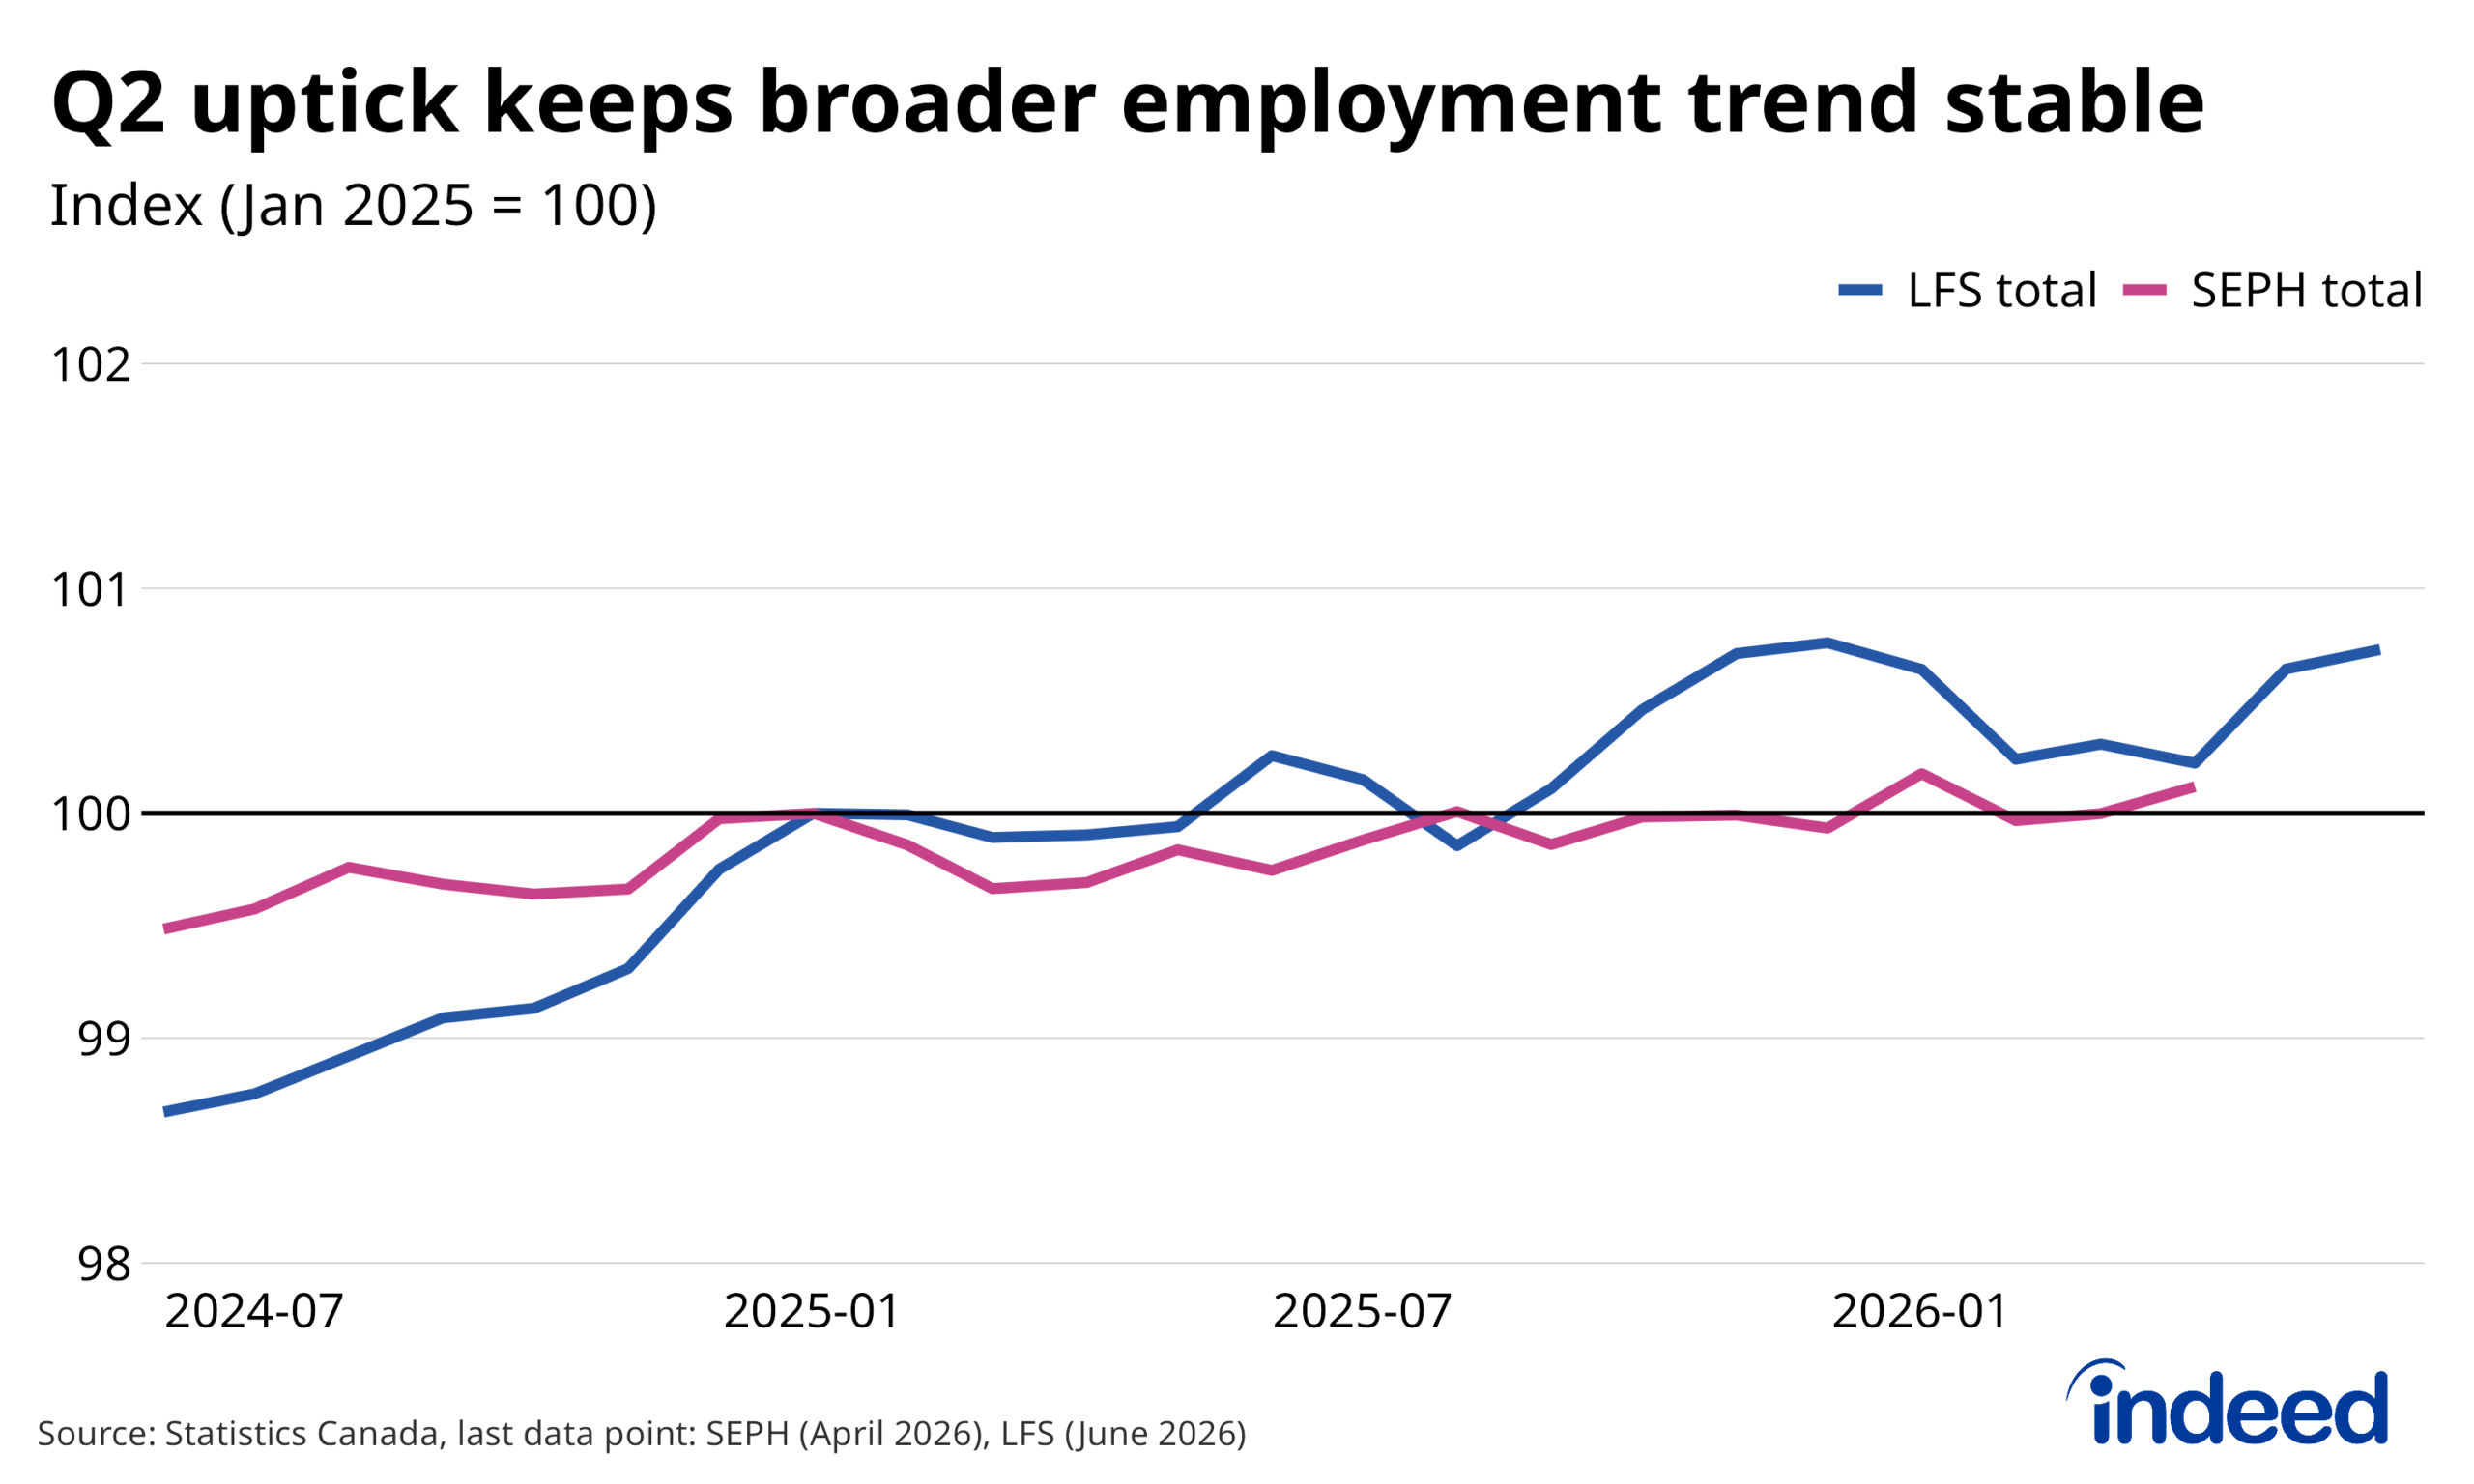
The Canadian labour market perked up in Q2 2026 after a weak start to the year. Employment in the Labour Force Survey (LFS) jumped in May and edged up further in June, offsetting a drop in Q1. Meanwhile, payrolls in the Survey of Employment, Payrolls, and Hours perked up in April, while the earlier-reported declines were revised away. Monthly job growth in the LFS has been more volatile over the past year than any period since the pandemic, but year-over-year growth has sent a consistent signal, showing roughly flat employment in both the LFS (+0.5%) and SEPH (+0.4%) since mid-2025.
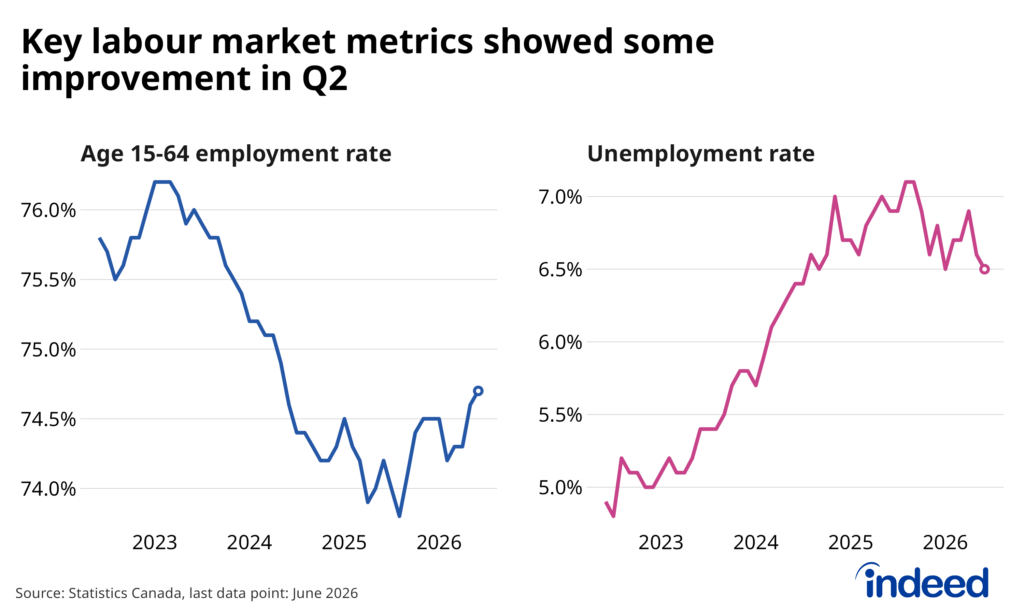
Slow job growth is likely to continue through 2026, as falling numbers of non-permanent residents and the resulting reacceleration of population aging contribute to slow labour force growth. However, in this context, flat employment trends don’t necessarily equate to a more fragile labour market. The 6.5% unemployment rate in June 2026 matched its lowest monthly rate since Q3 2024. The trend in the employment rate among working-age (15-64 years) adults has been even stronger. Both metrics remain weaker than during the post-pandemic rebound, and challenges facing job seekers (such as prolonged unemployment spells) persist. Nonetheless, firmer conditions in Q2 highlight the labour market’s resilience amid an otherwise soft economy.
Employment trends have been relatively flat across most of the economy, and according to April’s SEPH, 11 of the 17 industries with payrolls of at least 200,000 employees posted year-over-year job growth of within +/- 1%. Leaning to the softer side, professional services employment slipped from elevated levels, led by declines in the tech sector. Manufacturing was also down, reflecting ongoing declines in transportation equipment and auto-parts manufacturing, though the industry’s 1.0% dip wasn’t as sharp as the 2.3% pace of decline in 2025.
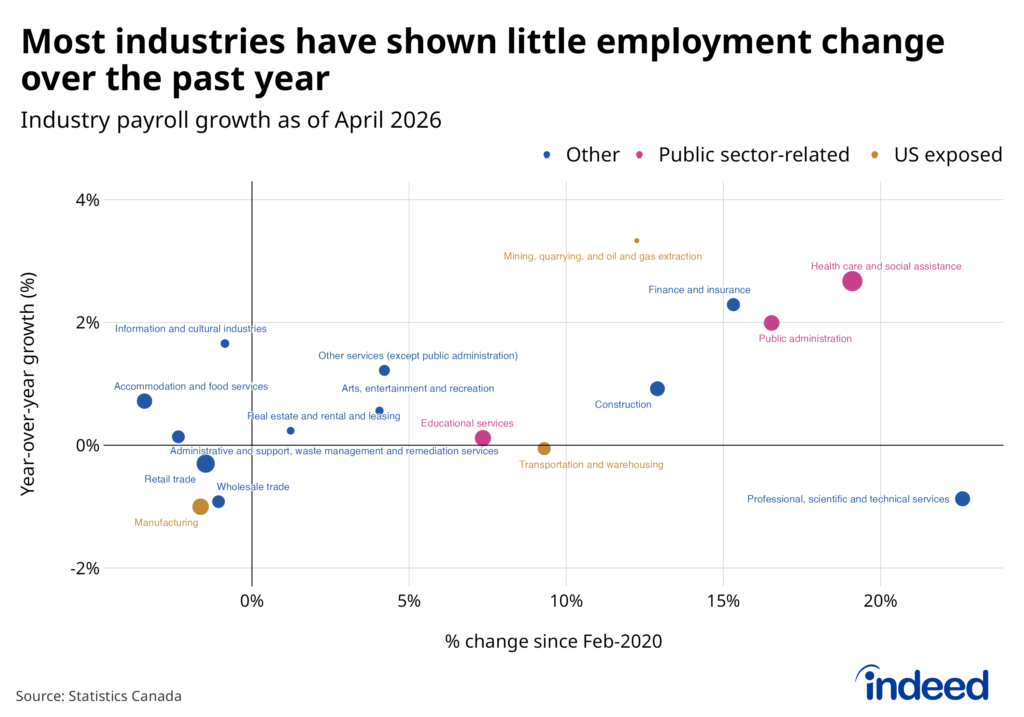
At the other end, momentum has remained solid in health care and social assistance, the latter boosted by ongoing solid employment growth in childcare services. Public administration has also continued to add jobs, with increases in municipal government employment more than offsetting declines at the federal level. Joining these public-sector-related fields with solid growth were both the financial and mining industries.
Job postings holding at their new (old) normal
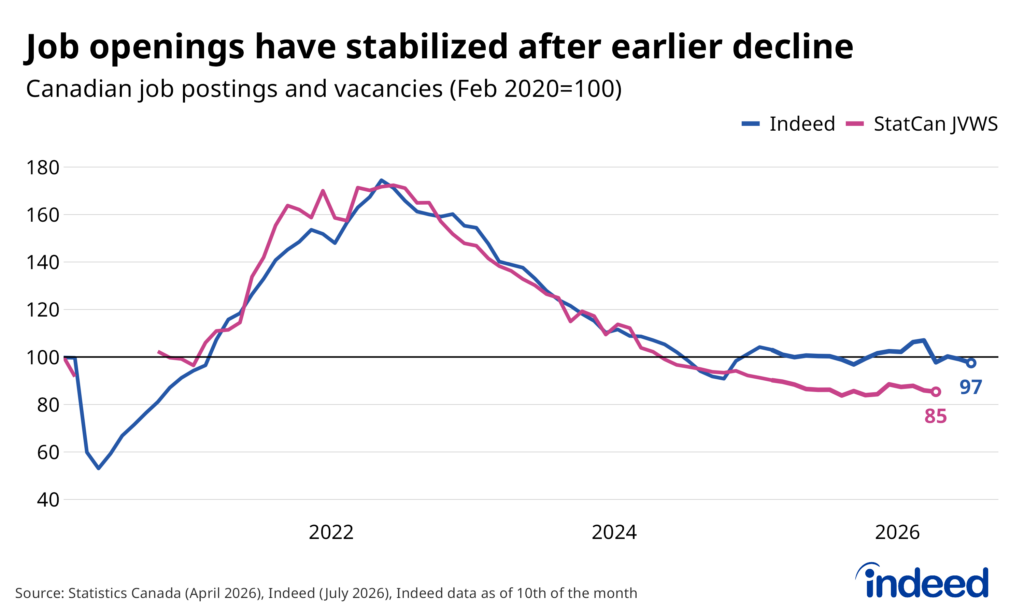
Fairly steady employer demand has helped stabilize the labour market. As of early July 2026, Canadian job postings on Indeed had slipped 4.6% since the start of the year but were still relatively flat from a year earlier (-2.8%). Job vacancies tallied by Statistics Canada’s Job Vacancy and Wage Survey (JVWS) show similar trends through April, registering a 3.4% year-over-year decline. The JVWS data is weaker relative to pre-pandemic levels than online job postings — the latter of which have been treading near their early-2020 level since 2024 — but are sending a consistent signal that demand has plateaued following its post-pandemic swoon.
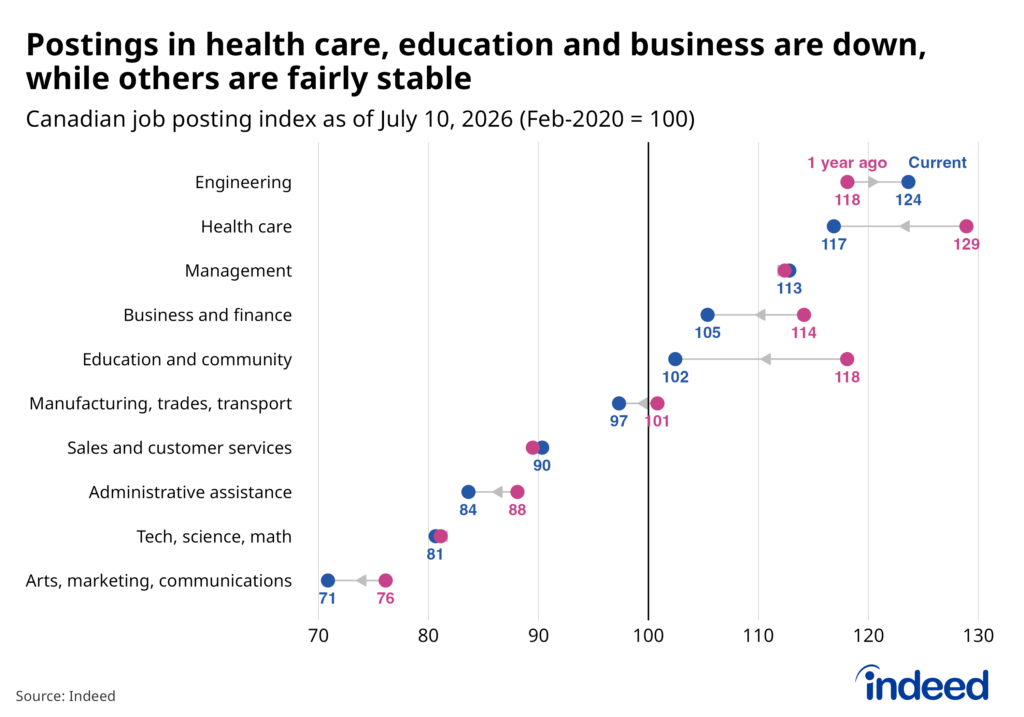
Job postings were also relatively stable over the past year in most segments of the economy, including in sales and customer services (the largest category of job postings), as well as tech occupations, both from low levels. However, some areas also showed notable pullbacks, particularly health care, education and community service, and business and finance. Postings in these fields had previously been quite elevated, and this strong demand helped maintain robust job growth, especially in health care. Fewer job postings could suggest these gains could slow going forward, but also highlight a silver lining that labour shortages in the health care sector are easing.
Wage growth cooling, while inflation has rebounded
Trends in wage growth in recent years have run counter to other labour market developments, running at a robust pace even as unemployment rose. Adjusted for changing occupation-mix, year-over-year hourly earnings growth averaged about 4% per year between 2023 and 2025, according to both the LFS and SEPH, outpacing 2.8% average inflation over the same period. One exception to this pattern was data from the Indeed posted wage tracker, which showed growth of advertised wages and salaries in job postings gradually cooling as employer demand receded.
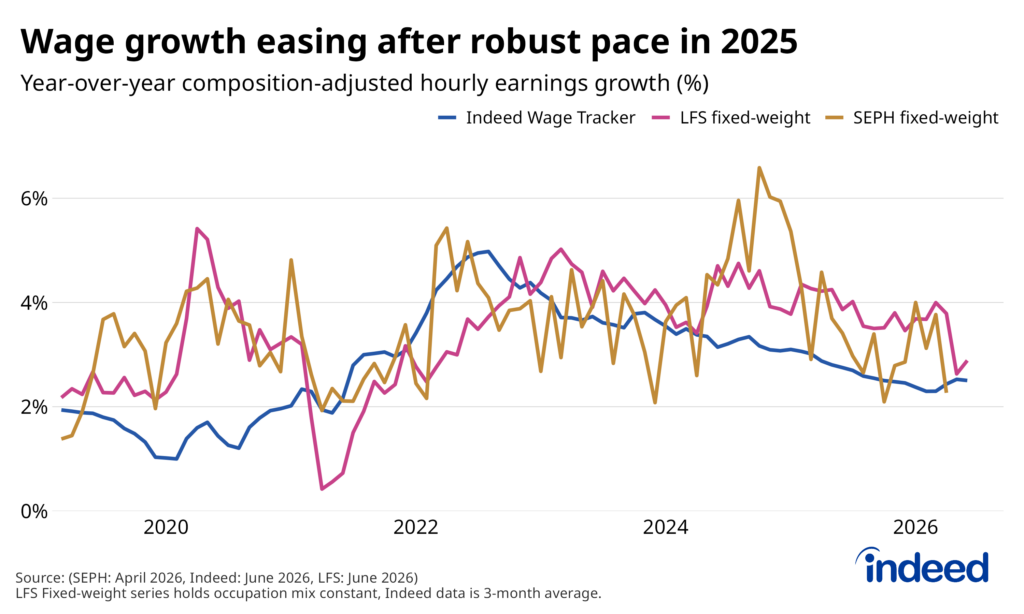
Pay growth in both Statistics Canada series has cooled off more recently. Year-over-year hourly wage growth recently slipped to 2.3% in SEPH and 2.9% in the LFS, both rising near the 2.4% pace of growth seen in June 2026 in the Indeed wage tracker. The deceleration was probably a long time coming, given soft labour market conditions and slower inflation, and until recently, this pace of pay gains was still sufficient to outpace consumer prices. However, with inflation rising above 3% as of May amid spiking energy prices and the gradual rate at which employers update their wage offerings, the purchasing power of many Canadians could take a hit in the coming months.
Employers continue to offer location flexibility
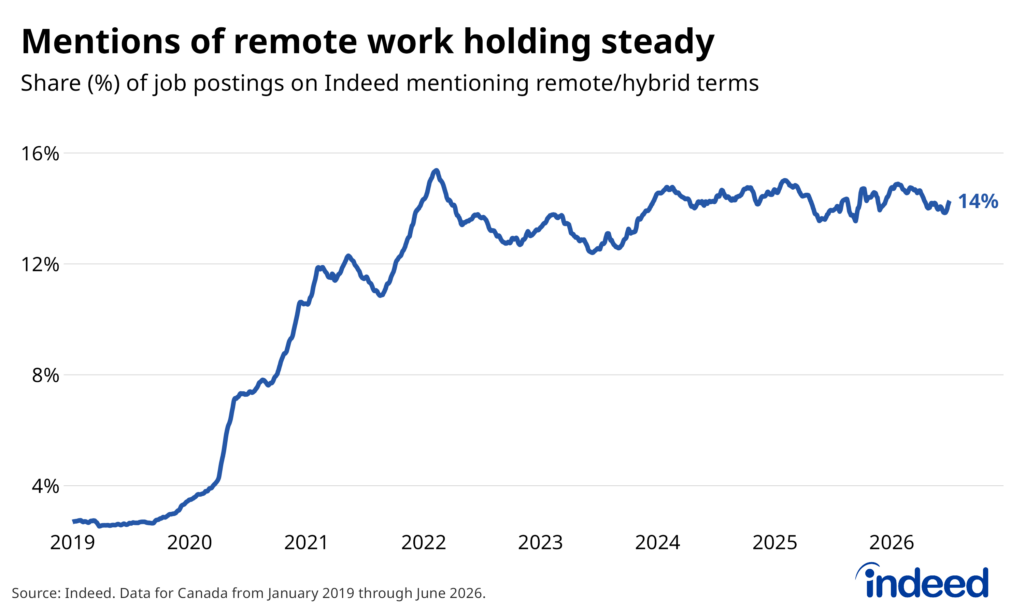
The easing of posted wage growth suggests the softer Canadian labour market has taken pressure off employers to compete as fiercely for job seeker attention. However, when it comes to offering location flexibility, there hasn’t been the same pullback. At the end of June 2026, 14% of Canadian job postings mentioned remote or hybrid-related terms in their job postings, in line with the share that has prevailed since 2022 (after an earlier pandemic spike).
Remote work has declined in recent years, but fairly gradually. According to the LFS, 21% of workers in May 2026 worked either fully remote or in hybrid schedules, still well above its 2019 level but down from 25% in 2022. The decline was concentrated in fully remote rather than hybrid work.
The ongoing prevalence of location-flexible job postings suggests the pullback in remote work will only go so far. Advertising remote work likely continues to help attract candidates: about 3.5% of Canadian job searches in June 2026 included remote-related terms, highlighting ongoing interest among job seekers. Meanwhile, more businesses are probably organized around a more location-flexible model than they used to be. Even as current employees might spend more time onsite, a steady share of new jobs will likely have some remote features.
Conclusion
Together, these trends suggest a labour market that has stabilized rather than accelerated. Employment firmed in Q2, and unemployment matched its best reading since 2024, but slower population growth means this reflects a market moving sideways rather than picking up steam. Job postings remain broadly flat, with cooling in health care and education easing prior labour shortages even as it signals softer hiring ahead.
Slowing wage growth presents a real risk: pay growth has decelerated toward the Indeed wage tracker’s more subdued pace just as inflation has climbed back above 3%, threatening to erode purchasing power gains built up over the past few years. Meanwhile, employers show little appetite to roll back location flexibility, suggesting hybrid and remote work have become structural features of the market rather than a fading pandemic-era perk.
Overall, Q2 offered welcome stability after a shaky start to the year, but unfortunately, not the kind of momentum that would meaningfully change conditions for job seekers, or ease the emerging wage-inflation squeeze.
Methodology
Data on seasonally adjusted Indeed job postings are an index of the number of job postings on a given day, using a seven-day trailing average. February 1, 2020, is our pre-pandemic baseline, so the index is set to 100 on that day. Data for several dates in 2021 and 2022 are missing and were interpolated.
Data on wage growth are the average year-on-year percentage changes in wages and salaries advertised in job postings on Indeed, controlling for job titles.
Data on remote postings are the share of remote/hybrid job postings and searches on Indeed, as a percentage of total (remote AND non-remote) job postings and searches, using a seven-day trailing average. The job location is identified as remote before a keyword search is performed on the job posting text to identify remote/hybrid jobs. The aggregate share of job postings in a specific location that included keywords associated specifically with remote, hybrid and flexible work arrangements (e.g., “remote work”, “flexible work,” and “hybrid role”) is then calculated.
The number of job postings on Indeed, whether related to paid or unpaid job solicitations, is not indicative of potential revenue or earnings of Indeed, which comprises a significant percentage of the HR Technology segment of its parent company, Recruit Holdings Co., Ltd. Job posting numbers are provided for information purposes only and should not be viewed as an indicator of performance of Indeed or Recruit. Please refer to the Recruit Holdings investor relations website and regulatory filings in Japan for more detailed information on revenue generation by Recruit’s HR Technology segment.