
Key points:
- Job growth was volatile in Q3, but on net, Canadian employment has remained roughly flat since the start of the year, while the unemployment rate continued its gradual upward trend.
- Layoff rates remained relatively modest in Q3 compared with pre-pandemic norms, but new hiring was even slower. This helps explain why the rise of the unemployment rate has been less steep but more drawn out than previous downturns.
- Employer demand remained subdued in Q3. While job postings are at or above pre-pandemic levels across much of the country, particularly in the Prairies and other less populated areas, they are down substantially in the three largest cities and other metro areas in Ontario.
- Advertised pay growth continued to slow, according to the Indeed Wage Tracker, up 2.5% year-over-year in Q3 from 2.7% in Q2. Growth of paychecks, according to Statistics Canada, also eased, though at just above 3%, was still rising faster than inflation.
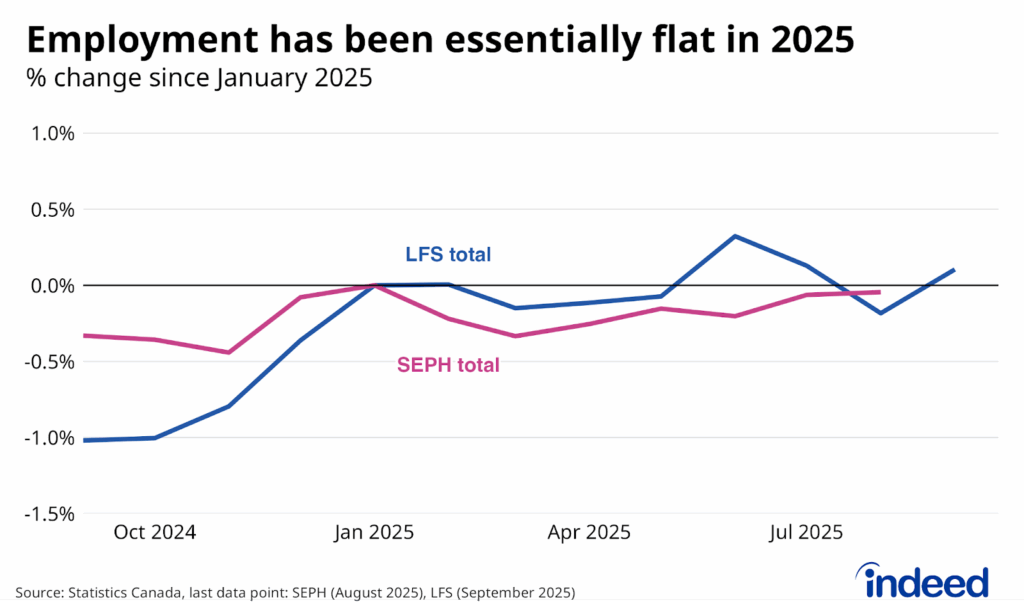
Canada’s third-quarter labour market data was murky: Monthly employment growth in the Labour Force Survey (LFS) was quite noisy, dropping by 66,000 in August before increasing by 60,000 in September. The four months through September were easily the most volatile stretch of LFS data since the pandemic, though not unprecedented compared to other points during the 2010s. Through the noise, the job numbers have been flat, with both LFS employment and payrolls in the Survey of Employment, Payrolls, and Hours (SEPH) roughly unchanged from six months earlier.
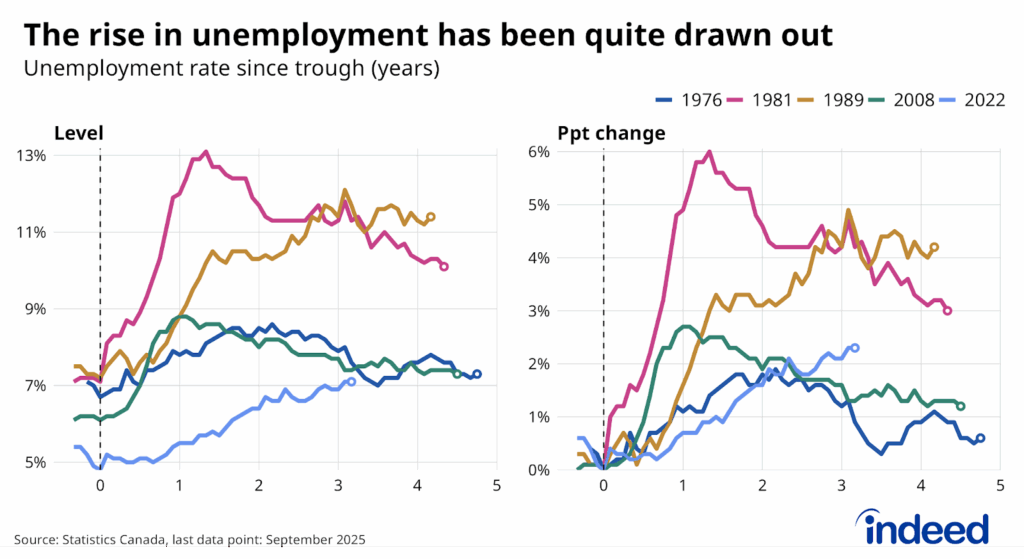
Amidst the volatile jobs numbers, the unemployment rate has been a more reliable indicator of labour market health. The trend has been consistent: The job market continues to gradually weaken. The unemployment rate stood at 7.1% in September 2025, up from 6.9% three months earlier and 6.6% one year ago.
This level isn’t particularly elevated by historic standards (it was similar in 2016 and 2004), and the pace of deterioration has been slower than during any of Canada’s four official recessions since 1976. But the duration of the downturn has been more unique during the current episode. It’s been over three years since the Canadian unemployment rate hit its post-pandemic low in 2022 (which was a record low for the modern LFS). In previous downturns (with the exception of the early 1990s), conditions were already recovering at this point in the cycle, and the unemployment rate was closer to its prior trough following both 1976 and 2008 recessions than it is today.
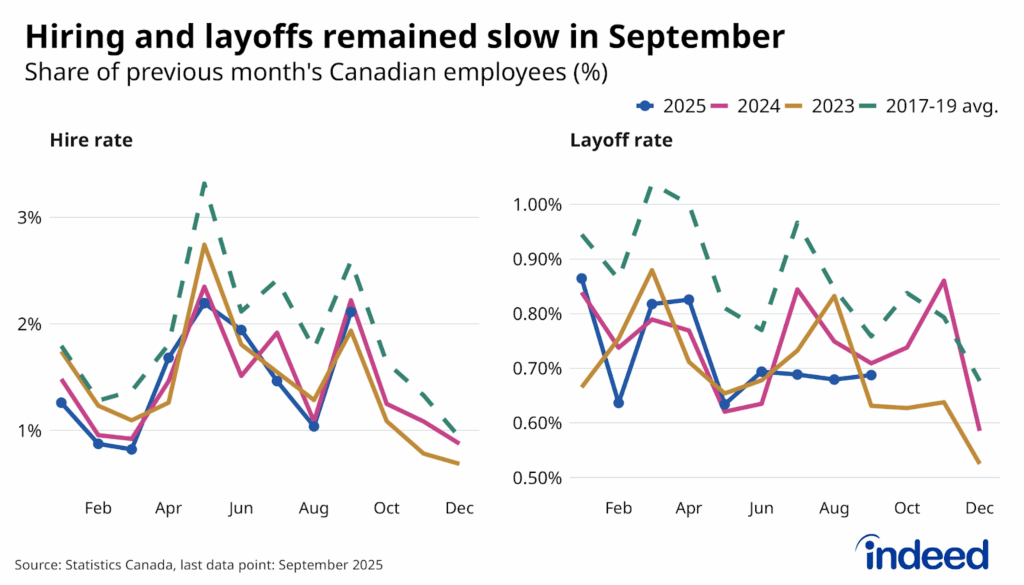
Slow hiring, rather than job losses, is the likely cause of the current slow burn. As in 2023 and 2024, the layoff rate remained below historic norms in Q3 2025 — down 20% from its 2017-2019 Q3 average. Hiring was even more subdued, down 32%. These patterns were consistent across industries: The hiring rate was not above pre-pandemic levels in any of the 21 industries tracked by Statistics Canada, and layoff rates were higher than pre-pandemic norms in only four (forestry, finance and insurance, construction, and retail trade).
Part of the slow pace of hiring reflects relatively slow job switching. On average, only 0.4% of Canadian workers changed employers per month in Q3, according to the LFS — well below the 2017-2019 norm of 0.7%. However, it’s also taking people already out of work longer to return. In September, 3.4% of Canadians aged 25-54 had been out of work for more than six months (while still wanting a job), the highest September level (outside of the pandemic) since 2012, and up from 2.6% at the same time in 2023.
Employer demand is soft, no matter how it’s measured
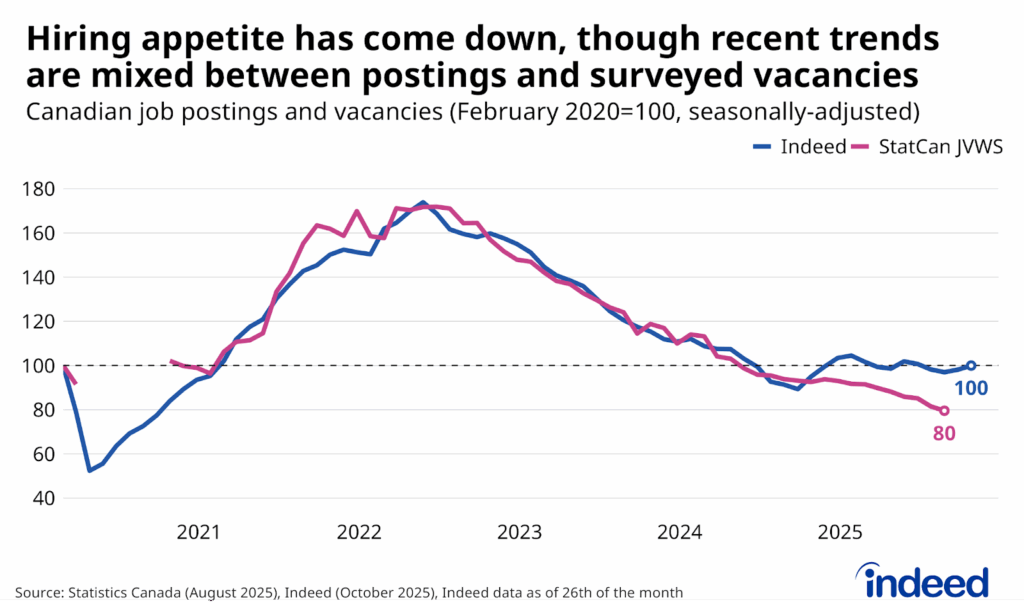
The slow pace of hiring also reflects soft employer demand. Canadian job postings on Indeed have been relatively steady in 2025, and were at their pre-pandemic level as of late October. Meanwhile, job vacancies in August 2025 were down 20% from their pre-pandemic level, according to Statistics Canada’s Job Vacancy and Wage Survey, including declines over the past year. Part, though not all, of the differences reflect different coverage of the two series (mining and education have been quite weak in the JVWS, where they have a greater weight). Where the two series are more similar are in their large declines from their 2022 peaks, postings and vacancies are down 43% and 54% since May 2022, respectively. The shift highlights how attracting workers has become much less of a constraint on business operations in recent years, but also how labour market conditions have turned against job seekers.
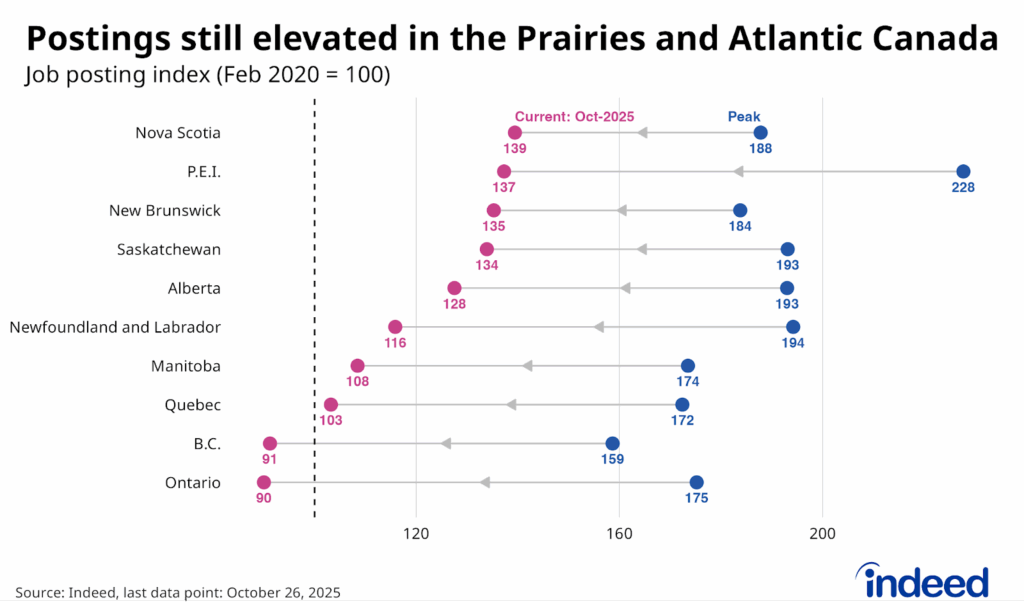
Hiring appetite has softened across the country. However, the extent to which job postings have fallen off varies by region, with two cross-cutting trends. First, across provinces, job postings in both Ontario and B.C. have declined compared to early 2020 levels. Postings in the Prairies (Alberta, Saskatchewan, and Manitoba) and Atlantic Canada remain up somewhat, while postings in Quebec are more in line with the national average, roughly at pre-pandemic levels.
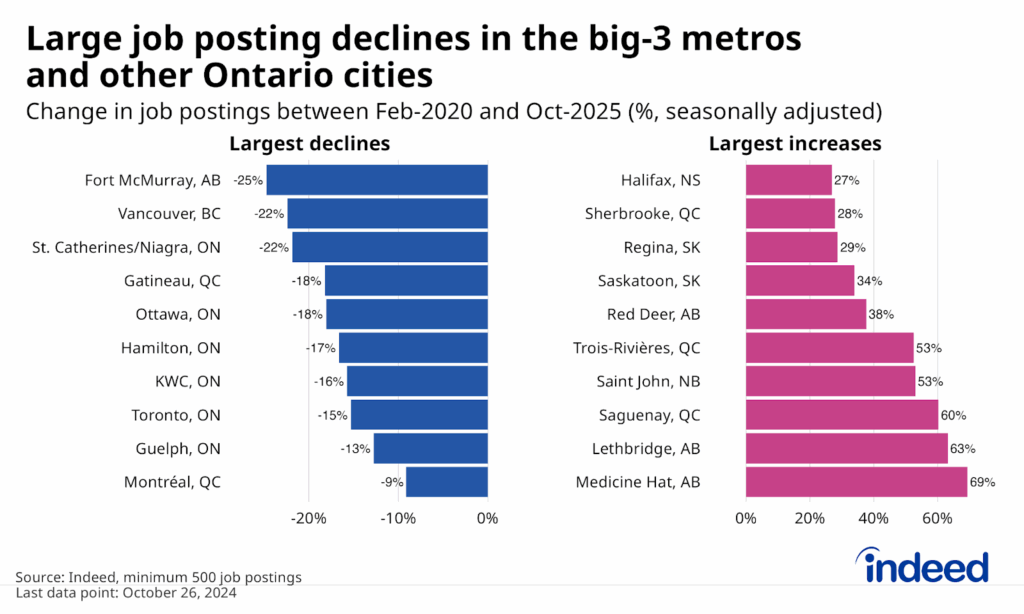
Meanwhile, within provinces, employer demand is down most in the big cities. Vancouver, Toronto, and Montreal all rank in the top 10 in terms of net posting declines since early 2020, joined primarily by other metros in Ontario, including Ottawa and Hamilton. The Calgary and Edmonton areas have fared relatively well over this period, but postings have done even better in Alberta’s smaller cities (Fort McMurray being the exception). Trends have also been relatively strong outside of the metro areas, with job postings in non-metro cities exceeding pre-pandemic levels in all provinces, marked by net increases of 15% or more in all except Ontario and Newfoundland.
There are several potential factors driving the different regional trends. Entering 2020, labour market conditions were weaker than average in the Prairies, so some of their current relative strength likely reflects a bounce-back from low levels. Meanwhile, different exposure to the current macroeconomic cycle, as well as contrasting demographics, could also explain why demand has fallen off more in some larger metros, as well as mid-sized ones in Ontario. For instance, the higher interest rate environment and slowdown in hiring for tech and other white-collar occupations has likely had a greater impact on job postings in big cities. On the other hand, aging populations in less populous regions may make demand for workers in these areas less cyclical.
Slower growth of advertised wages gradually filtering through to paychecks
The impact of the softer job market is gradually appearing in Canadian wage growth. Leading this trend has been an easing of the Indeed Wage Tracker, which tracks growth of the advertised wages and salaries in job postings. In Q3 2025, posted wages grew at an average rate of 2.5% year-over-year, down from 2.7% in Q2 and 3.5% in Q3 2023. This deceleration was widespread across occupations: Advertised annual pay growth slowed by more than 0.5 percentage points from two years earlier among 24 of the 33 job categories tracked by Indeed.

It’s taken a while, but slower growth in advertised wages is now appearing in actual paychecks. Hourly wage growth (adjusting for changes in jobs mix) has also cooled lately, according to the most recent LFS and SEPH data. Both ran at 3.1% year-over-year, down over a full percentage point from a year earlier. However, this pace still exceeds Canada’s 2.4% inflation rate in October, meaning that the purchasing power of Canadian workers continued to grow, despite softer nominal gains.
The two-track labour market continues
That inflation-adjusted wages are up over the past year, even as overall conditions have weakened, highlights the ongoing dichotomy in Canada’s labour market. Those in stable, career-track jobs have generally benefited from solid job stability and growing paychecks. Meanwhile, job seekers across a variety of circumstances are largely struggling, in some cases more than they have in years. As year-end approaches, the question remains whether a changing broader economic situation will cause the solid conditions for those stably employed, or weak conditions facing job seekers, to converge — or if the current divergence persists.
Methodology
All job postings figures in this blog post are the index of seasonally adjusted Canadian job postings on Indeed, rebased to February 1, 2020, using a seven-day trailing average.
The number of job postings on Indeed, whether related to paid or unpaid job solicitations, is not indicative of potential revenue or earnings of Indeed, which comprises a significant percentage of the HR Technology segment of its parent company, Recruit Holdings Co., Ltd. Job posting numbers are provided for information purposes only and should not be viewed as an indicator of performance of Indeed or Recruit. Please refer to the Recruit Holdings investor relations website and regulatory filings in Japan for more detailed information on revenue generation by Recruit’s HR Technology segment.
To calculate fixed-weight wage growth in the LFS, we bucket LFS microdata for each of the 43 occupation groups into three levels of job tenure (6 months or less, 7 to 24 months, and 25 months and over), and recalculate headline average wages into a composition-adjusted measure by holding their respective weights constant at February 2020 levels.