
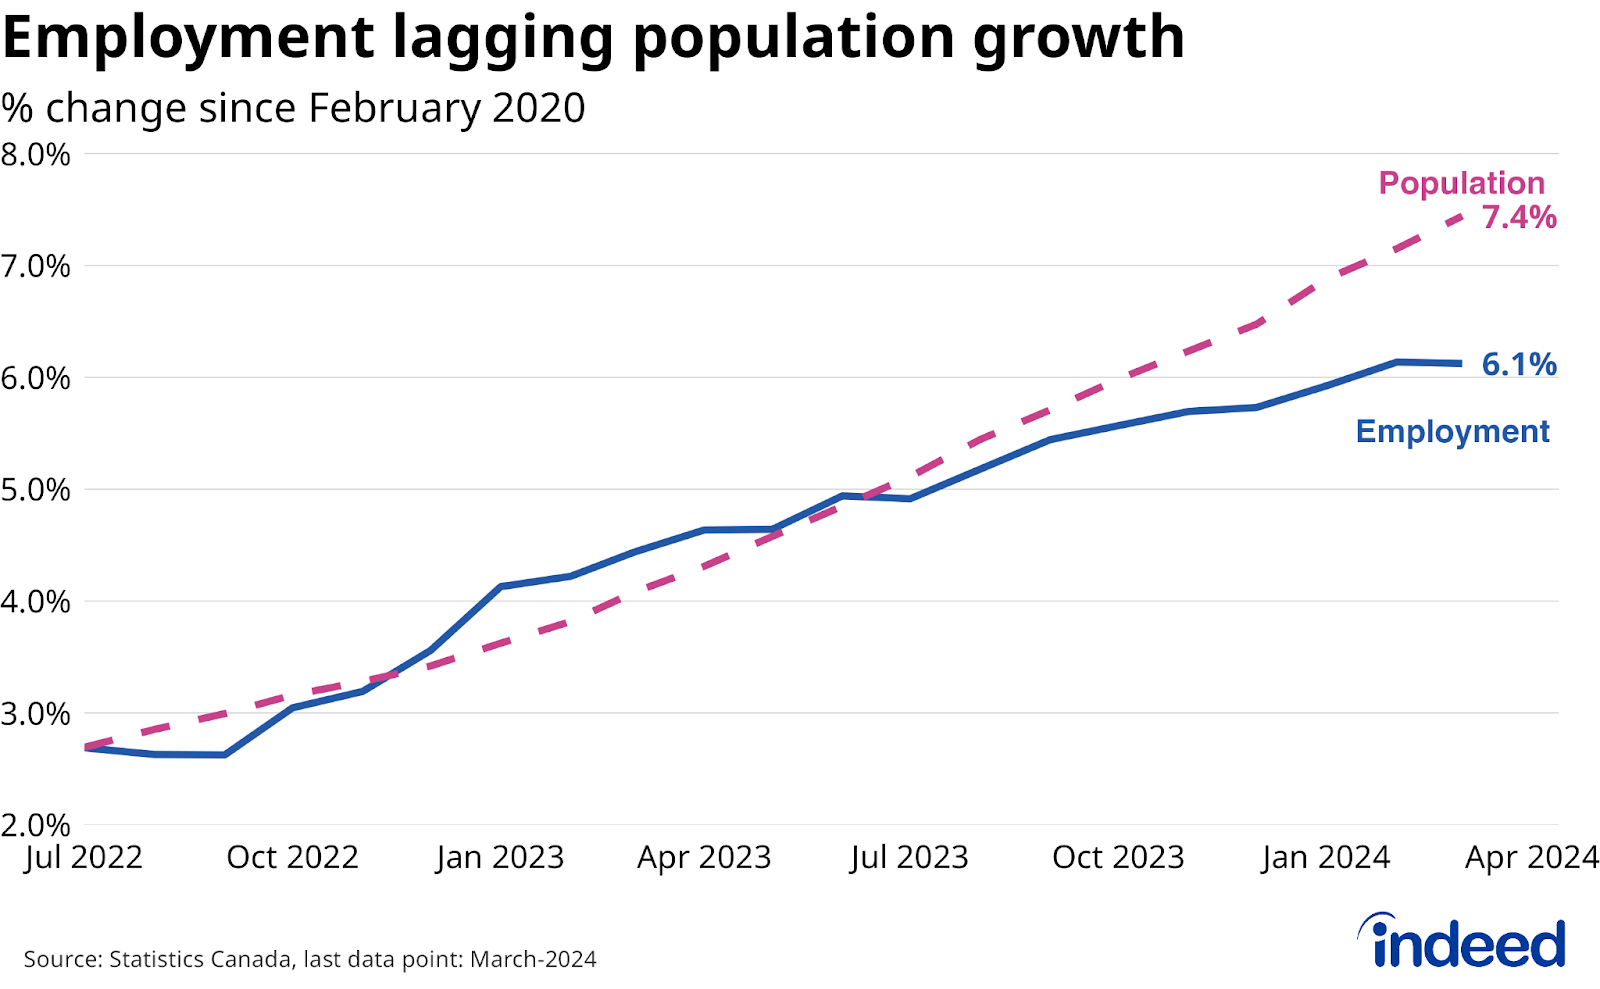
- Canadian employment rose in Q1 2024, but lagged soaring population growth, as a weak pace of hiring swamped persistently low layoff rates to push the unemployment rate above 6%.
- The softening labour market has been felt quite unevenly: the core-age employment rate has slipped modestly but remains elevated, while youth employment rates have plunged by magnitudes approaching their declines during the Great Recession.
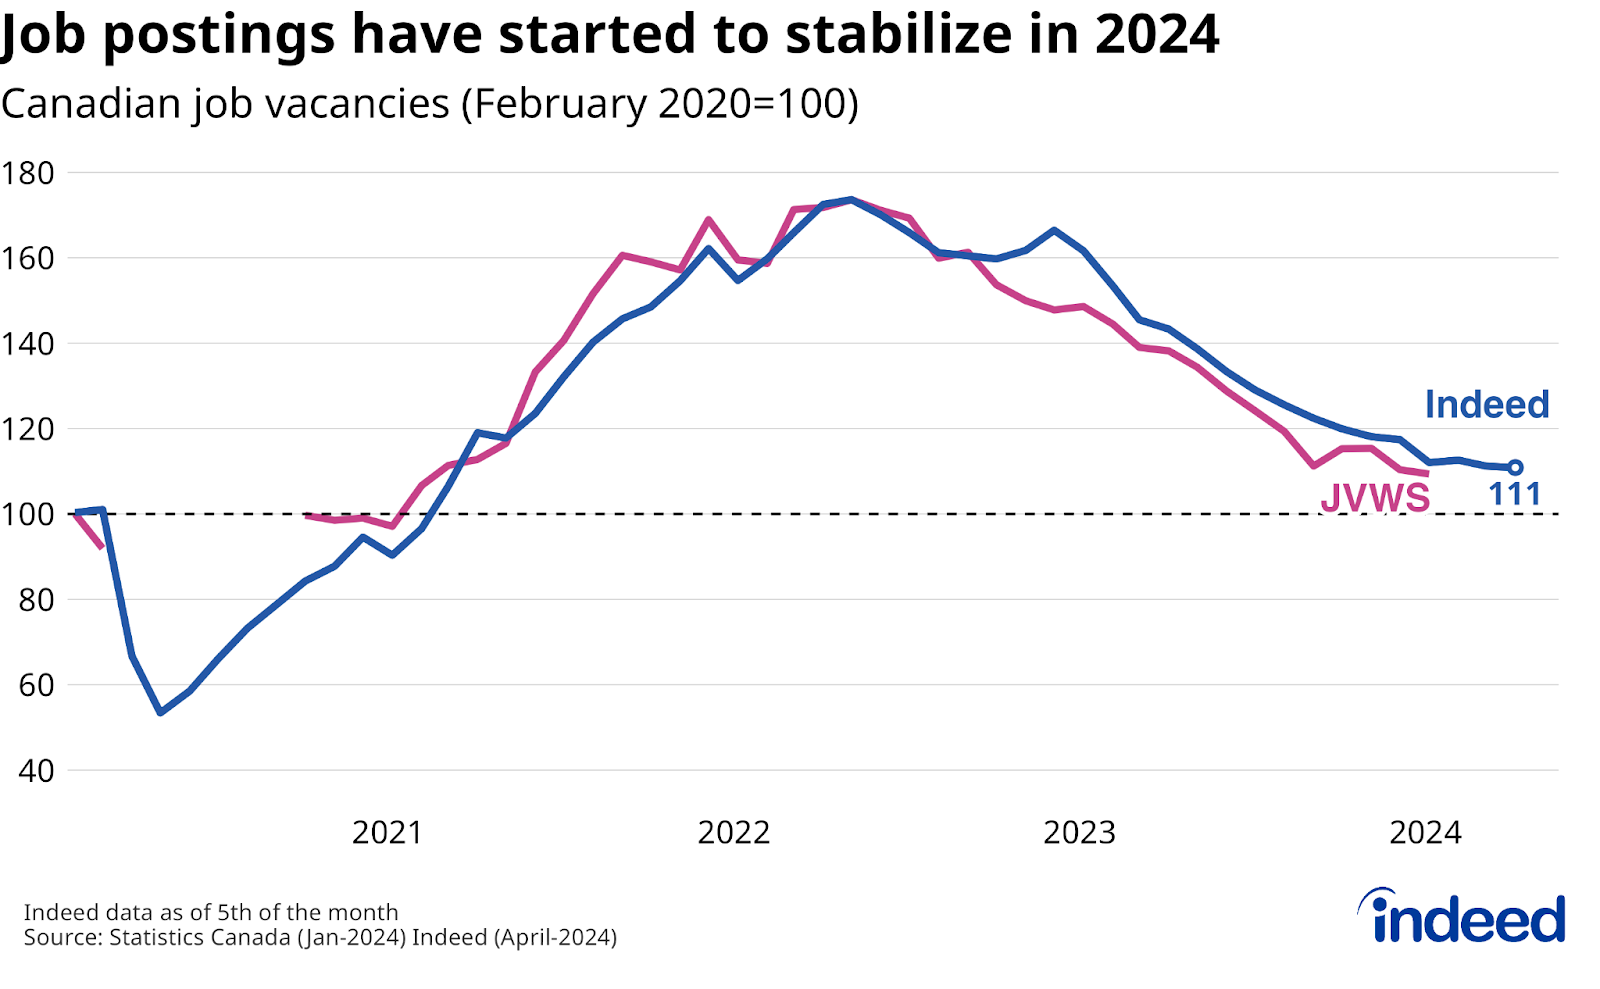
- Job postings on Indeed stabilized in Q1 after declining steadily from mid-2022 through late 2023, remaining 11% above their pre-pandemic level as of early April.
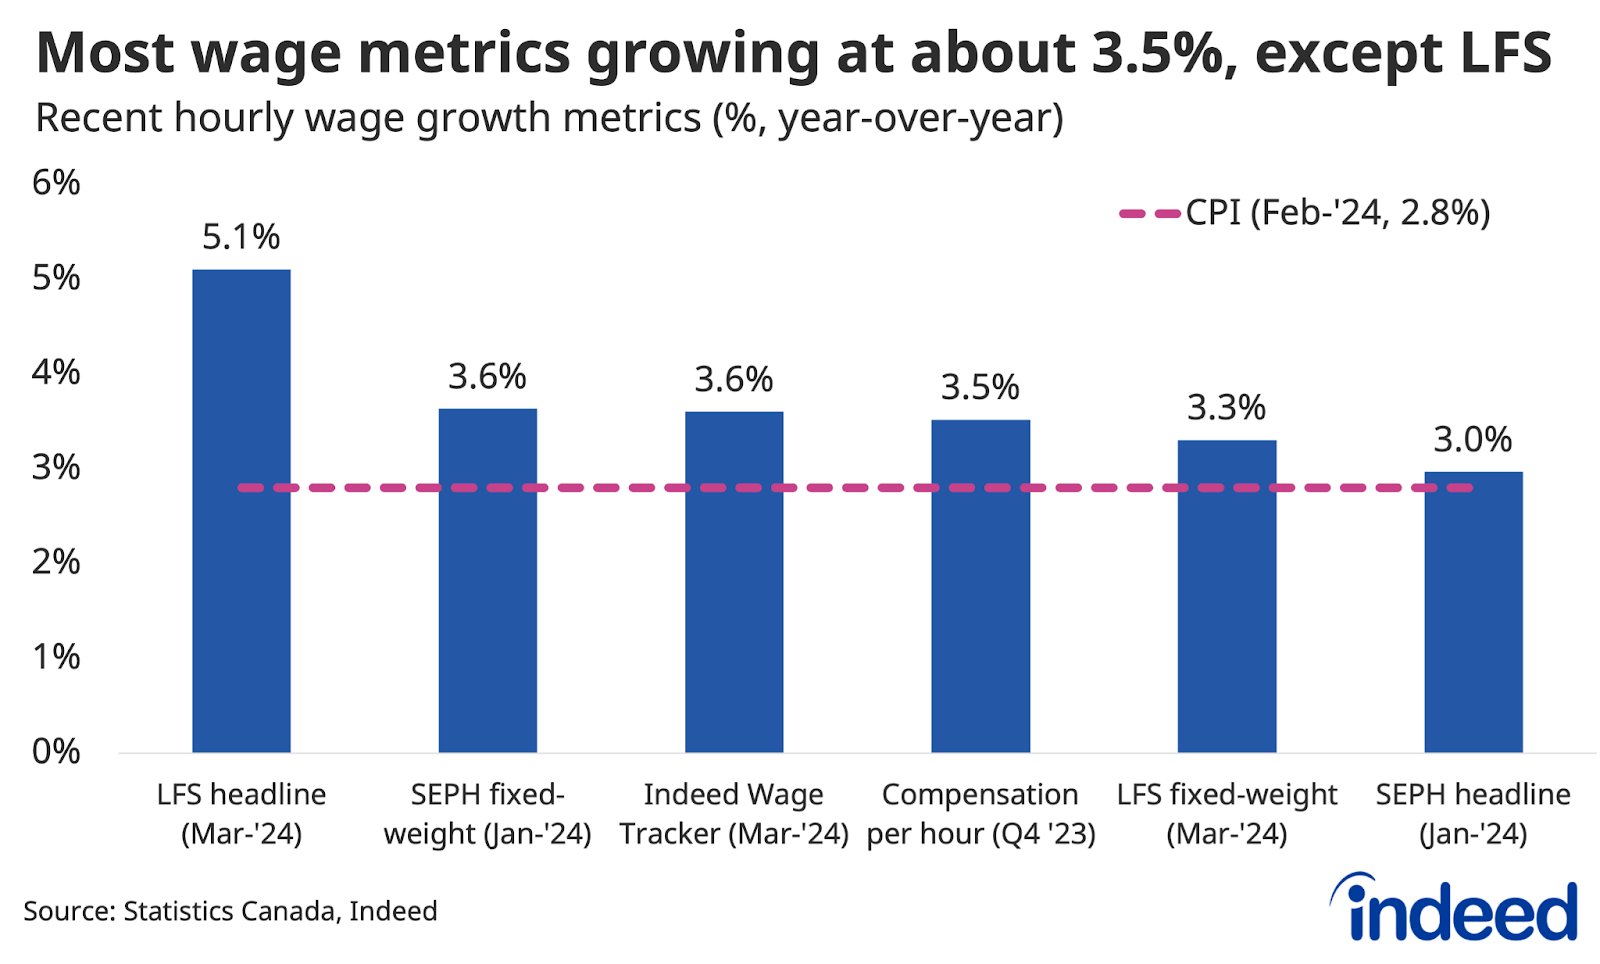
- Wage data are sending conflicting signals: the widely followed Labour Force Survey measure showed 5.1% year-over-year wage growth in March, while other measures were growing slower, including the Indeed Wage Tracker, which showed 3.6% growth in March.
Several Canadian labour market trends from the second half of 2023 continued in early 2024. In spite of a weak March Labour Force Survey (LFS), most indicators show conditions are gradually cooling to levels in line with historic norms. However, beneath the surface, outcomes have bifurcated between those who are comfortably employed, and those in more precarious situations, such as youth, who have taken a major hit amid soaring population growth and normalizing labour demand.
Employment growth as measured by the LFS averaged 25,000 over the first three months of the year, unremarkable for most periods, but dwarfed by a blistering 100,000-per-month pace of adult population growth. As a result, the employment rate ticked down an additional 0.3 percentage points since December — to 61.4% in March — after slipping 0.5 percentage points over the six months prior. Job growth was concentrated in the public sector, another pattern similar to late 2023.
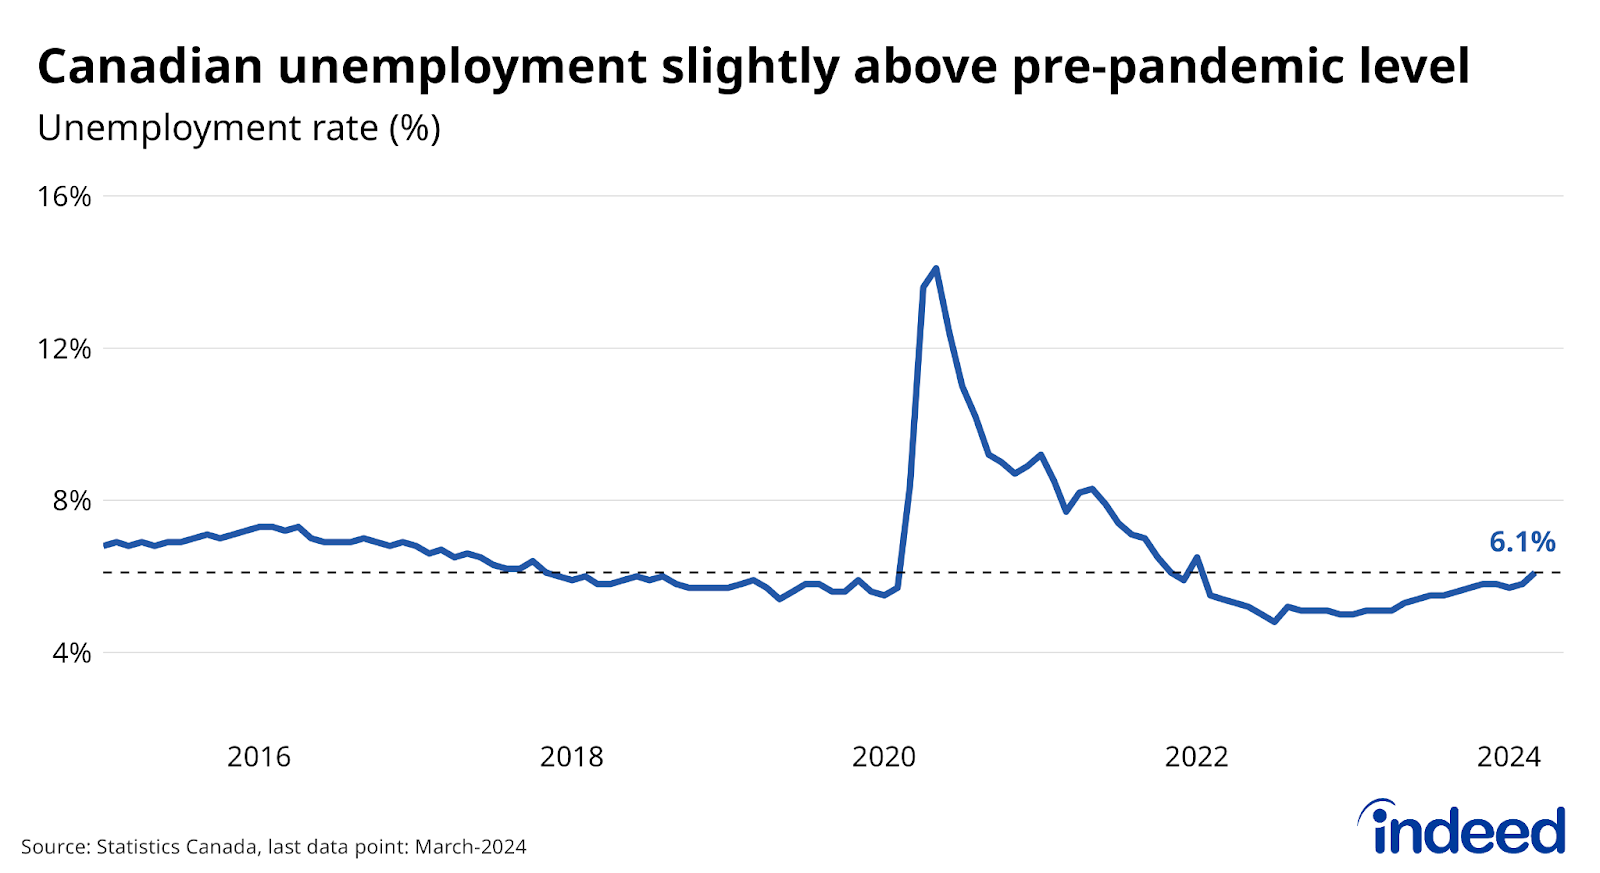
Despite employment lagging the soaring population growth, the labour market, on the whole, is in decent shape, at least for now. The unemployment rate rose over the past year, hitting 6.1% in March, slightly exceeding its pre-pandemic level, but not elevated by historic standards. Other aspects of labour underutilization, such as workers employed in part-time jobs due to economic reasons, are even lower than the jobless rate itself when compared to earlier periods. The question ahead is how high will the unemployment rate reach as the year proceeds.
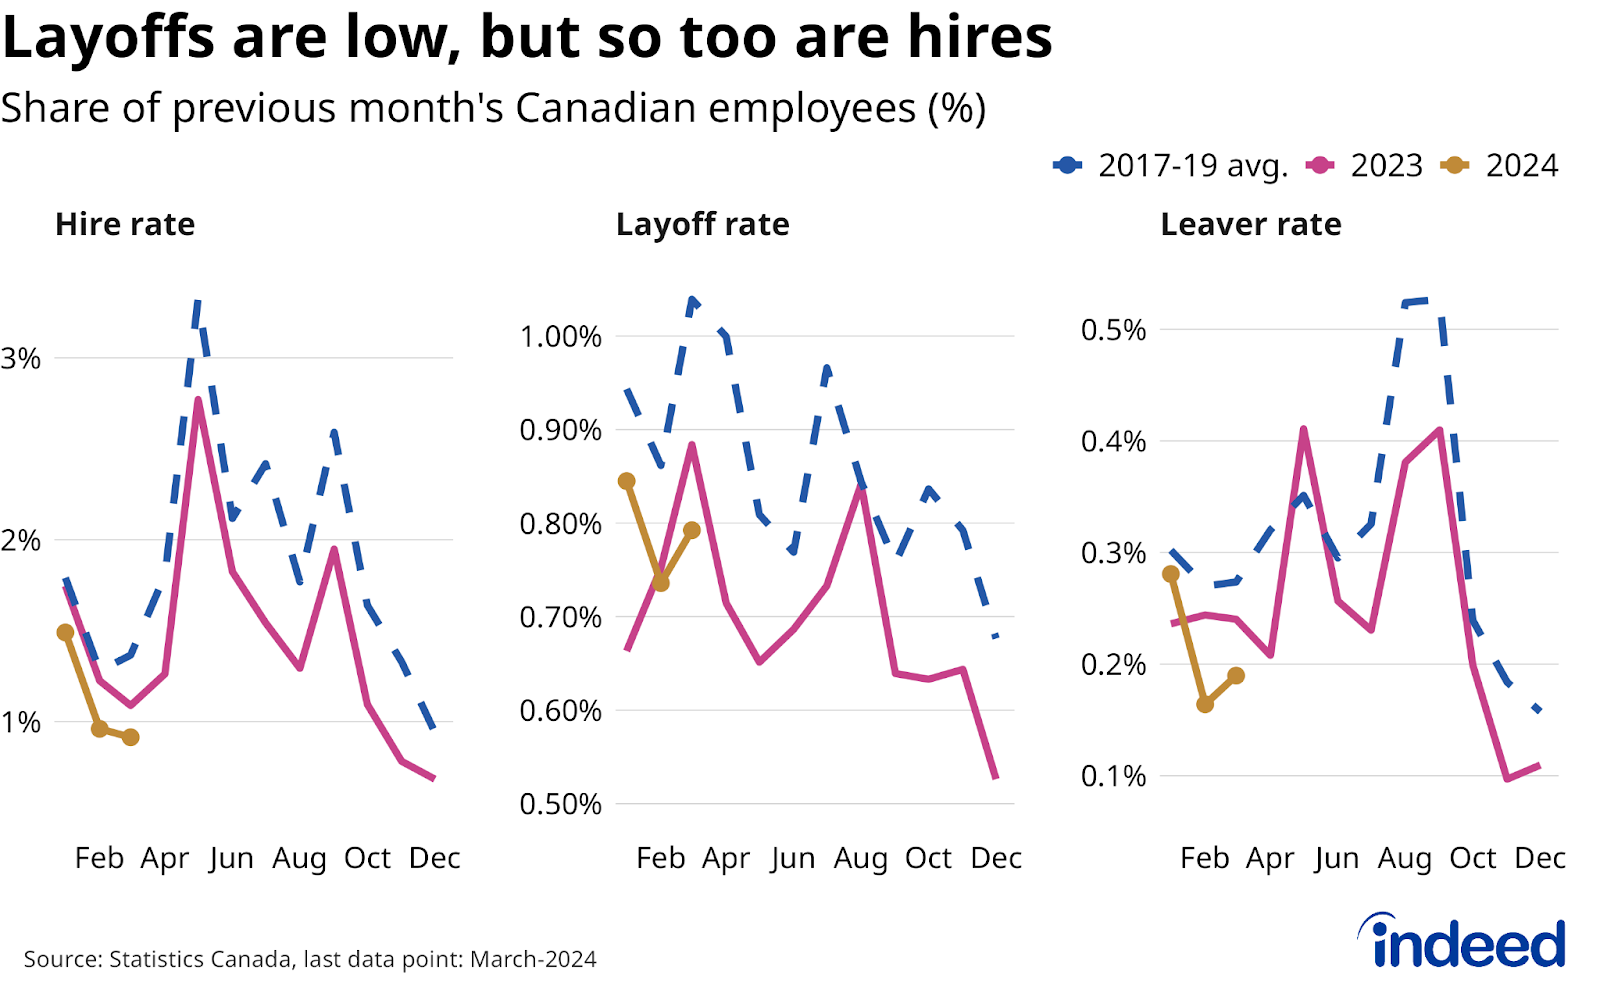
The overall labour market cooldown has been gradual because relatively few Canadians have lost or have left their jobs to start 2024. The national layoff rate averaged 0.8% through the first three months, 17% below its usual 2017-2019 Q1 level, while the leaver rate (the share of workers who voluntarily left their job to non-employment) was down 25%, at 0.2%. Instead, hiring has been weak. The number of new jobs started as a share of prior month’s employment (which includes both job switches and people entering work) averaged 1.1% in Q1, 24% below its pre-pandemic average.
Youth increasingly shut out of the job market
The combination of few layoffs and low hiring has created a growing gap between the trajectories of those who are comfortably employed and those who are not. This divide is most evident across age groups.
Youth employment rates have plunged over the past year. In March 2024, just 40.1% of teens were employed, down 5.5 percentage points from a year earlier. Meanwhile, the share of those in their early twenties (aged 20-24) with a job was 67.8%, down 3.7 percentage points year-over-year. Both declines aren’t far off from the drops each group experienced during the 2008-2009 recession. In contrast, the core-age (25-54-year-old) employment rate slipped a more modest 0.7 percentage points over the year to 84.2% through March 2024, — still above its pre-pandemic level.
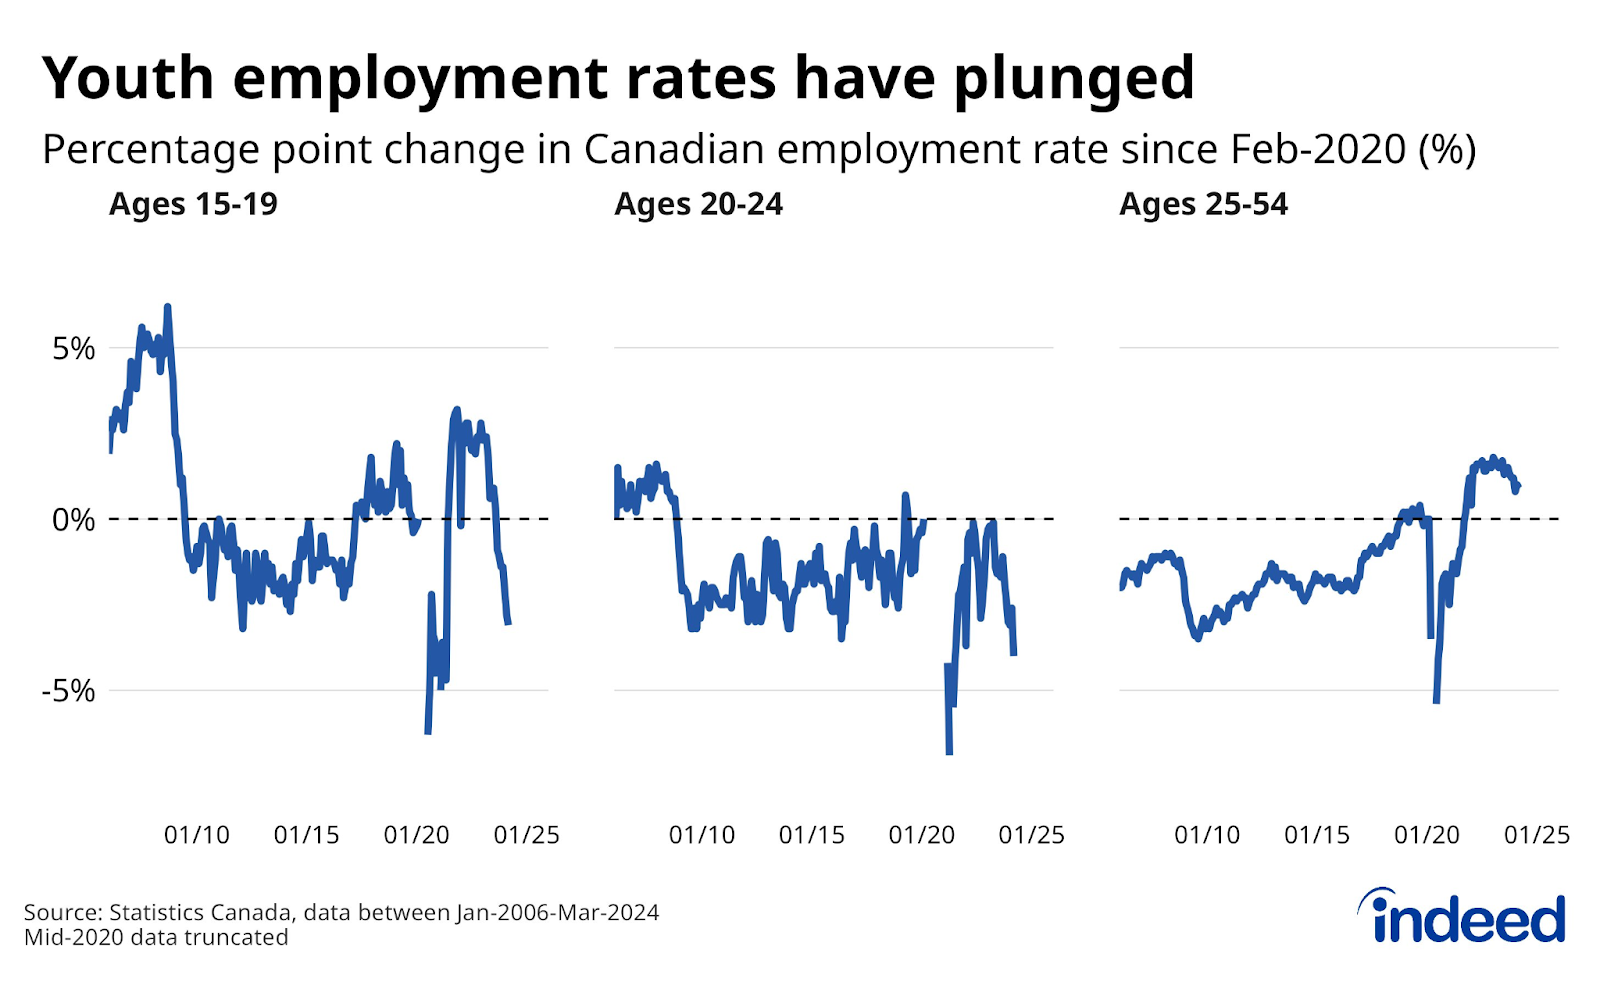
The drop in youth employment rates has been fairly sudden, suggesting shifts in school attachment were unlikely the main driver. Before the recent plunge, teenage employment rates were actually at their highest level in more than a decade. Instead, it likely reflects both fewer job opportunities as employers have scaled back recruiting, combined with greater competition from soaring population growth from abroad, including many newcomers who are in their early twenties themselves. These dynamics appear to have impacted some groups of older workers too, as employment rates among core-age Black and South Asian Canadians have also slipped over the past year.
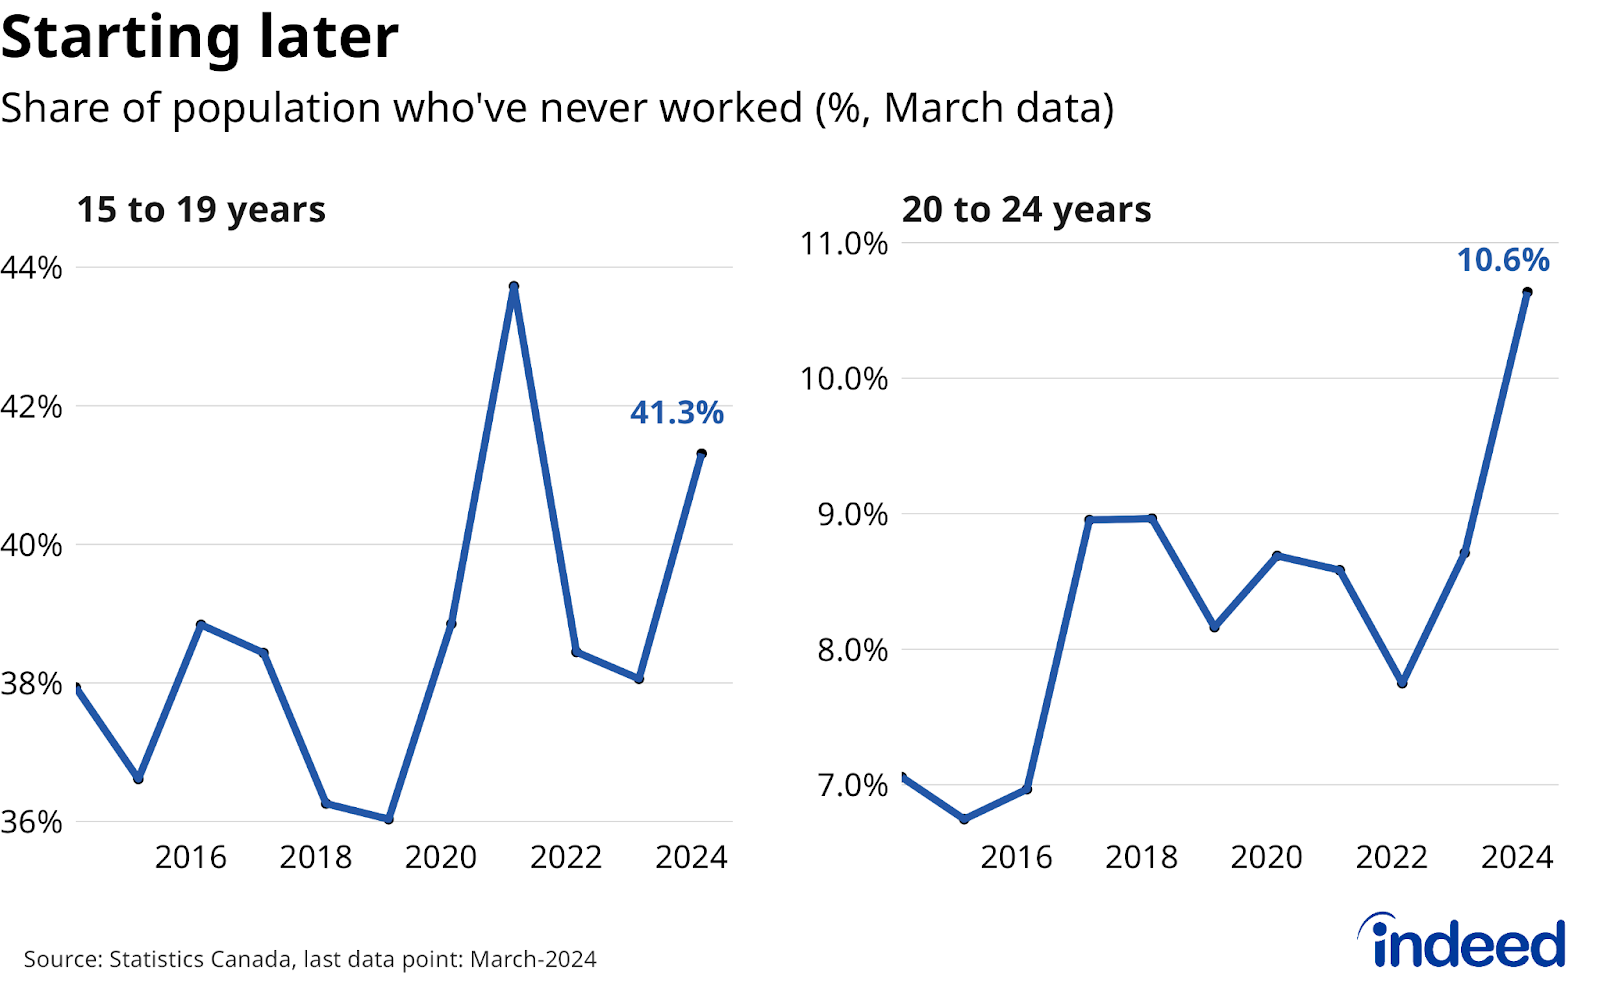
One of the byproducts of the deteriorating youth labour market has been that the share of teens and early twenties who had never worked before each hit recent March highs (excluding one pandemic-impacted year among teens), jumping 3.3 and 1.9 percentage points over the past year to 41.3% and 10.6%, respectively. The upcoming summer job season, which traditionally starts in May, will offer a chance for rebound, but only if broader economic conditions cooperate.
Job vacancy decline slows after sliding for a year and a half
Slow hiring has been a key component of the broader labour market weakness, but recent trends suggest the steady decline in employer demand could be hitting a plateau. Canadian job postings on Indeed fell 30% over the course of 2023, matching the 26% drop recorded in Statistics Canada’s Job Vacancy and Wage Survey (JVWS). But that decline appears to have paused in early 2024, with postings holding steady since mid-January, remaining 11% above their pre-pandemic level as of April 5. If this stabilization in employer demand holds, it should help the employment situation avoid falling off the rails in 2024.
The pandemic-era rise— and subsequent fall — in Canadian job postings have both been broad-based across sectors. In late 2022, job postings exceeded their February 2020 levels by at least 50% in nearly 80% of the 56 occupational sectors we track on Indeed. By March 2024, that share was down to just 11%, a reflection of still-elevated demand for workers in a few health care and engineering fields.
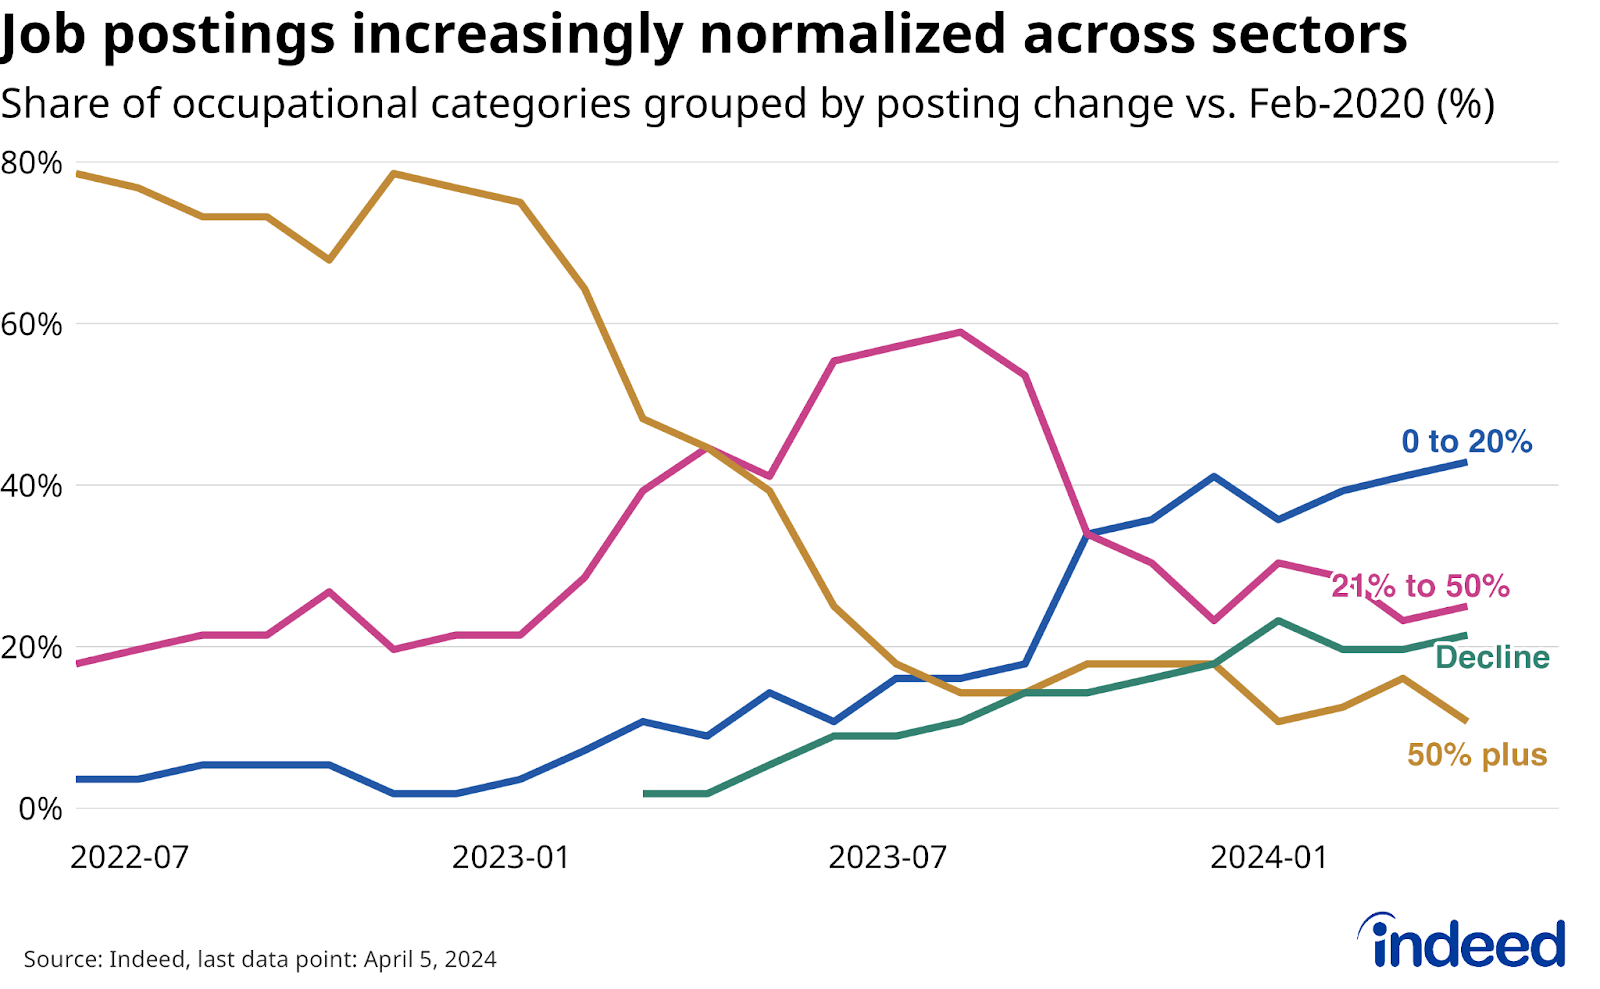
Meanwhile, job postings in 43% of occupations are now up modestly (between 0 and 20% growth) from their early 2020 levels, spanning retail, manufacturing, and administrative assistance. The ranks of this category have grown more than the 21% of occupations in which postings have slipped below pre-pandemic levels, including several tech fields, sales and marketing. That most areas haven’t fully retreated from their earlier highs is consistent with the normalization, rather than plunge, seen in economy-wide job postings since mid-2022.
Most wage growth metrics have slipped below 4%, except the widely followed LFS headline
The Canadian labour market might have loosened in 2023, but nominal wage growth was still elevated for most of the year. But whether that strong growth has persisted through early 2024 depends on the data source.
The most widely followed wage growth metric ⸺ average hourly earnings as reported by the LFS ⸺ remained elevated through March, at 5.1% year-over-year. However, other data points suggest a more modest pace, including paychecks tallied in the Survey of Employment Payrolls and Hours (SEPH), which recorded growth of between 3.0% and 3.6% in January. The Indeed Wage Tracker, which tracks growth of advertised wages and salaries in job postings, was also in this lower range, running at 3.6% in March.
Most measures of wage growth are still outpacing inflation to some extent, which is good news for household pocketbooks. But which metric is more accurate has implications for both the health of Canadian paychecks, as well as Bank of Canada policy ahead. The higher headline LFS reading would be a welcome sign that household purchasing power was meaningfully rebounding following the earlier jump in inflation. But the strong pace could also be a risk that prices continue rising quickly, potentially forcing the Bank of Canada to maintain rates higher for longer. Conversely, softer alternative wage readings might help bring inflation to heel, but could also suggest a weaker current economic situation facing Canadian households.
Methodology
All job postings figures in this blog post are the index of seasonally-adjusted Canadian job postings on Indeed re-based to February 1, 2020, using a seven-day trailing average. February 1, 2020, is our pre-pandemic baseline. We seasonally adjust each series based on historical patterns in 2017, 2018, and 2019. Each series, including the national trend, occupational sectors, and sub-national geographies, is seasonally adjusted separately. This week, we applied our quarterly revision, which updates seasonal factors and fixes data anomalies. Historical numbers have been revised and may differ from originally reported values. New job postings are posts that are seven days old or less.
The number of job postings on Indeed, whether related to paid or unpaid job solicitations, is not indicative of potential revenue or earnings of Indeed, which comprises a significant percentage of the HR Technology segment of its parent company, Recruit Holdings Co., Ltd. Job posting numbers are provided for information purposes only and should not be viewed as an indicator of performance of Indeed or Recruit. Please refer to the Recruit Holdings investor relations website and regulatory filings in Japan for more detailed information on revenue generation by Recruit’s HR Technology segment.
To calculate fixed-weight wage growth in the LFS, we bucket LFS microdata for each of the 43 occupation groups into three levels of job tenure (6 months or less, 7 to 24 months, and 25 months and over), and recalculate headline average wages into a composition-adjusted measure by holding their respective weights constant at February 2020 levels. For more information on how we assessed the exposure of different occupations to generative artificial intelligence, please refer to the methodology note.
Data on rates of layoffs, job leavers, and hires, the share of young workers who had never worked, as well as LFS fixed-weight wages were calculated using the LFS public use microfiles.