Key Points:
- Job postings are still elevated but have declined over the first three months of 2023, with especially sharp drops from a year earlier in metros like Toronto and Vancouver, partly because they have been disproportionately impacted by falling white collar job postings.
- Meanwhile, the Canadian labour market fared well through February, as the unemployment rate stayed low, and the working-age employment rate hit new highs, led by contributions from university educated women and mothers with young children.
- Low layoff rates continue to support employment levels, while the number of new hires has held up in 2023 despite the drop in employer hiring appetite.
- Both employment and the pace of wage growth point to ongoing strength, but if the economic conditions causing the slide in job postings continue, the situation will likely turn.
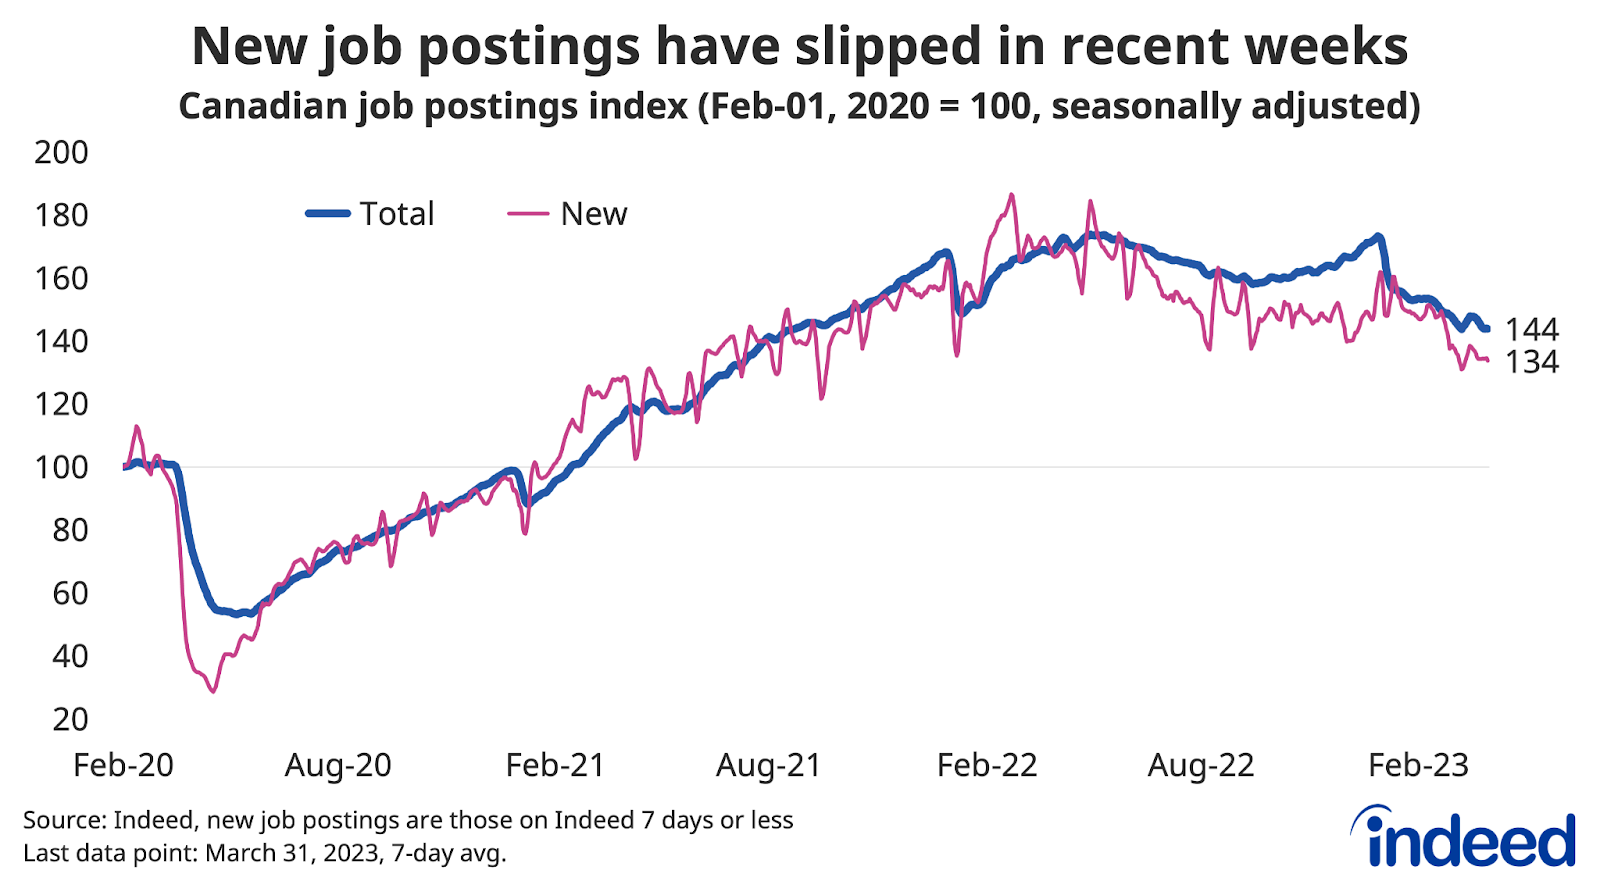
The overall Canadian labor market remained on solid footing through the first two months of 2023, with the working-age employment rate rising to a record high in January, boosted in part by relatively low layoff rates. At the same time, while job postings remain higher than pre-pandemic norms, they have slipped over the past year, including since the start of the year.
As of March 31st, total Canadian job postings on Indeed were down 15% from a year earlier, though still 44% above their pre-pandemic level. New job postings also remained above pre-pandemic levels, but have fallen off from earlier in 2023 and were down 20% from last March, suggesting the slide in total postings could continue.
Hiring appetite has cooled across much of the country, but the steepest drop has been in several regions particularly sensitive to tech and other white collar occupations, jobs for which posting trends have been especially weak. Postings in Kitchener-Waterloo-Cambridge, Toronto, and Vancouver were all down more than 24% year-over-year in late March. All three began the period with relatively high concentrations of white collar job postings.
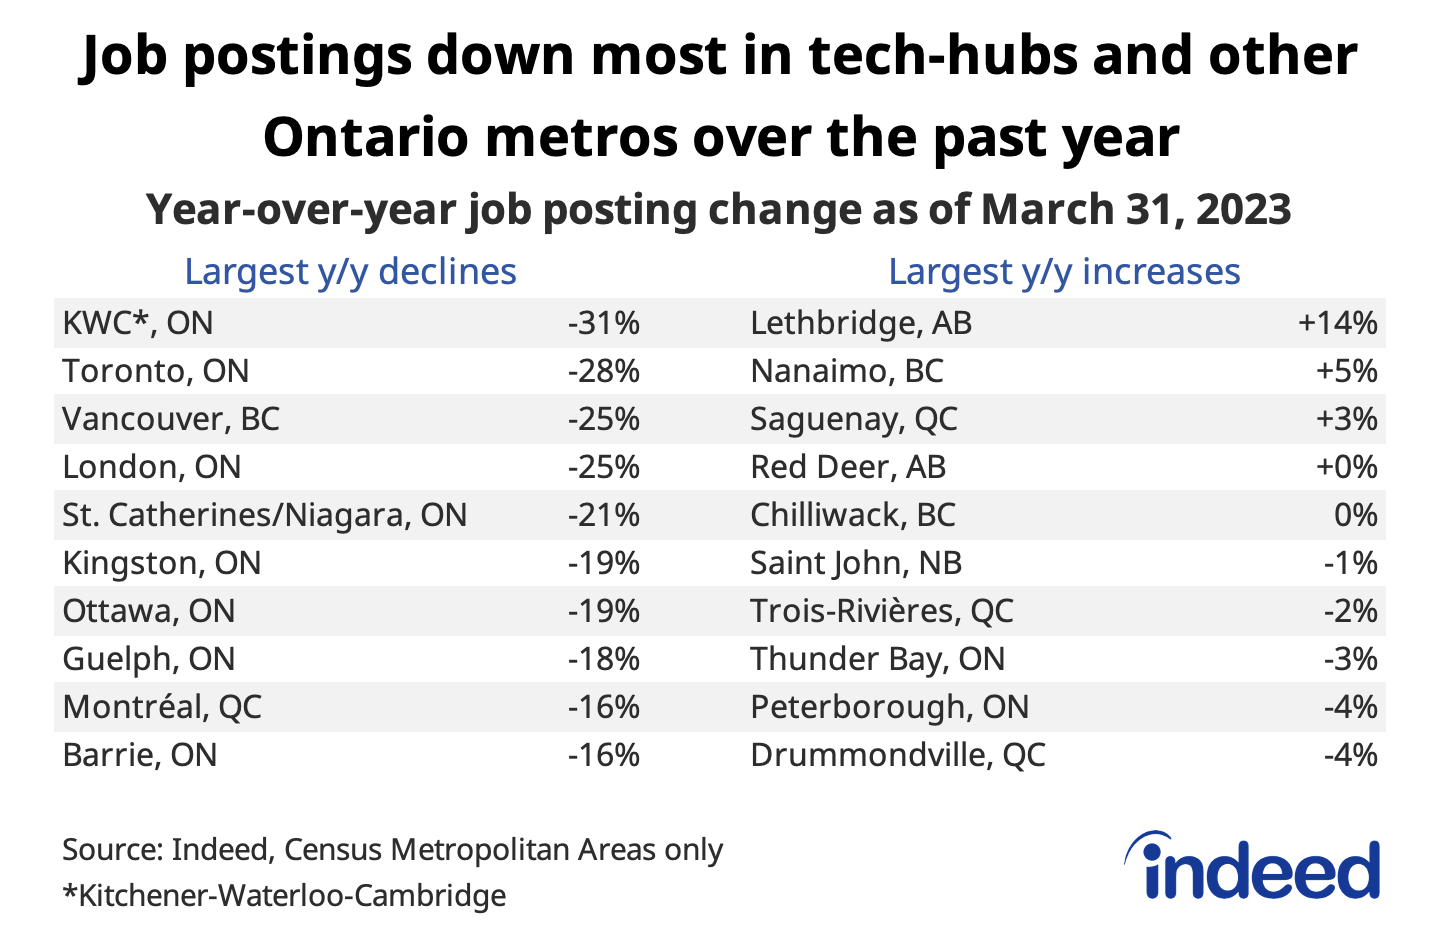
Postings in metros elsewhere in Southern Ontario have also been on the weaker side, with centres such as London, St. Catharines-Niagara, and Kingston down more than 19% from last March. Conversely, job postings were relatively flat compared to last March in a range of smaller cities across several provinces.
Greater exposure to white collar occupations wasn’t the only driver of outsized declines in tech hubs like Toronto and Vancouver. Job postings in non-white collar sectors in both tech hubs and other weak Ontario cities were also down more, compared to metros in the rest of Canada.
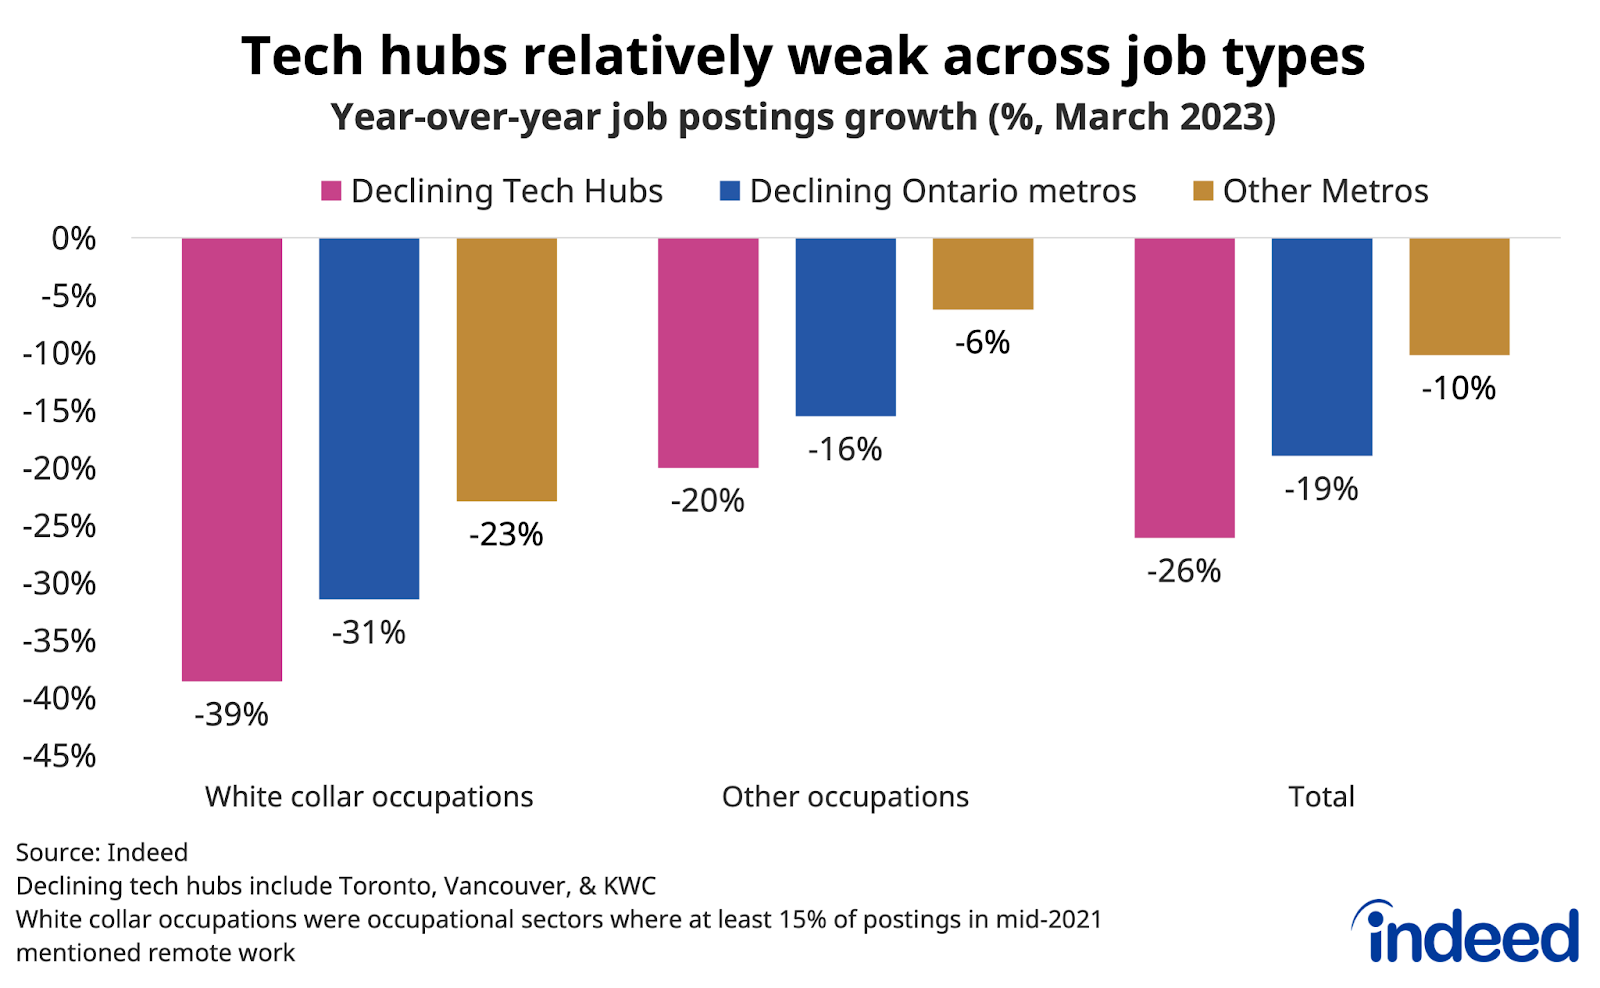
One potential contributor to this outsized weakness could be that spillovers associated with declining home prices may have hit labour demand harder in Toronto and Vancouver—and surrounding areas—than elsewhere. Job postings in real estate, construction, and sales are down more year-over-year in both cities than other regions, though trends have also been relatively weak in less cyclically-sensitive sectors like education, and in the case of Toronto, health care. Meanwhile, some of the smaller markets where postings have held up over the past year could have a degree of insulation from trends elsewhere, at least for now.
Canadian labour market continued to chug along
Despite waning employer demand, the Canadian labour market has remained strong overall. Employment in the Labour Force Survey (LFS) started 2023 with a bang in January, followed by modest growth in February. The lagged Survey of Employment, Payrolls and Hours (SEPH) confirmed that momentum remained positive through January.
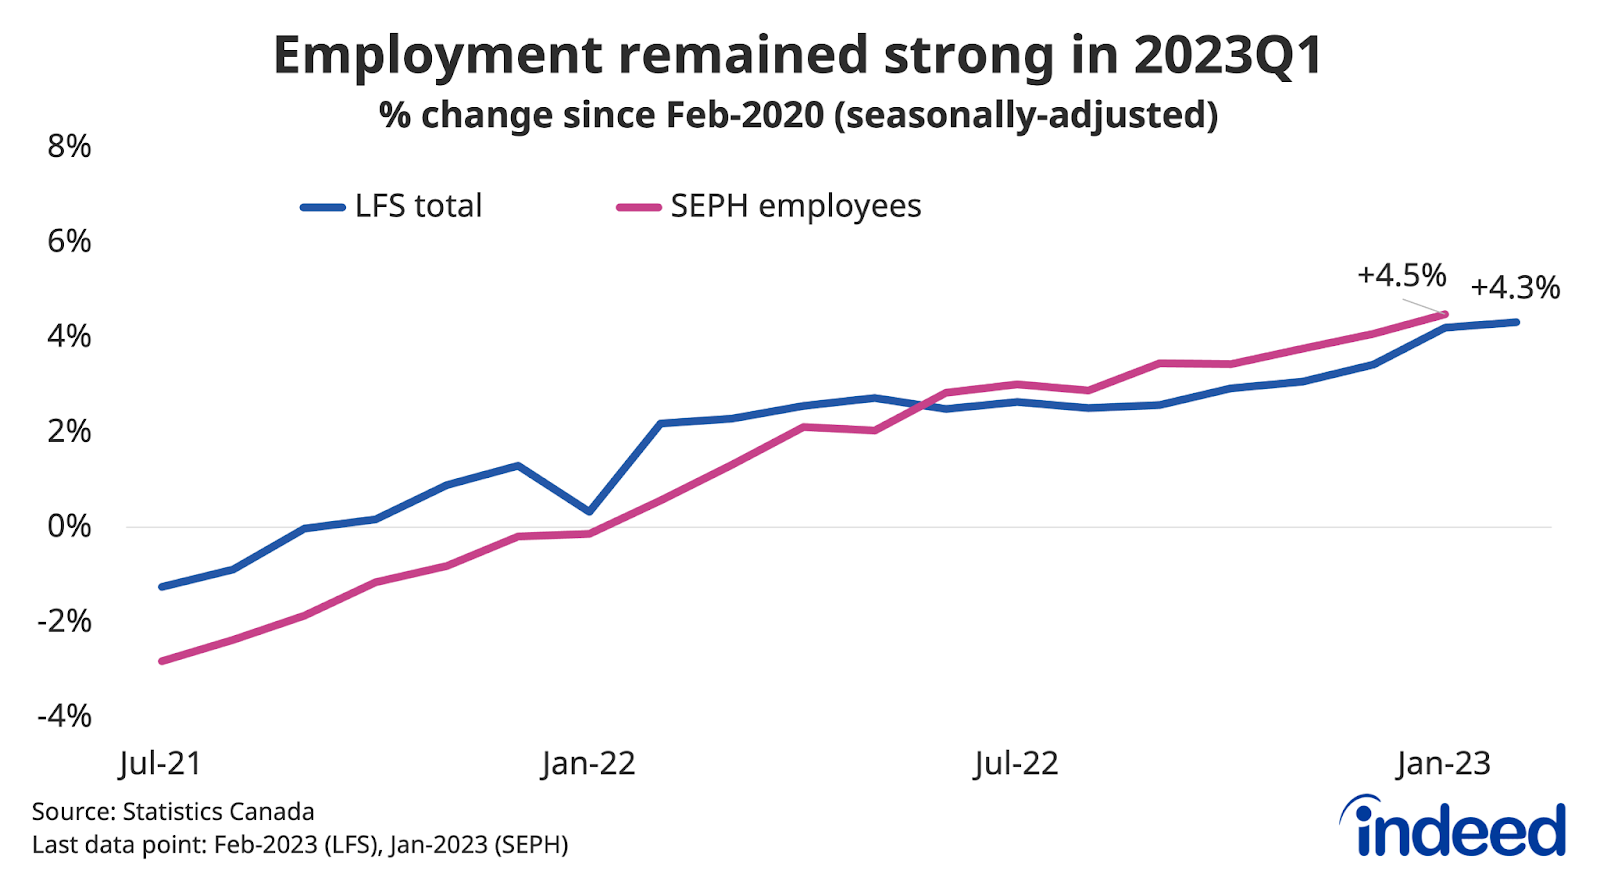
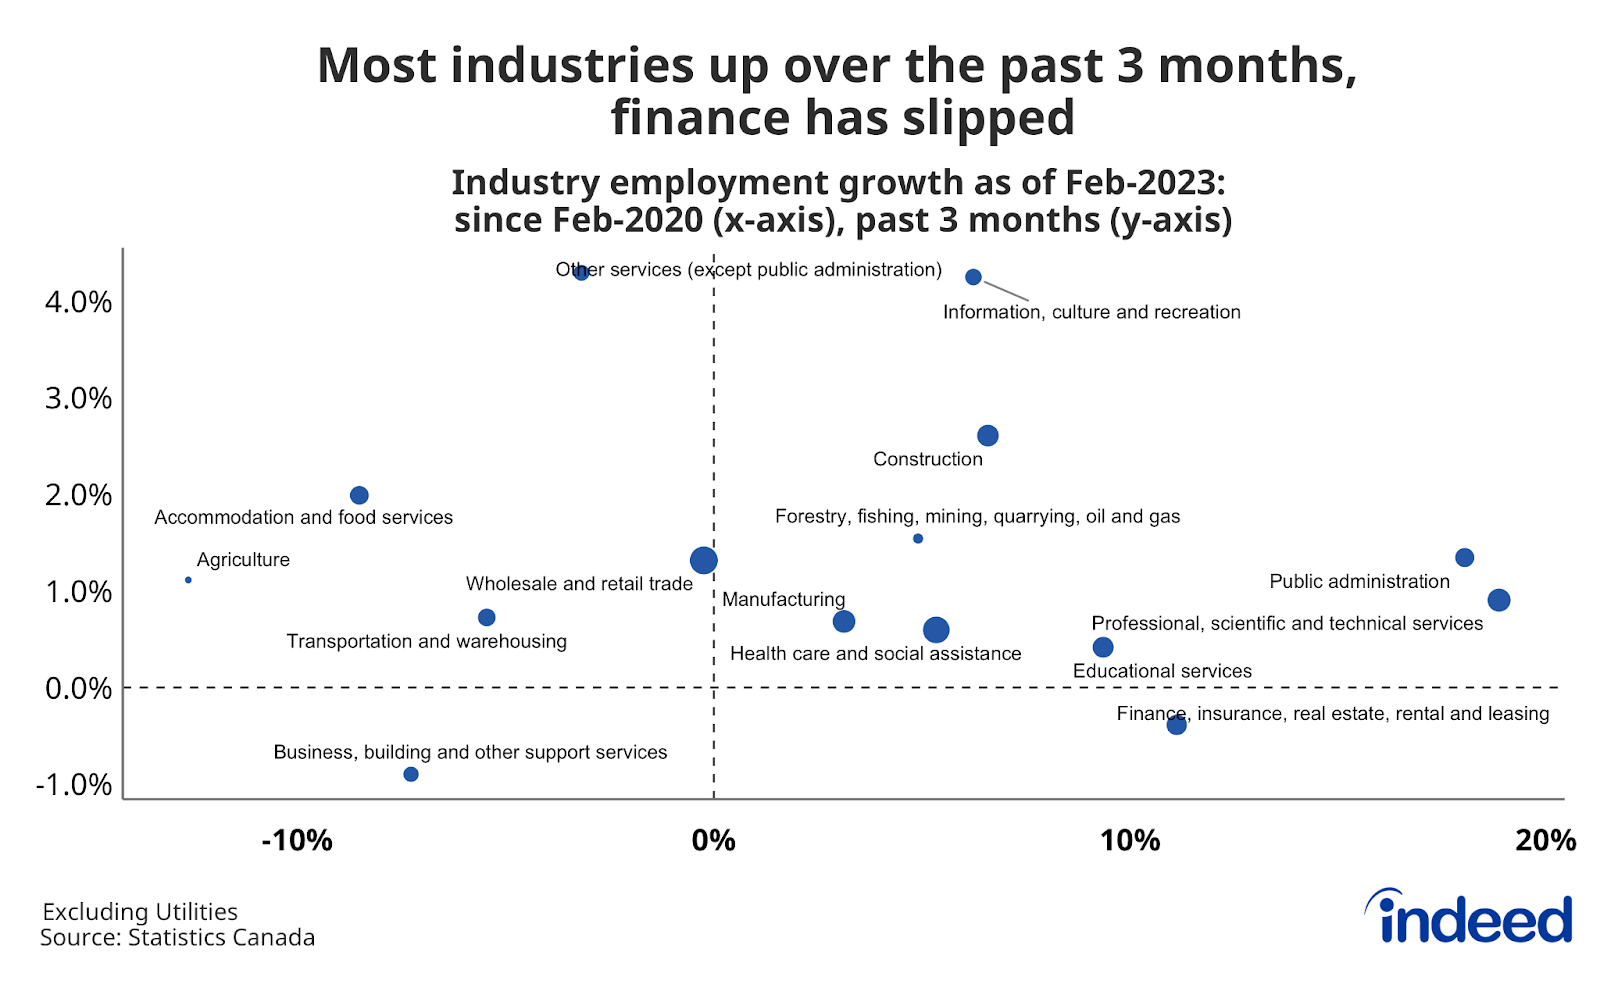
Job gains in the LFS were broad-based across sectors between November and February. Construction was a notable source of strength, as the industry added workers in spite of the higher rate environment. At the same time, finance, insurance, and real estate slipped over the three months, though the industry remains one of the areas up most since the start of the pandemic.
Strength in the LFS has primarily shown up in higher labour force participation and ongoing population growth. The unemployment rate was 5.0% in February, a hair above the low of 4.9% reached last June. But the working age (15 to 64 year-old) employment rate reached an all-time high in January as more Canadians entered the labour force.
Employment rates are above pre-pandemic levels across most demographics, including youth and core-age (25-54) men, but are particularly elevated among core-age women. Standing out within this group are those with university degrees and mothers with young children, strength among the latter likely related to expanded childcare subsidies.
Labour flows help explain why employment has held up
Underneath the net employment changes recorded by the LFS, tens of thousands of jobs begin and end every month. These labour flows provide context to recent headline monthly job growth, especially as employer hiring appetite has slipped from elevated levels.
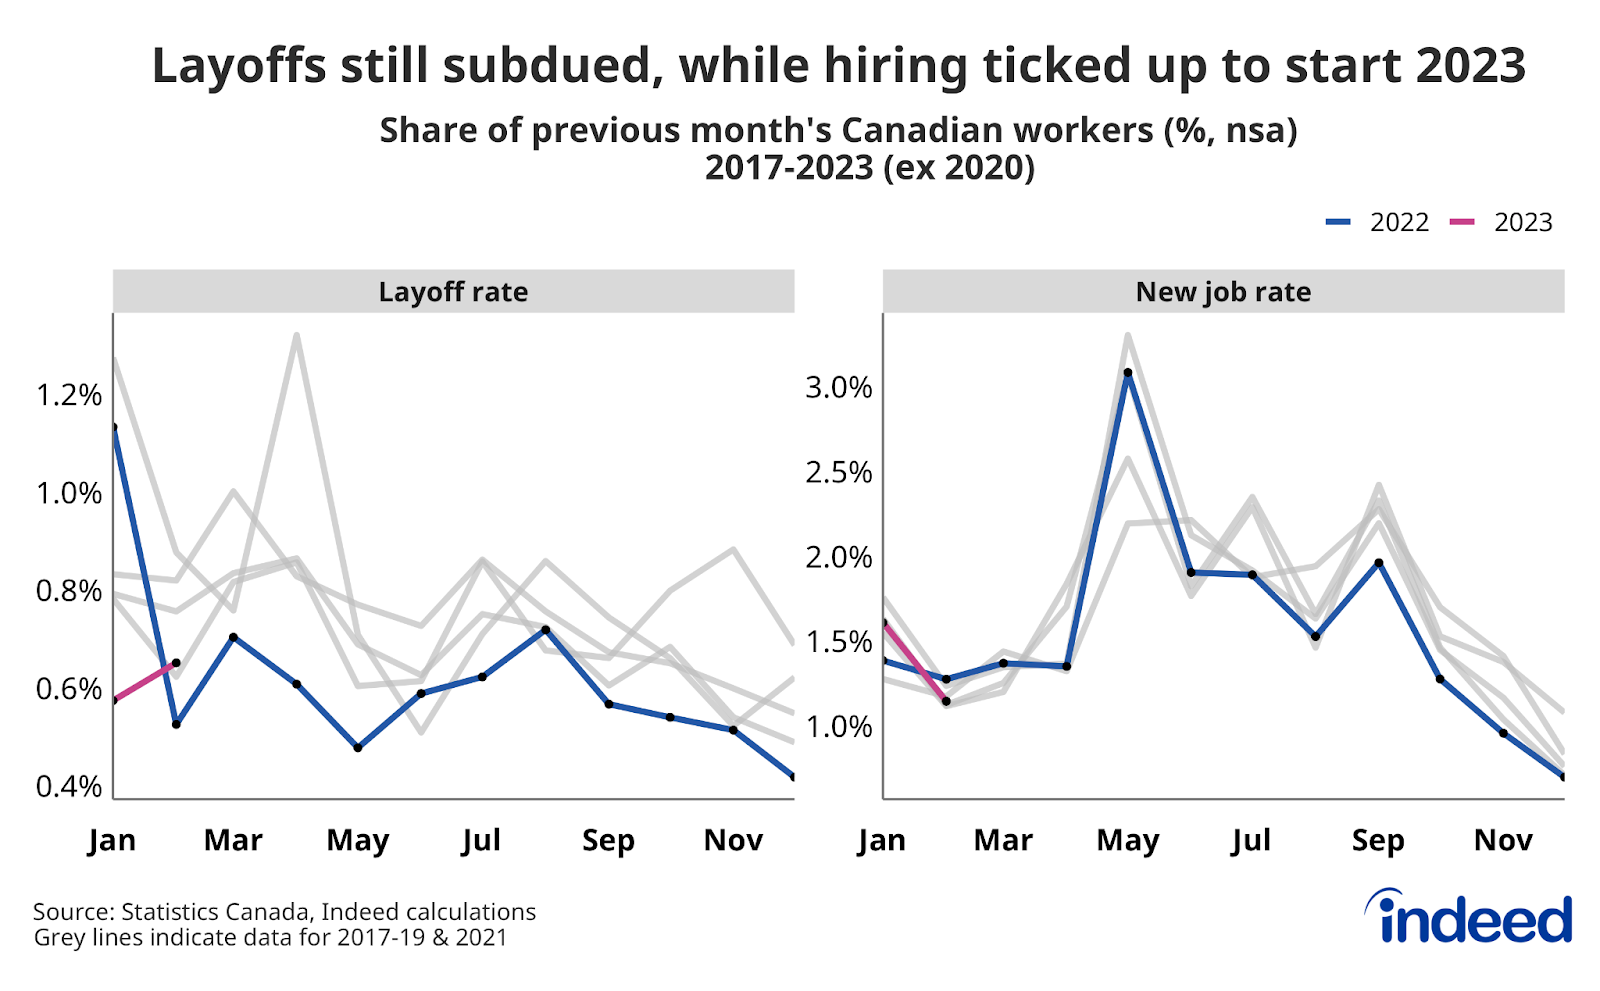
First, layoff and discharge rates have remained low so far this year, even amid subdued economic growth and ongoing uncertainty. This could be a sign of “labour hoarding,” where companies are holding on to employees as long as they can amid soft business conditions to avoid the difficulty of finding new workers, should the economic situation improve.
Meanwhile, after a slow second half of 2022, the hiring rate has rebounded in 2023 to more typical seasonal levels, despite a recent decline in overall opportunities. One potential reason is that filling job openings was quite difficult when vacancies were at their peak, resulting in relatively few new hires per individual job vacancy. As a result, there was room for improvement in the efficiency of filling job openings, which could be a reason new hires have held up to start 2023 despite less hiring appetite than in mid-2022. That said, the situation could change if the slide in job postings continues.
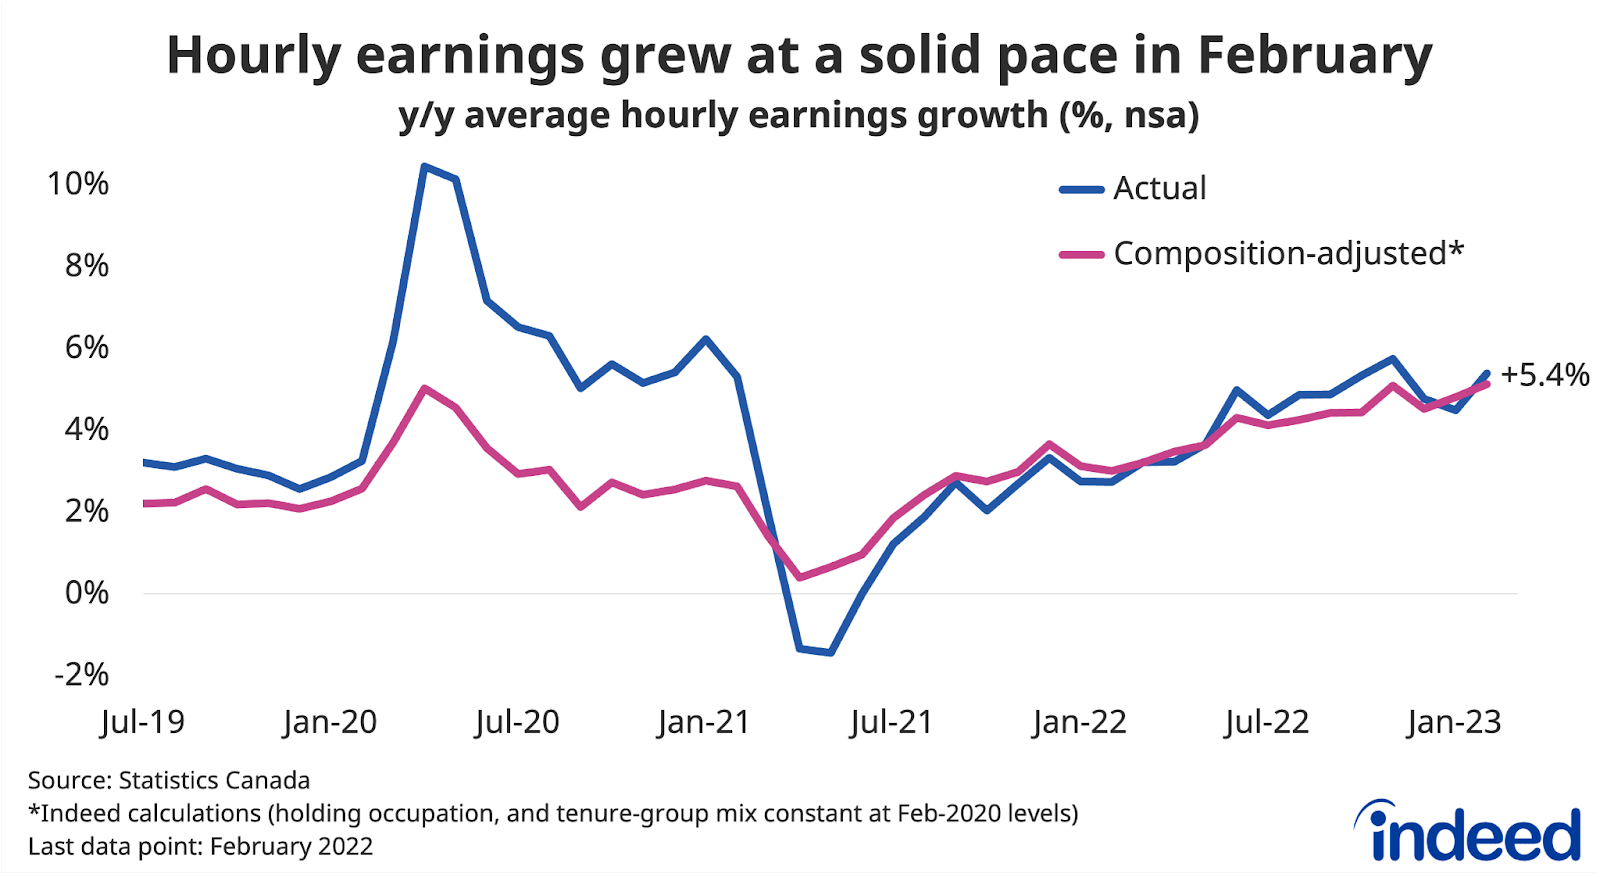
LFS wage growth was solid through February
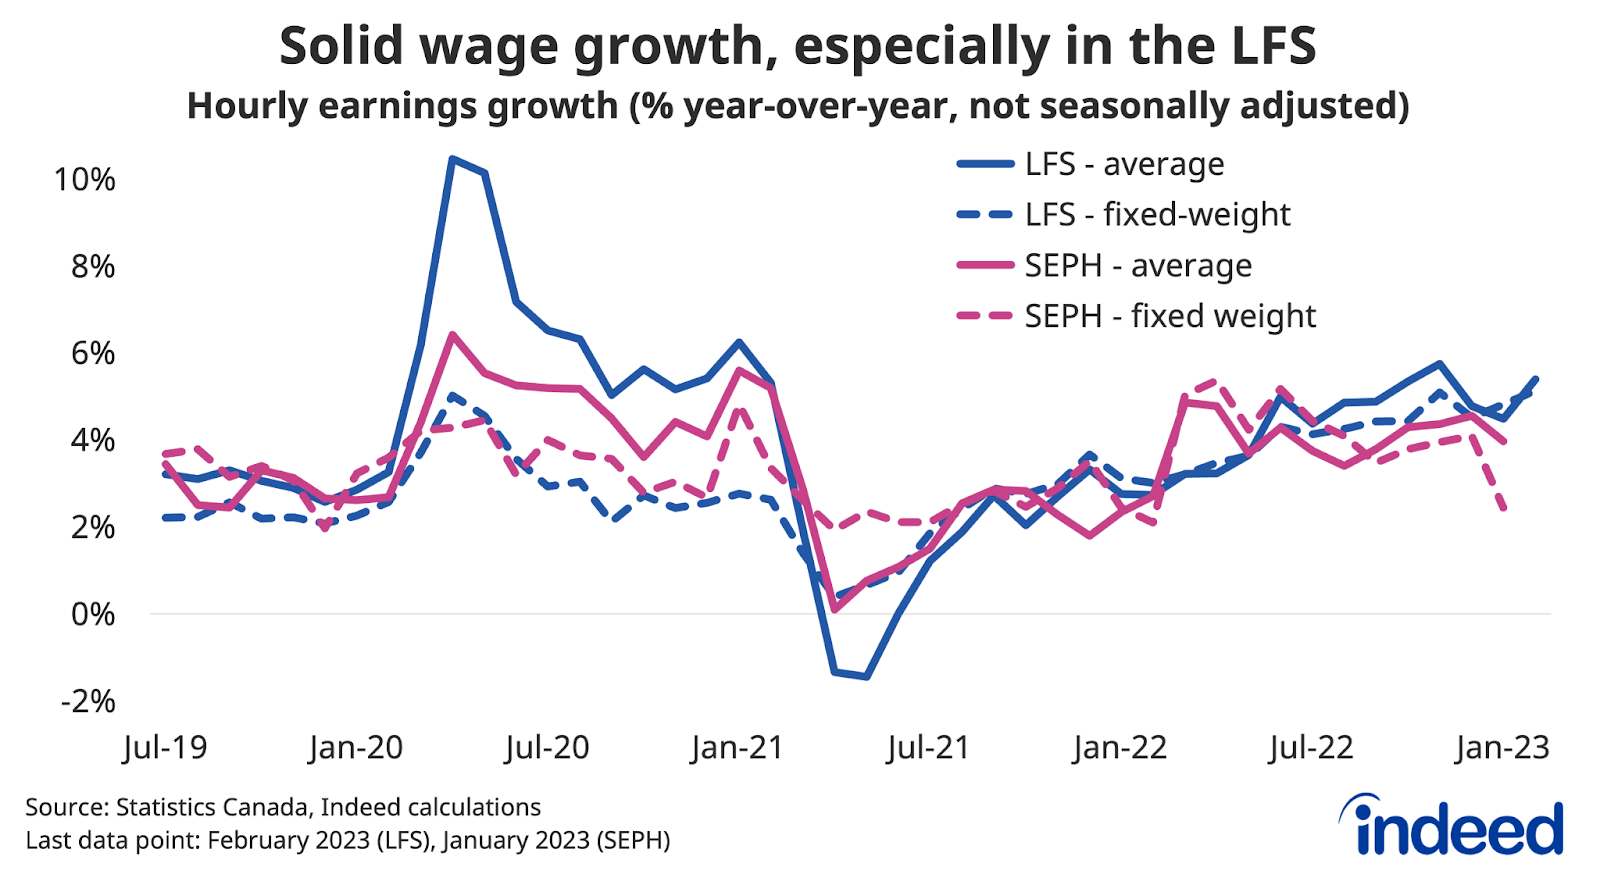
Wage growth has also remained robust alongside the overall employment numbers. The LFS, and some measures in SEPH, showed hourly earnings were up near 5% year-over-year at the end of 2022, before pay growth as measured by the LFS edged up further in February (January numbers were softer in SEPH). Strength in LFS wage growth has been fairly broad-based across occupations at different points on the payscale. On balance, ongoing solid wage growth suggests the tightening labour market over the past two years has outweighed more recent signs of softer hiring appetite, at least for now.
Can the current environment last?
The key economic question hanging over the Canadian labour market today remains the same: can inflation cool significantly without bringing on a recession? The employment situation has remained solid to start the year, but job postings are falling and the potential for rising layoffs is a threat, albeit one that hasn’t materialized, despite looming for several months.
Methodology
All job postings figures in this blogpost are the index of seasonally-adjusted Canadian job postings on Indeed rebased to February 1, 2020, using a seven-day trailing average. February 1, 2020, is our pre-pandemic baseline. We seasonally adjust each series based on historical patterns in 2017, 2018, and 2019. Each series, including the national trend, occupational sectors, and sub-national geographies, is seasonally adjusted separately. This week, we applied our quarterly revision, which updates seasonal factors and fixes data anomalies. Historical numbers have been revised and may differ from originally reported values. New job postings are posts that are seven days old or less.
The number of job postings on Indeed, whether related to paid or unpaid job solicitations, is not indicative of potential revenue or earnings of Indeed, which comprises a significant percentage of the HR Technology segment of its parent company, Recruit Holdings Co., Ltd. Job posting numbers are provided for information purposes only and should not be viewed as an indicator of performance of Indeed or Recruit. Please refer to the Recruit Holdings investor relations website and regulatory filings in Japan for more detailed information on revenue generation by Recruit’s HR Technology segment.
To calculate fixed-weight wage growth in the LFS, we bucket LFS microdata for each of the 43 occupation groups into three levels of job tenure (6 months or less, 7 to 24 months, and 25 months and over), and recalculate headline average wages into a composition-adjusted measure by holding their respective weights constant at February 2020 levels.