This post is updated as of July 13, reflecting data through July 10. We will be regularly updating this data as we track how COVID-19 impacts the global labour market.
Key points:
- As of July 10th, the trend in total job postings on Indeed Canada stood at 33% below last year’s pace, continuing their gradual, but incomplete rebound.
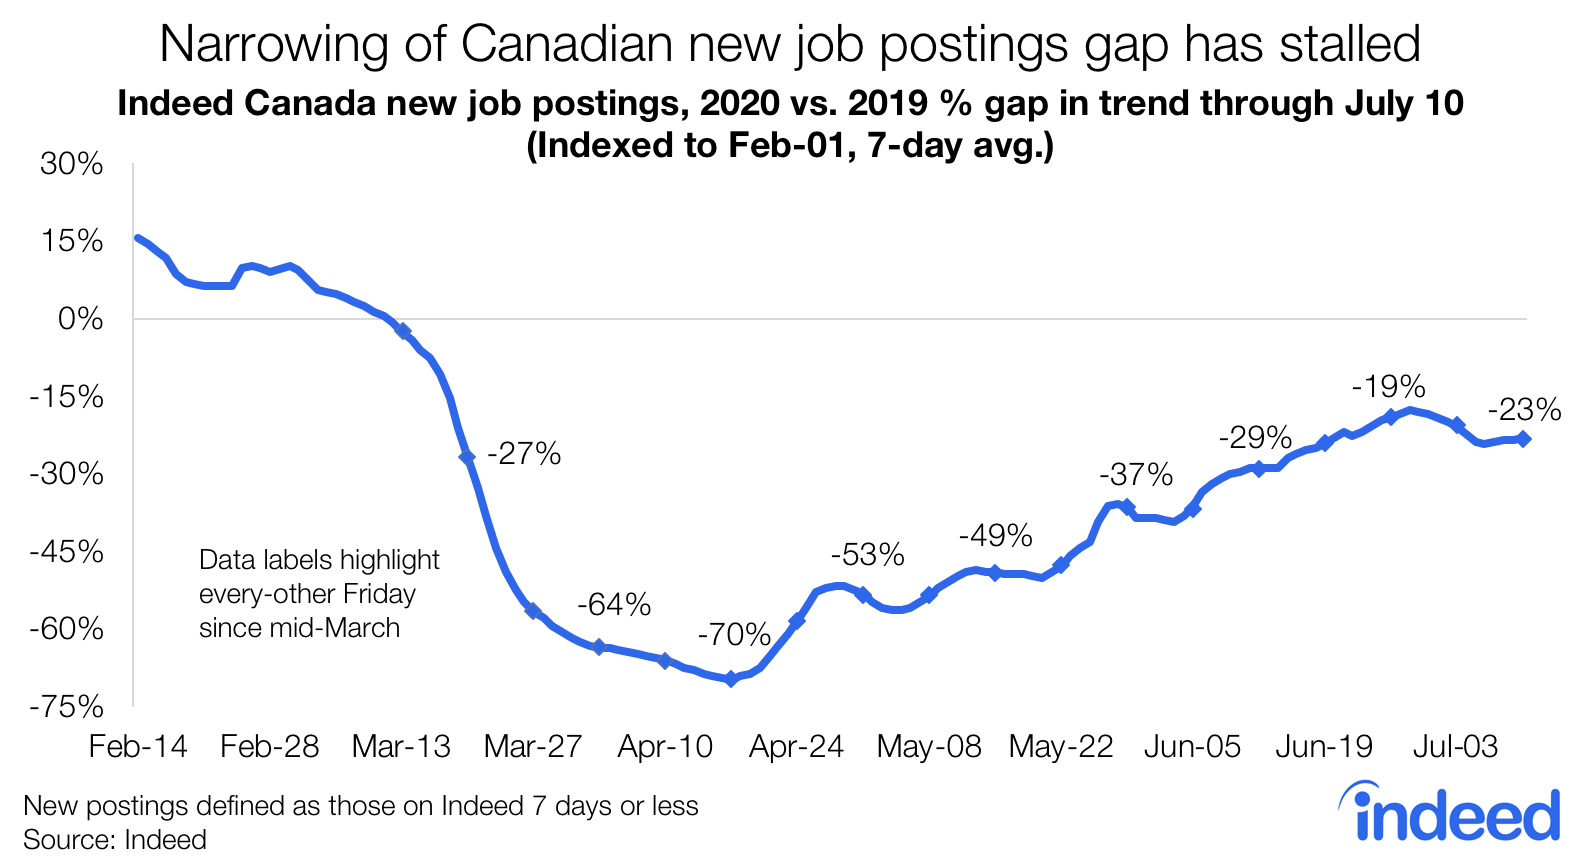
- The gap in new postings widened slightly to 23% below 2019’s path from -21% a week earlier, easing back to where it was on June 20th. The slowdown in momentum is evident in most provinces.
- Total postings are closer to their 2019 trends in areas like health care, software development, as well as beauty and wellness, and construction (the latter two seeing strong rebounds since early May). Meanwhile, opportunities are weaker in areas of the economy hit hard by the crisis, such as food services, as well as more white collar sectors like banking, and human resources.
Total job postings on Indeed Canada edged up compared to last year’s trend last week, as of Friday, July 10th, standing 33% below 2019 levels. The gap was -35% the previous Friday, and -49% in early-May. Overall, the shortfall in total postings has continued to narrow over the past two weeks, but a somewhat slower pace than we saw in June.

The slightly-slower narrowing of the total postings gap reflects some lost momentum in new postings. The trend in new postings widened to 23% below last year’s level, compared to -21% the week prior, standing roughly where it did on June 20th. Overall, the slightly weaker trend in new postings pales in comparison to the rebound since their trough in mid-April. However if the trend doesn’t resume its prior upward trajectory, the recovery in total job postings will likely proceed more slowly, and with it, slower improvement in the outlook for Canadian job seekers.
The flatline in the new postings gap reflects softer momentum in most provinces. The trend in new postings since June 20th has been either steady or down compared to 2019 levels in all provinces except Alberta and Quebec. Overall, new postings are being added at rates closest to last year’s trend in New Brunswick, Saskatchewan, and Aberta.

Hiring appetite doing better in some sectors
The recent slowdown in new posting trends notwithstanding, the overall rebound in total postings since early May does indicate that job opportunities are more plentiful than earlier in the crisis.
Some sectors where hiring appetite looks relatively strong, at least compared to the overall average, are those that didn’t experience sharp declines in March and April, despite seeing limited rebounds since. Included here are healthcare related areas like nursing, and personal care and home health, as well as software development. Meanwhile, strong rebounds in sectors like beauty and wellness (which include massage therapists and hairstylists), and construction have brought postings closer to their 2019 trends than elsewhere.
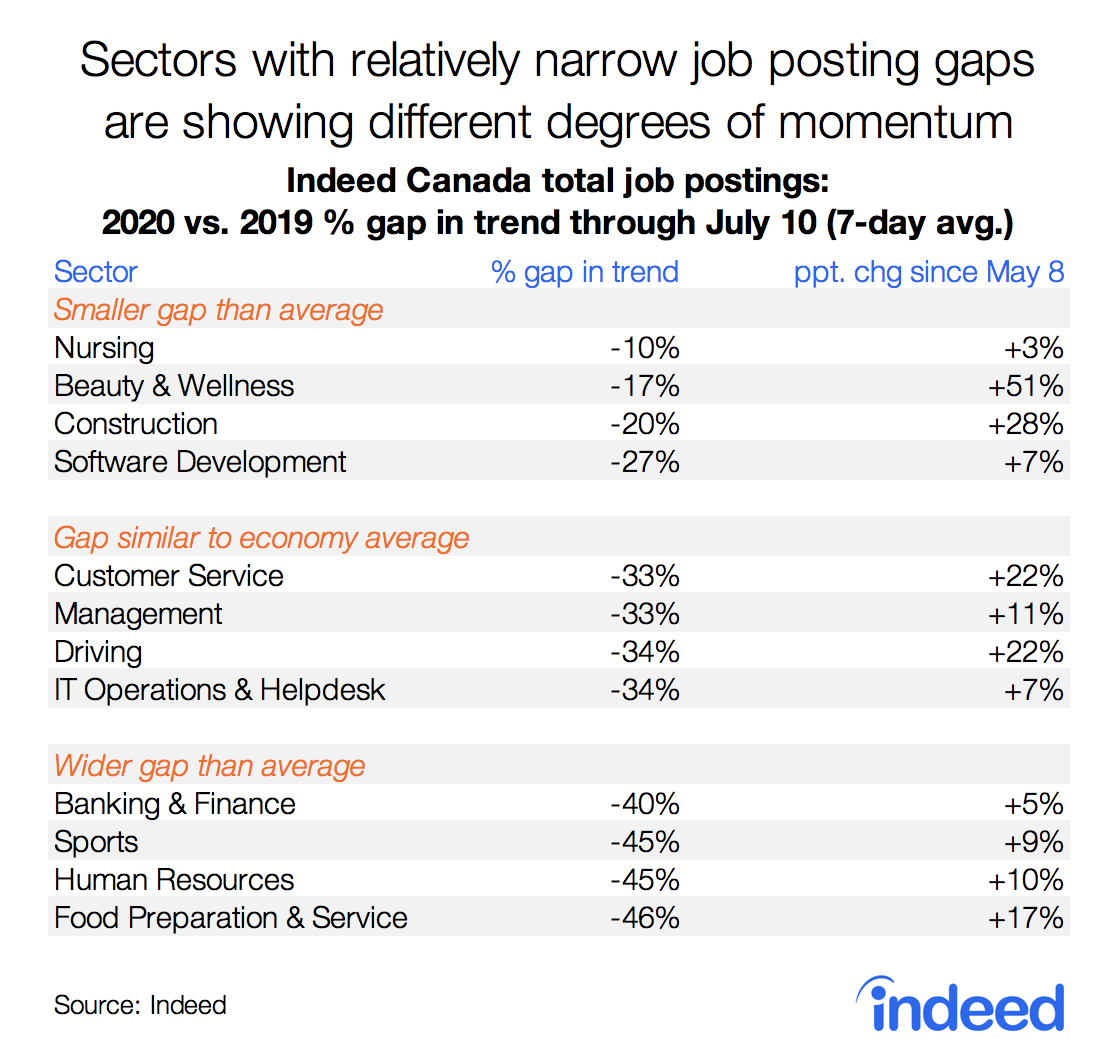
A wide range sectors have job postings trends at a similar distance from their 2019 levels as the economy-wide average. These include customer service, driving (which includes truck drivers), management, as well as IT operations and helpdesk. While the former two have seen relatively large rebounds since early May, the latter two fell less than average earlier in the crisis.
Lastly, posting gaps are currently wider than the overall average in several sectors. Some are areas that have been hit harder by the pandemic like sports (which includes fitness instructors and coaches), as well as food preparation and service. Others are in more white-collar areas such as banking and finance (which include mortgage specialists, and risk managers), as well as human resources.
The public health situation and its economic spillovers continue to change on a daily basis. We’ll be regularly updating this data as conditions evolve.
Methodology
To measure the trends in job postings, we calculated the 7-day moving average of the number of job postings on Indeed Canada. We index each day’s 7-day moving average to the start of February (Feb 1, 2020 = 100 for 2020 data, and so on).
We report how the trend in job postings this year differs from last year, in order to focus on the recent changes in labor market conditions due to COVID-19. For example: if job postings increased 30% from February 1, 2019, to April 10, 2019, but only 20% from February 1, 2020, to April 10, 2020, then the index would have risen from 100 to 130 in 2019 and 100 to 120 in 2020. The year-to-date trend in job postings would therefore be down 7.7% on April 10 (120 is 7.7% below 130) in 2020 relative to 2019.
For new postings, we calculate a similar metric but the underlying measure is the number of postings that have been on Indeed for seven days or less.
The number of job postings on Indeed.com, whether related to paid or unpaid job solicitations, is not indicative of potential revenue or earnings of Indeed, which comprises a significant percentage of the HR Technology segment of its parent company, Recruit Holdings Co., Ltd. Job posting numbers are provided for information purposes only and should not be viewed as an indicator of performance of Indeed or Recruit. Please refer to the Recruit Holdings investor relations website and regulatory filings in Japan for more detailed information on revenue generation by Recruit’s HR Technology segment.