
This post is updated as of July 6, reflecting data through July 3. We will be regularly updating this data as we track how COVID-19 impacts the global labour market.
Key points:
- As of July 3rd, the trend in total job postings on Indeed Canada stood at 35% below last year’s pace, continuing their gradual, but incomplete rebound.
- The gap in new postings widened slightly to 21% below 2019’s path from -19% a week earlier, the first time momentum has softened since the start of June.
- Separating job-titles into low-, mid-, and high-wage categories, we see that postings for positions that typically offer higher-wages fell less than others earlier in the crisis, but have also rebounded more slowly since, leaving each tier roughly similar distance from their 2019 trends.
Total job postings on Indeed Canada edged up compared to last year’s trend last week, as of Friday, July 3rd , standing 35% below 2019 levels. The gap was -36% the previous Friday, and -49% in early-May. Overall hiring appetite remains subdued compared to last year, but it’s gradually recovering. Continuing a pattern seen throughout the crisis, overall job posting trends have held closer to 2019 levels in smaller provinces than larger ones.
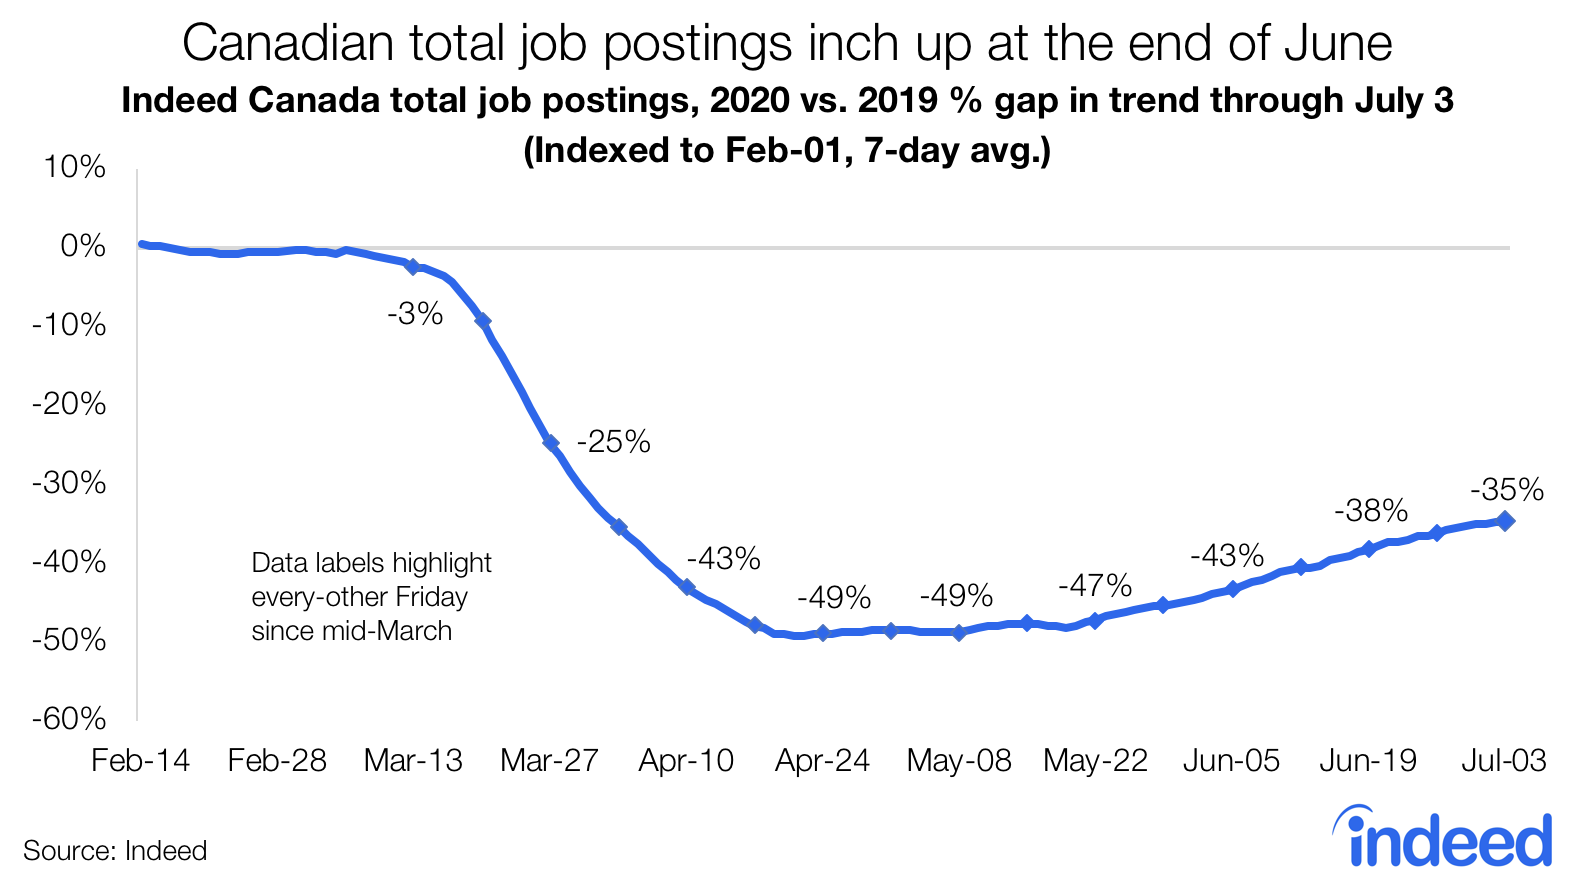
The gap in total postings narrowed at a slightly slower pace than in previous weeks, in part because momentum in new postings softened. The trend in new postings widened to 21% below last year’s level, compared to -19% the week prior. While not dramatic, it was the first week since early June that the gap in new job posting trends failed to narrow. Overall, the trend in new postings is 33 percentage points narrower than it was on May 8th, still strong enough to drive total job postings higher, improving the outlook for Canadian job seekers.

Job posting trends across different wage tiers
One of the defining features of COVID-19’s labour market impacts has been that job losses have been especially concentrated in mid-, and especially lower paying occupations. A natural follow-up question is how do developments in job postings compare?
Separating job-titles into wage-tiers according to their posted salaries in 2019, low-, and mid-wage jobs fell further earlier in the crisis compared to their 2019 trends than higher-paying positions. While opportunities fell across the board through mid-April, posting trends for both low, and mid-paying jobs dropped by 52% compared to 2019, more severe than the 41% gap that opened up for higher-paying ones.
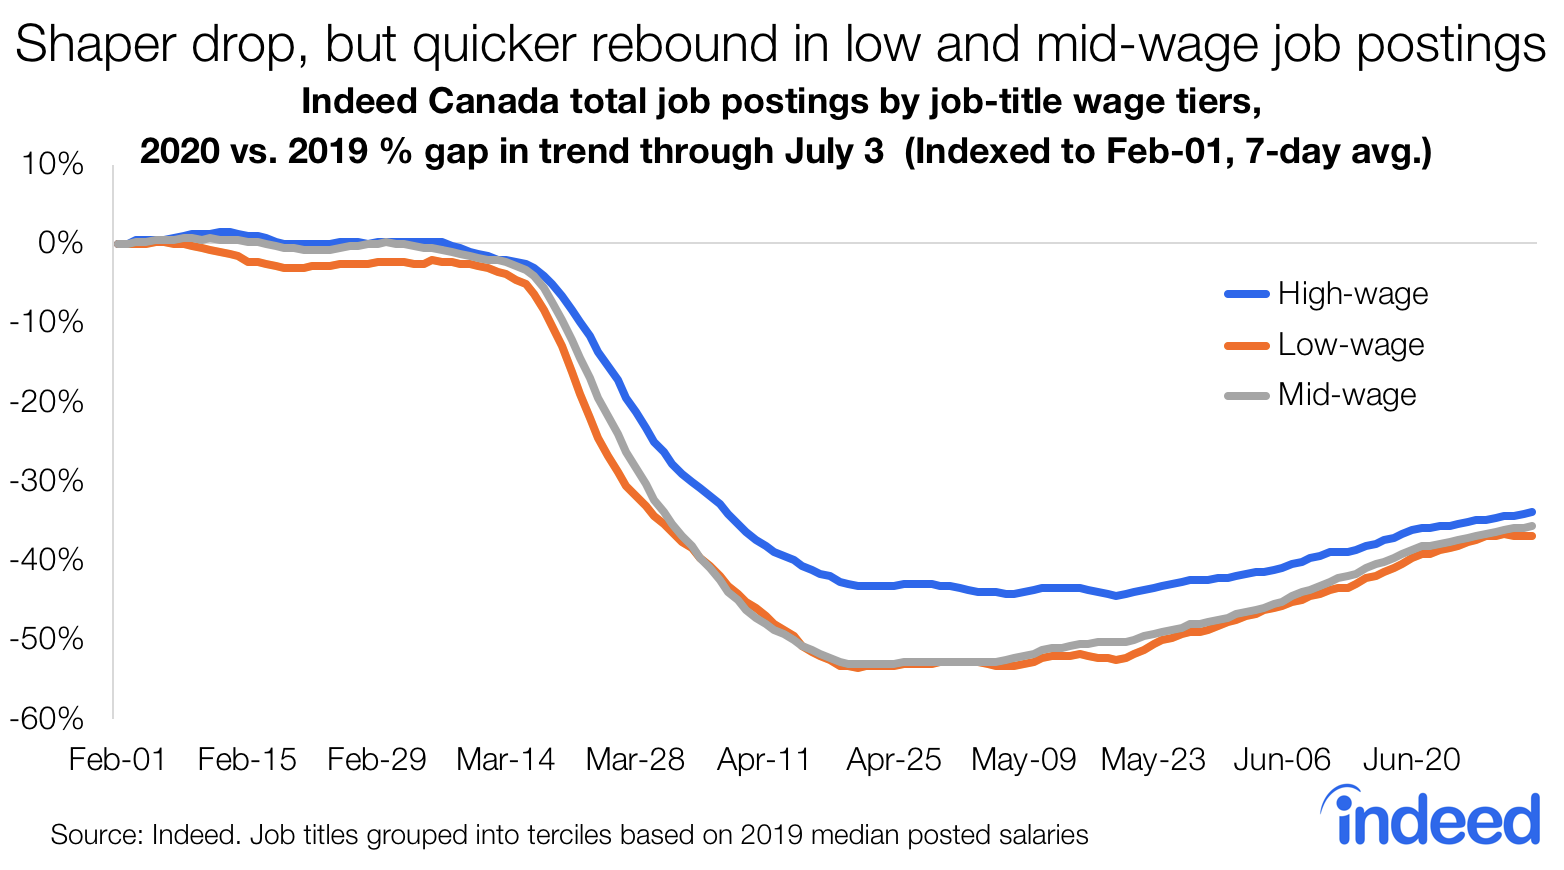
However, as hiring appetite has started to return, low-, and mid-paying jobs have also seen stronger rebounds. As of July 3, all three tiers were a similar distance from last year’s trends, with the gap for low-wage jobs at -37%, compared to -35% for mid-wage, and -34% for high-wage positions.
These patterns are evident when looking at the evolution of job postings compared to last year’s trends in different areas of the economy. Sectors narrowing the gap relatively quickly in recent weeks include ones featuring lower-paying positions, like retail, and customer service. Areas posting roles with many mid-wage jobs have also seen noticeable bounce-backs, like construction, as well as education and instruction. Meanwhile postings in higher-paying sectors like nursing, and software development have held up relatively well throughout the crisis, but haven’t contributed much to the overall rebound.

Of course, these patterns don’t apply neatly to all sectors. Unlike other lower-paying sectors, opportunities in security and public safety didn’t fall much when the pandemic hit, and have actually softened in recent weeks compared to last year’s trend. At the same time, some of the harder hit areas of the economy like hospitality and tourism, aviation, human resources, and sports (which includes fitness instructors and coaches) experienced sharp drops in postings, and relatively modest (or non-existent) rebounds since. Lastly, the job posting gap has evolved similarly to the broader economy in other sectors, like cleaning and sanitation, as well as architecture.
The public health situation and its economic spillovers continue to change on a daily basis. We’ll be regularly updating this data as conditions evolve.
Methodology
To measure the trends in job postings, we calculated the 7-day moving average of the number of job postings on Indeed Canada. We index each day’s 7-day moving average to the start of February (Feb 1, 2020 = 100 for 2020 data, and so on).
We report how the trend in job postings this year differs from last year, in order to focus on the recent changes in labor market conditions due to COVID-19. For example: if job postings increased 30% from February 1, 2019, to April 10, 2019, but only 20% from February 1, 2020, to April 10, 2020, then the index would have risen from 100 to 130 in 2019 and 100 to 120 in 2020. The year-to-date trend in job postings would therefore be down 7.7% on April 10 (120 is 7.7% below 130) in 2020 relative to 2019.
For new postings, we calculate a similar metric but the underlying measure is the number of postings that have been on Indeed for seven days or less.
Information based on publicly available information on the Indeed Canada website (and other countries named in the post), limited to Canada, is not a projection of future events, and includes both paid and unpaid job solicitations.