
Key Points:
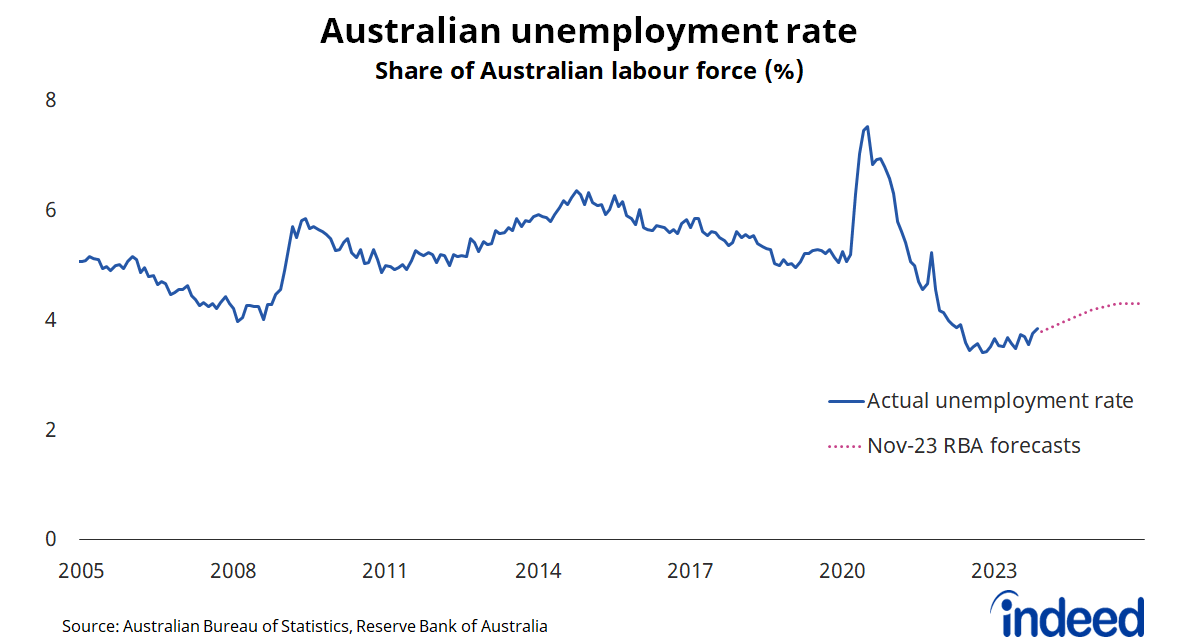
- Australia’s labour market remains tight by historical standards, with the unemployment rate still below 4%.
- Forward-looking measures of labour demand, including Indeed job postings, suggest demand is gradually normalising. We expect that to continue in 2024.
- Job postings in every occupational category fell slightly from 2022 to 2023, but remain above pre-pandemic levels in 96% of categories.
- Australia’s population rose at a record pace during 2023, helping to address some of the skill shortages that emerged during the post-pandemic jobs boom. We expect population growth in 2024 to ease back towards historical norms.
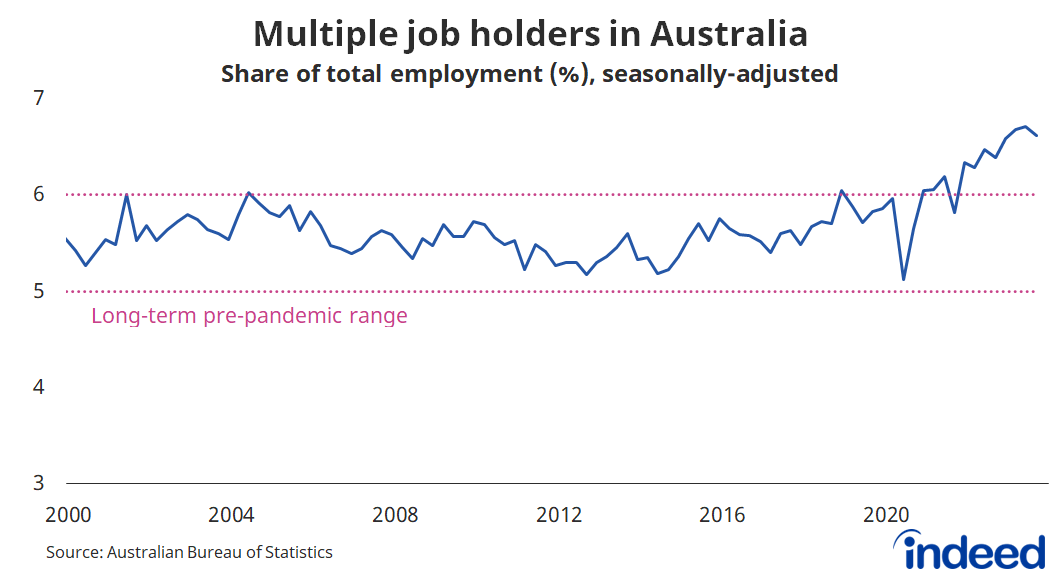
- Cost-of-living pressures remain a key economic challenge, forcing some Australians to find more hours or an additional job to make ends meet.
We expect the Australian labour market to remain tight in 2024, marked by ongoing high demand from employers, but not as tight as was common throughout the post-pandemic job boom in 2022 and 2023.
While still tight, Australian labour market conditions eased throughout 2023, consistent with a more challenging economic environment. Imbalances between labour demand and supply — highlighted by a falling number of job vacancies and record population growth — have gradually eased, and we expect this to continue in 2024.
Here are some of the highlights from the past year:
- The unemployment rate started 2023 at 3.5% and ended the year at 3.9%.
- The nation’s participation rate — the share of the working-age population either employed or actively seeking employment — reached a record high of 67.3% in November.
- Wage growth reached its highest level since March 2009, and the gap between annual wage growth and annual inflation closed considerably.
- Job vacancies fell to 388,800 in November, down 14.4% over the year, but are still around 70% higher than pre-pandemic levels.
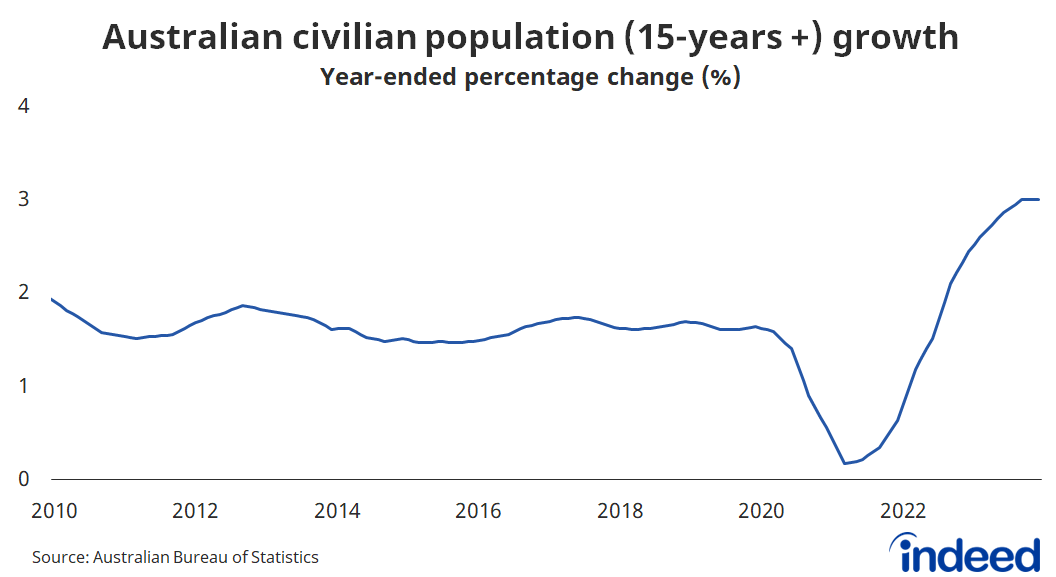
- Australia’s population aged 15 and over increased by 3% over the past year, the strongest annual growth in at least 45 years.
Recent labour market developments
Many of these trends from 2023 are expected to continue into 2024. The Reserve Bank of Australia expects the unemployment rate to continue to creep up to 4.2% by the end of the year. That’s a healthy number by historical standards but would still mark a 0.8 percentage point increase from the October 2022 post-pandemic low.
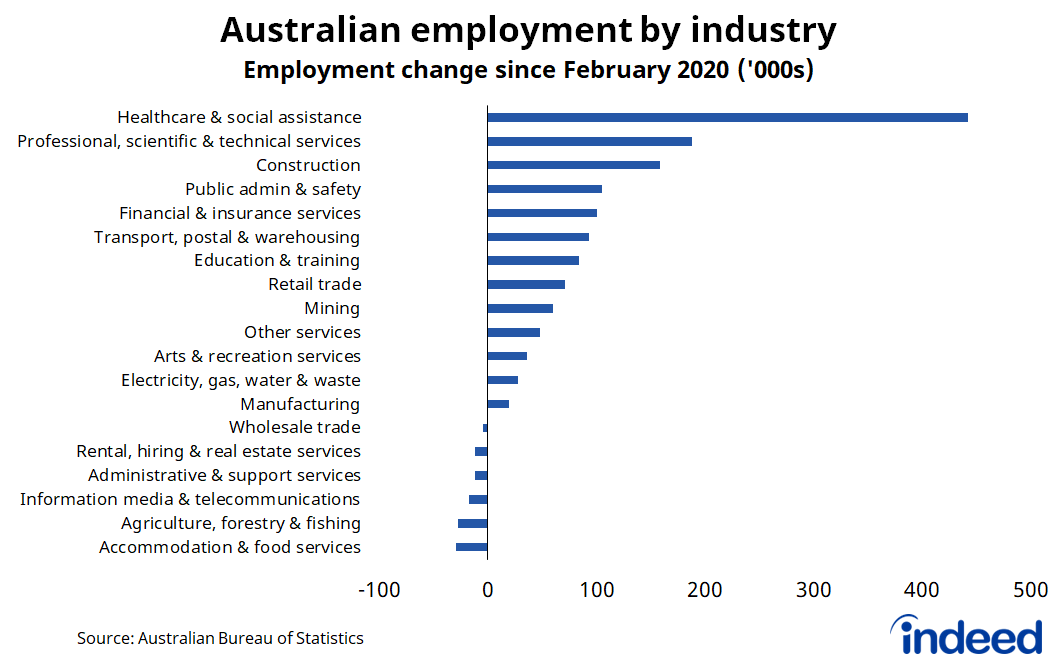
While Australia has experienced an unprecedented job boom in the aftermath of the pandemic, its impact has been uneven. To a large degree, that boom has been powered by one industry: healthcare & social assistance. The industry accounts for one-third of employment gains since February 2020, with employment increasing by around 443,000 people since then. The demand for healthcare and social assistance workers is underpinned by Australia’s ageing population, which will continue to drive strong job creation for the foreseeable future. Other strong performers include professional services and construction.
Despite Australia’s jobs boom, there are still six industries — led by accommodation & food services, agriculture, and information media & communications — where employment remains below pre-pandemic levels. In most cases, this does not reflect a lack of labour demand (since job vacancies are elevated for every industry), but rather the difficulty of recruiting staff.
Cost-of-living pressures remain challenging
Unless you’ve received a promotion or changed jobs recently, there is a good chance that your salary today buys a lot less than it used to. Data from the Australian Bureau of Statistics shows that Australian wages rose 4.0% over the past year, the highest level since the March quarter 2009, but still short of the 5.3% increase in consumer prices over the same period. Inflation, while still elevated, is down from a peak of 7.8% in the December quarter of 2022.
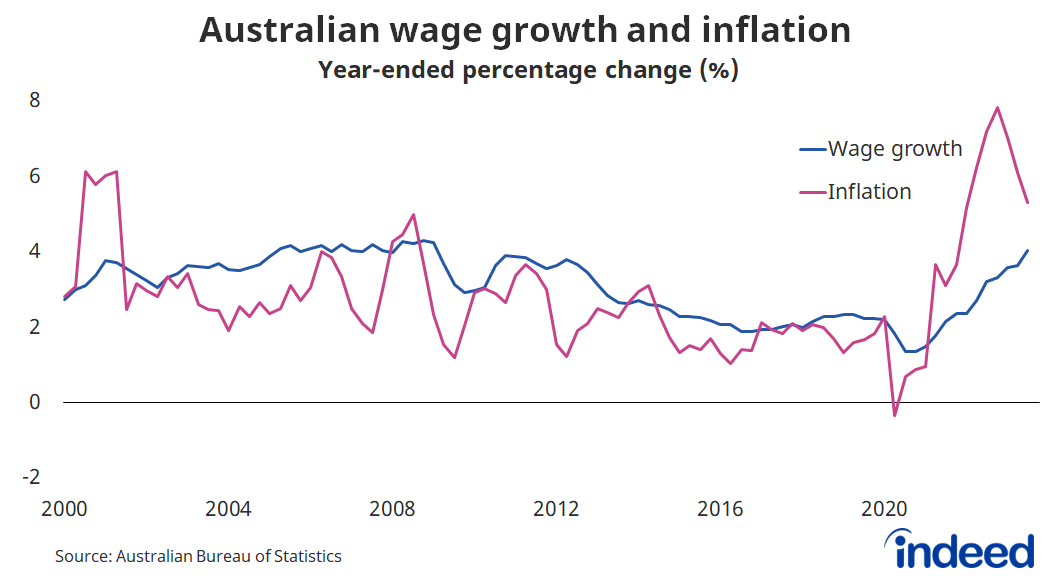
Adjusted for inflation, Australian wages are currently at levels last seen 13 years ago, having declined 1.2% over the past year and 7.0% from their peak. Thankfully, inflation-adjusted wages have started to rise, and they should increase further throughout 2024. Unfortunately, the damage caused by Australia’s cost-of-living crisis has been so large that a full recovery may take an extended period of time, perhaps 5-10 years. It certainly won’t happen overnight.
Some people have responded to cost-of-living pressures by working more than one job. Around 6.6% of Australian workers had two or more jobs in the September 2023 quarter, according to the Australian Bureau of Statistics, well above the historical pre-pandemic range of 5 to 6%. Thankfully, the recent job boom has provided plenty of opportunities for Australians to either find a new higher-paying role or find more hours via an additional job. The impact of high inflation could have been much worse in the absence of so many job opportunities.
The share of workers with multiple jobs is much higher among women (7.9% of female workers) than for men (5.6%). Such work arrangements are most common in arts & recreation (9.1% of arts & recreation workers), administrative & support services (8.8%) and agriculture (8.4%).
Labour demand eased throughout 2023
Overall, the demand for labour remains elevated and well above pre-pandemic levels. But it also eased considerably throughout 2023.
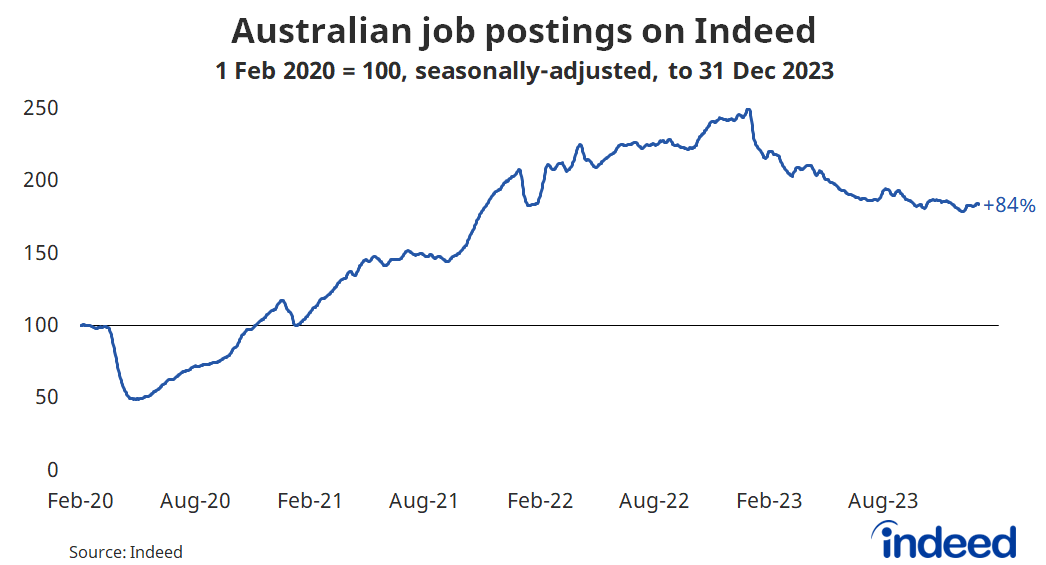
Australian job postings on Indeed fell steadily throughout the year, and ended 2023 down 26.3% from the start of the year. To some degree, that steady decline is expected to continue this year. But there continues to be a lot of jobs available across the country, with job postings still 84% higher than the 1 February 2020 pre-pandemic baseline.
Demand for workers remains elevated across the country, although job postings relative to pre-pandemic levels are a little higher in Queensland, South Australia and Western Australia than they are elsewhere. Strong job creation has helped keep the nationwide unemployment rate low.
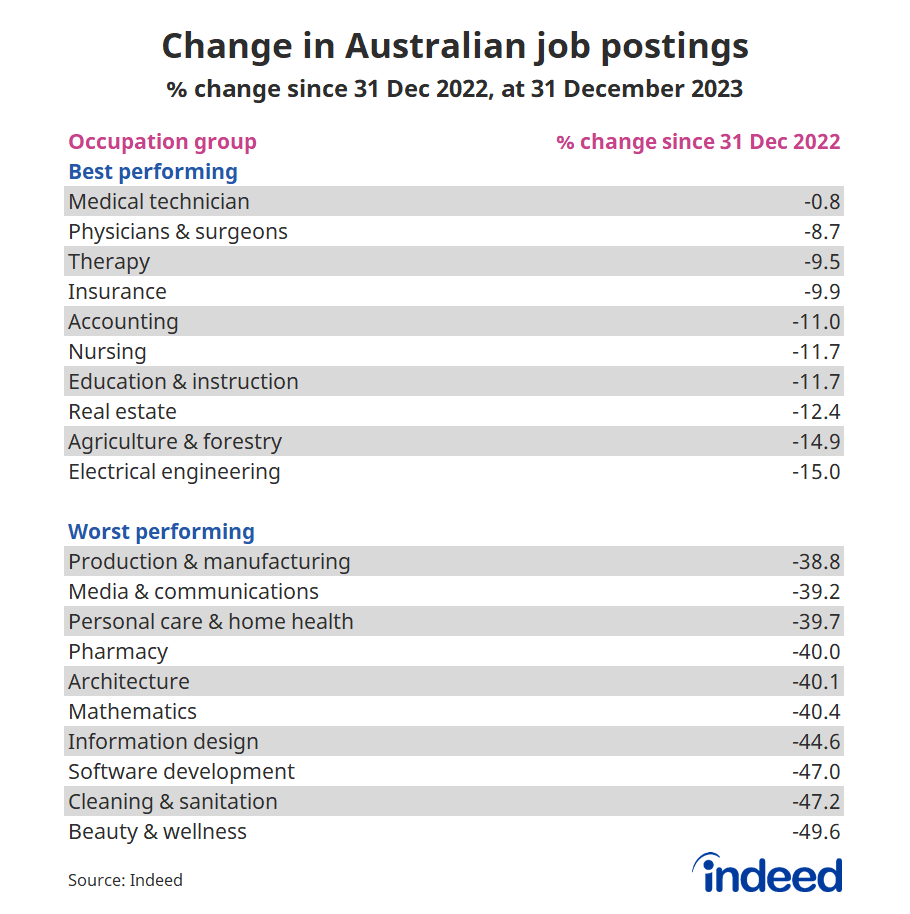
In 2023, Indeed job postings fell throughout the year in each of the 50 occupational categories we assessed. Healthcare proved to be the most resilient occupational category last year, with relatively modest declines observed for medical technicians (-0.8% over the year), physicians & surgeons (-8.7%), therapy (-9.5%) and nursing (-11.7%).
Some of the annual declines were large, with beauty & wellness postings falling by half. Cleaning & sanitation and software development postings fell by 47%, while information design was down 45%. Despite these declines, postings in 96% of occupational categories were still above pre-pandemic levels as of the end of 2023. Postings are more than twice their pre-pandemic levels in roughly a third of occupational categories.
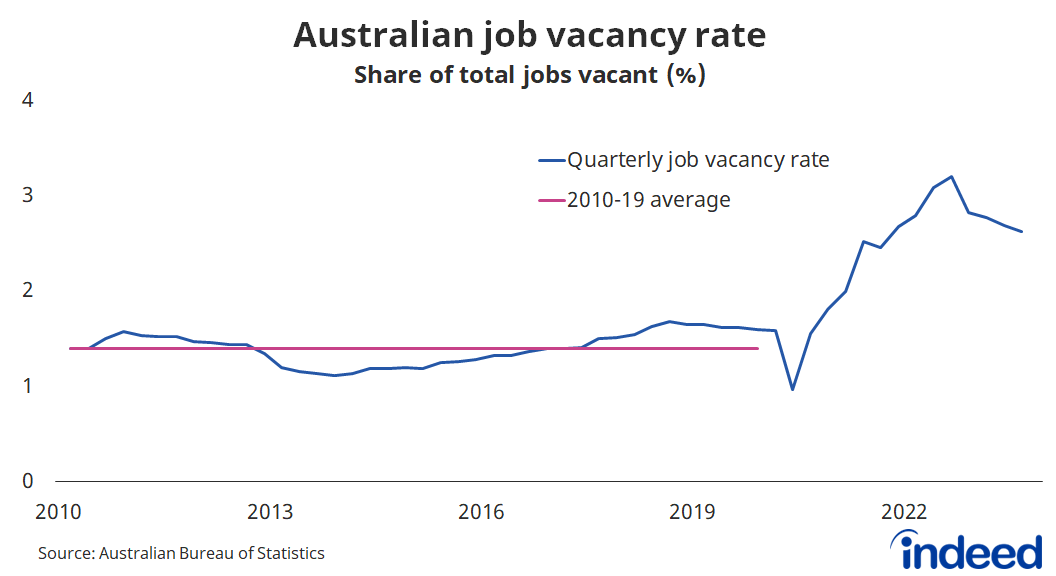
Indeed’s data is consistent with other measures of labour demand, including job vacancies from the Australian Bureau of Statistics. In the September quarter, around 2.6% of Australian jobs were vacant nationwide. While that number has declined from a peak of 3.2% in the September quarter of 2022, it’s still almost twice as high as was considered normal from 2010 to 2019. Much like Indeed job postings, we expect Australia’s job vacancy rate to ease this year.
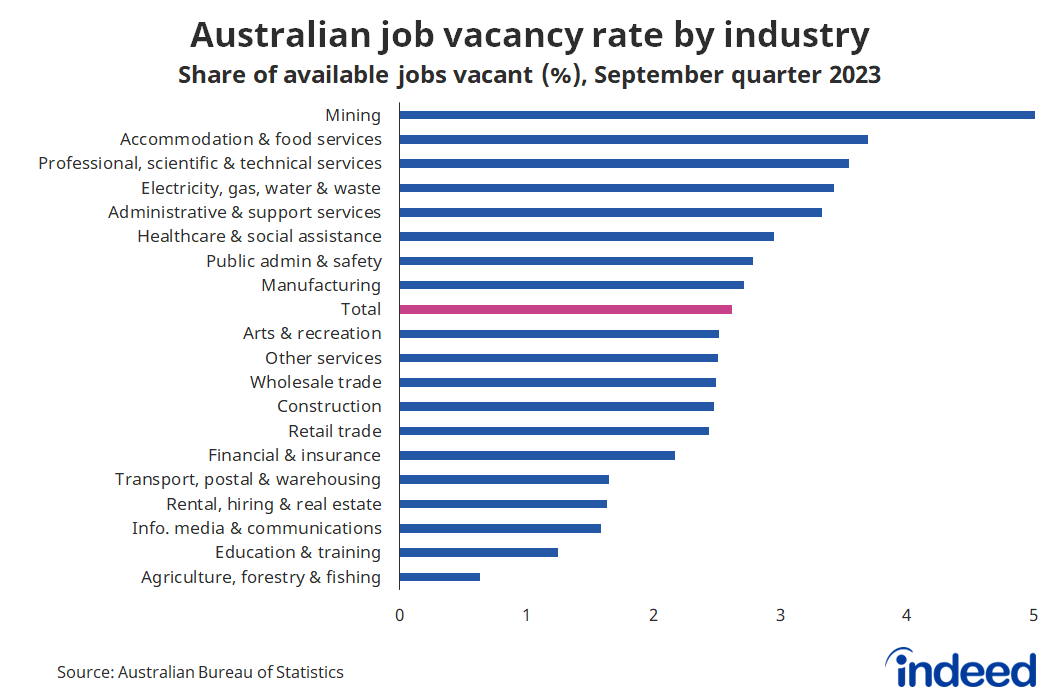
Australia’s job vacancy rate is highest in the mining sector (5%), owing to the remote nature of many of those jobs. It can often be challenging to find people willing to work in the Western Australian outback, and the mining sector has a consistently high vacancy rate. Vacancies are also elevated across accommodation & food services (3.7%), professional services (3.5%) and utilities (3.4%).
Some key industries, such as healthcare & social assistance (current vacancy rate of 2.9%, compared to longer-term averages of 1.2%) and education & training (1.2%, compared to 0.5%) still have a vacancy rate that is more than double its 2010 to 2019 average. And in the case of the utilities industry, the current vacancy rate of 3.4% is 3.5 times higher than its pre-pandemic average. Widespread talent shortages in these key areas can leave a lasting impact on service provision and quality.
Labour supply rose considerably in 2023
In 2023, Australian employers benefited not only from less competition for talent as the number of openings and postings fell, but also by rapid population growth. Australia’s population aged 15 and over increased by 3% over the past year, almost double its pre-pandemic growth rate and higher than at any point in the past 45 years.
Since the natural rate of population growth driven by births and deaths is pretty constant year-to-year, last year’s net population increase was driven primarily by immigration and was concentrated among the under-45 crowd. The population of those aged 15-24 grew 5.2% year-year in 2023, 4.7% for those aged 25-34, and 3.4% for those aged 35-44.
The surge in population growth partly reflects people returning to Australia after the pandemic but also an intentional decision to increase immigration to address widespread skill shortages. The impact of those policy choices will fade over the course of this year, leading to a lower level of population growth which is more consistent with historical trends.
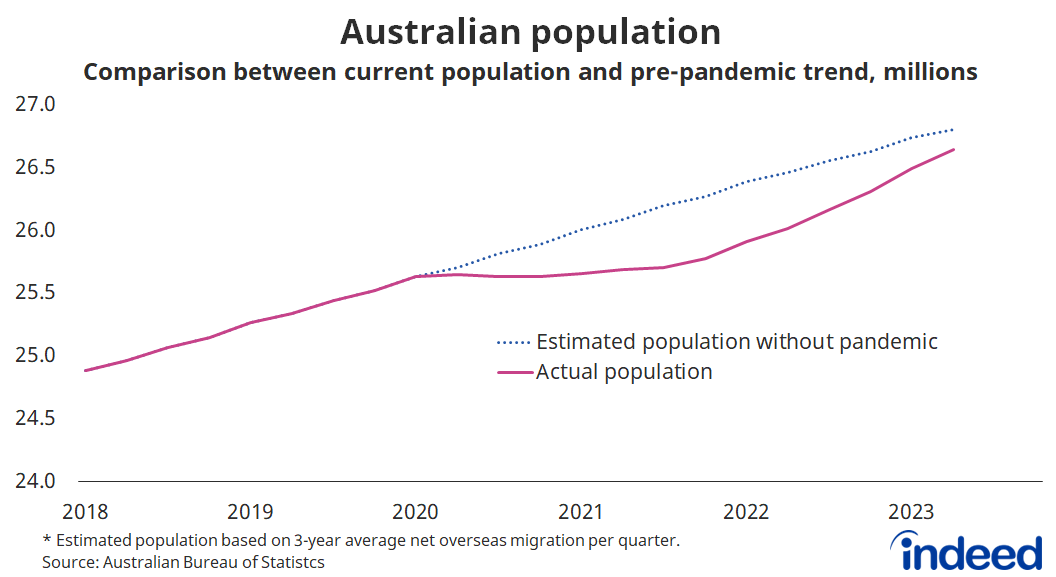
Strong population growth has helped to close the population gap that emerged due to lengthy border closures during the pandemic. At its worst, towards the end of 2021, there were around 500,000 fewer people in Australia than there would have been had the pandemic never taken place.
That population “deficit” contributed to widespread recruitment challenges in 2023, particularly in Victoria and New South Wales. There simply weren’t enough people to fill all the job opportunities that were being created. But that population gap had narrowed to around 165,000 by the June quarter of 2023 and likely closed completely by the end of 2023.
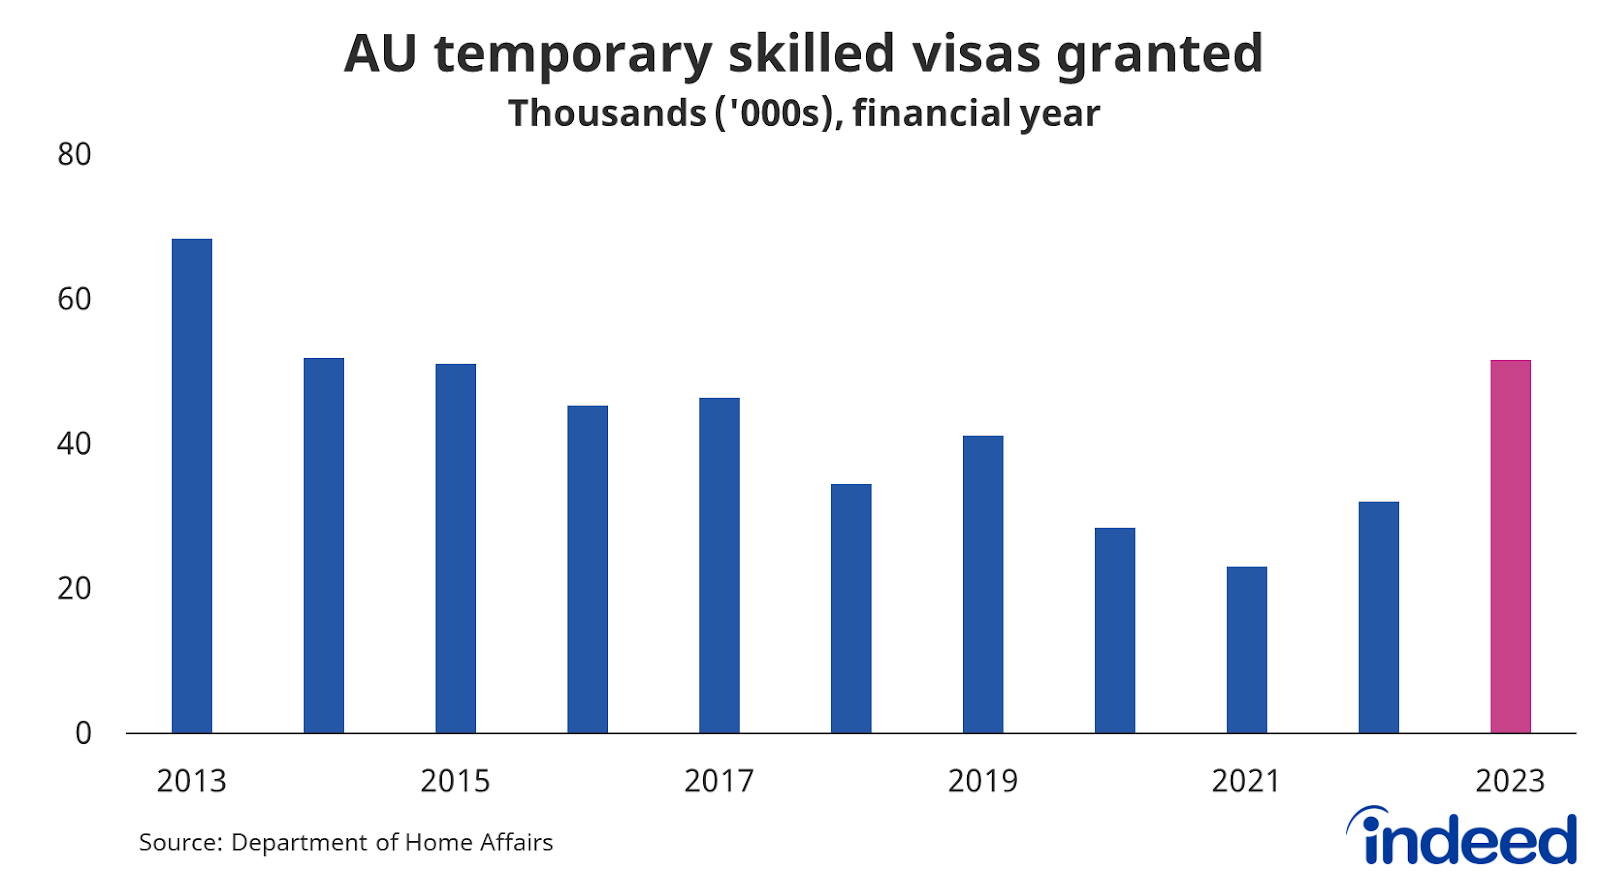
Another positive for recruitment has been the growing number of temporary skilled visas granted. In the 2022-23 financial year, the number of temporary skilled visas granted reached its highest level in nine years. These visas are most common for occupations including software engineer (5.7% of visas granted), chef (4.7%), ICT business analyst (3.7%), resident medical officer (3.7%) and developer programmer (2.7%).
Conclusion
Australia’s labour market remains tight, but not as tight as it was a year ago. We expect job vacancies and job postings to continue to ease, consistent with softer economic growth and a challenging economic environment. We also expect high immigration to continue to help address skill shortages, even as migration levels are likely to normalise throughout 2024. Population is no longer a major impediment to finding talent, with the population gap created by the pandemic largely closed.
Australia’s unemployment rate is likely to gradually rise, with the Reserve Bank of Australia forecasting a rate of 4.2% by the end of the year. That’s a healthy number by historical standards — objectively still very tight — but still a notable increase from the unemployment rates achieved throughout 2022 and 2023.
Methodology
All job postings figures in this blog post are the index of seasonally-adjusted Australian job postings on Indeed re-based to February 1, 2020, using a seven-day trailing average. February 1, 2020, is our pre-pandemic baseline. We seasonally adjust each series based on historical patterns in 2017, 2018, and 2019. Each series, including the national trend, occupational sectors, and sub-national geographies, is seasonally adjusted separately.
The number of job postings on Indeed, whether related to paid or unpaid job solicitations, is not indicative of potential revenue or earnings of Indeed, which comprises a significant percentage of the HR Technology segment of its parent company, Recruit Holdings Co., Ltd. Job posting numbers are provided for information purposes only and should not be viewed as an indicator of performance of Indeed or Recruit. Please refer to the Recruit Holdings investor relations website and regulatory filings in Japan for more detailed information on revenue generation by Recruit’s HR Technology segment.
Other measures of labour market conditions were obtained from the various reports published by the Australian Bureau of Statistics.