
Key points:
- Low wage growth in Australia largely reflects poor corporate performance following the end of the commodity price boom and an increase in the labour force underutilisation rate.
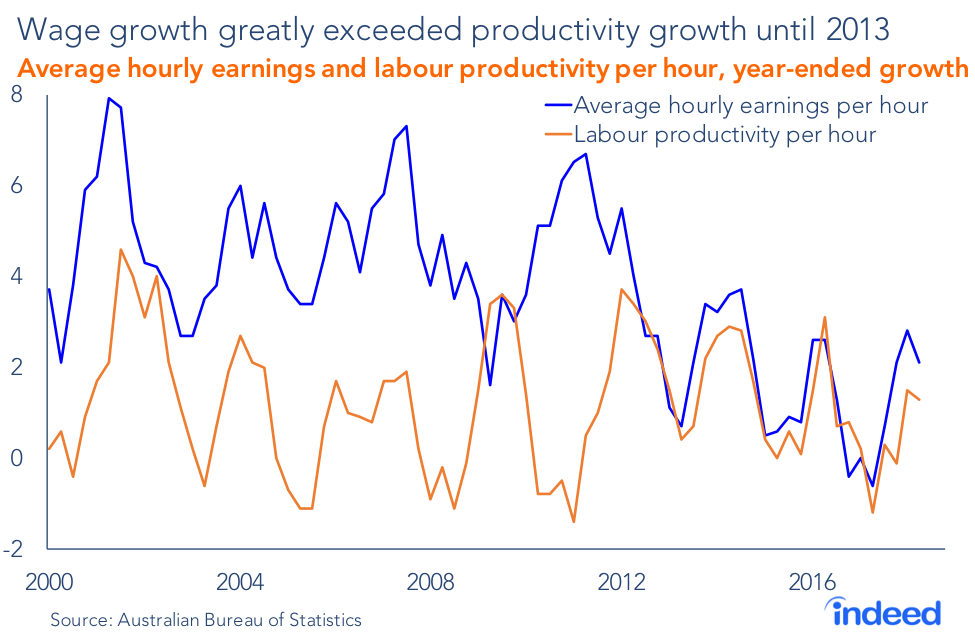
- Australian wages grew much faster than productivity during the commodity boom, amplified by a strong Australian dollar that left many businesses uncompetitive.
- Recent wage growth appears less sensitive to improvements in the underutilisation rate, perhaps due to reduced bargaining power or lower wage expectations on the part of workers and employers. This suggests that future wage growth may be lower than in previous economic upswings.
Soft wage growth has been a notable feature of the Australian economy over the past decade, particularly during the past five years. The underlying cause was a once-in-a-lifetime commodity price boom that distorted the Australian labour market, pushing wages far higher than could be justified by worker productivity gains. Many Australian businesses were softened up by the global financial crisis, and left uncompetitive and vulnerable when commodity prices collapsed in 2013.
In this post, we compare current trends with 2009 and 2013. The former represents the beginning of the corporate downturn in Australia — a long period in which Australian businesses have underperformed. The latter is when commodity prices collapsed, undermining Australian businesses and forcing wage growth lower.
Although the end of the commodity price boom ushered in a period of lower wage growth, the speed and size of the adjustment reflects deregulation of the Australian labour market. Declining rates of unionisation created a more flexible environment, allowing wage growth to adjust to softer economic conditions. This saved thousands of jobs during the downturn, when many businesses faced a tradeoff between raising pay or laying staff off.
A more flexible labour market and reduced union power may be an impediment to higher wage growth in the future. As business conditions improve, there is evidence that wages have become less sensitive to labour market improvements. In the future, wage growth may be lower than Australian workers were once accustomed to. And reduced bargaining power suggests that workers will be able to do little about it. Indeed, if the commodity price boom hadn’t occurred, Australia may have shifted to a low-wage environment sooner, as have other advanced economies.
1. Introduction
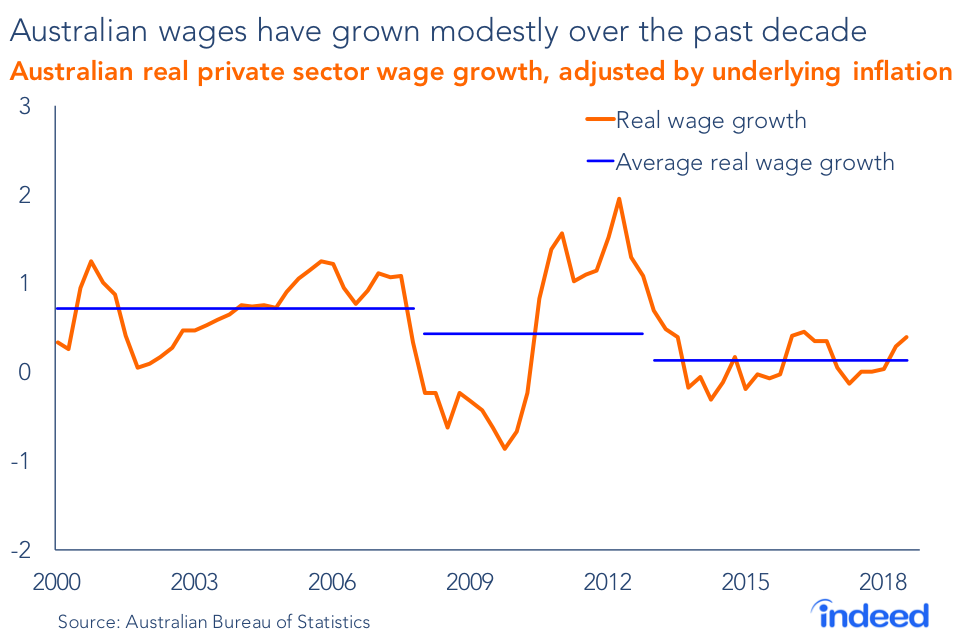
After accounting for inflation, Australian wages have barely changed over the past five years. Annual real wage growth from 2000 to 2007 averaged 0.7%, easing to 0.4% from 2008 to 2012. Over the past five years, it has been just 0.1%. Every state and industry has been affected, and recent improvement has been modest.
Low wage growth is not unique to Australia. It has occurred in a range of advanced economies, suggesting common causes. Among them have been structural factors, including soft productivity growth and declining rates of unionisation. But Australia had a unique cyclical trigger — the end of the commodity price boom in 2013 — which amplified the impact of the global financial crisis on Australian businesses. The financial crisis and the end of the commodity price boom pushed wage growth lower. Structural factors, such as lower rates of unionisation, may keep them there.
We examined a range of labour market data to assess the causes of Australia’s poor wage performance over the past decade. We found a wide-ranging mix of cyclical and structural factors:
Cyclical factors:
- Wage gains decoupled from productivity growth during the commodity price boom. Amid the flush of commodity-fed prosperity, labour costs and the Australian dollar rose sharply vis-a-vis our major trading partners, leaving Australian businesses vulnerable when commodity markets turned.
- Australian corporations have struggled over the past decade, particularly since the end of the commodity price boom in 2013. That has reduced their capacity to pay higher wages. And it has led to a tradeoff between wage growth and employment.
- High unemployment created stiff competition among workers, amplified by high immigration. This placed further pressure on wages. Although the unemployment rate has since improved, broader measures such as the underutilisation rate remain elevated, keeping downward pressure on wages.
Structural factors:
- Industrial relations reform has reduced employee bargaining power, including the capacity to strike. With workers now less able to influence pay, the burden of an economic downturn is increasingly felt through lower wage growth and shorter hours rather than via sacking staff.
- Changes in the industry mix of Australian unemployment, including an increased share of workers in lower-income jobs, have reduced average national wages by around 0.5% since 2013. Growth has primarily been in the service sector, where productivity gains are relatively low. By contrast, the ageing of Australia’s population has had only a modest impact on wage growth.
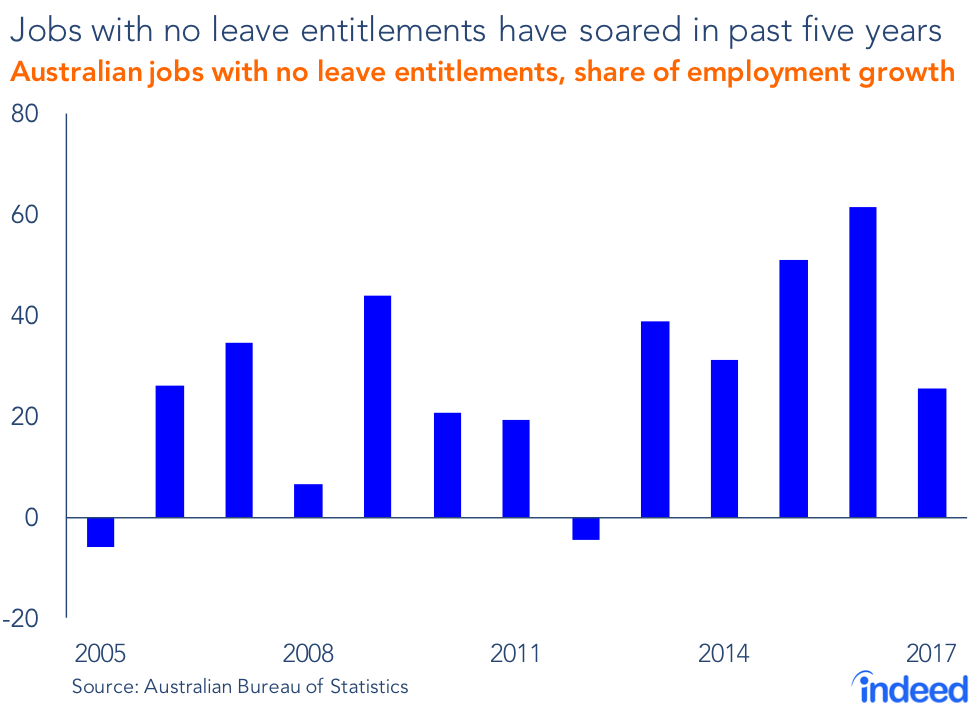
- Part-time employment has accounted for 45% of employment growth since 2013. There has also been a surge in jobs without leave entitlements. These workers have little ability to negotiate higher wages and better working conditions.
2. Australian wages rose too high too quickly
Australia’s high-wage environment has been both a blessing and a curse for businesses. On the one hand, though some workers have been left behind or been weighed down by housing costs, many Australians have more money to buy goods and services. They can easily afford new TVs or iPhones, eat at the trendiest restaurants or clothe themselves in the latest fashions. On the other hand, highly paid staff can erode profits and make it difficult to compete globally, restraining wage growth and forcing staff cutbacks.
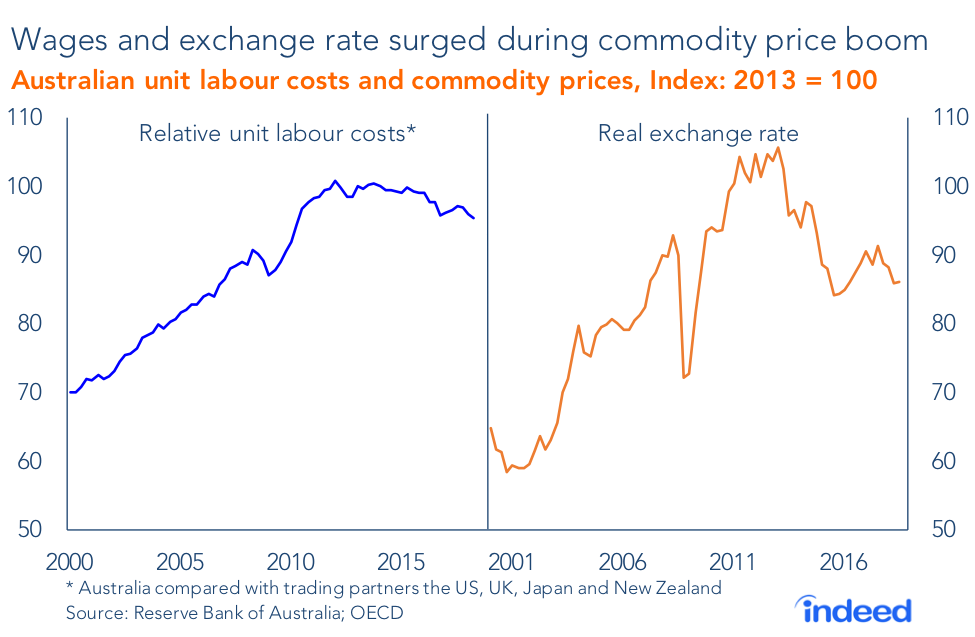
From 2003 to 2013, Australian businesses came under pressure on two fronts, both originating from the surge in commodity prices. Competition for workers, largely driven by the mining boom in Western Australia and Queensland, pushed wages up — not just for the mining sector, but across the board. Unit labour costs — which measure the cost of labour per unit of output — rose 33% against our advanced trading partners.
Meanwhile, Australia’s real exchange rate — which adjusts the standard exchange rate for inflation — rose 67% from 2003 until its peak in early 2013. Australian products became significantly more expensive than their foreign equivalents. At its peak, the real exchange rate was around 80% higher than in 2000, creating an operating environment that was not just challenging, but also unpredictable.
The commodity price boom and subsequent bust go some way in explaining Australia’s current predicament. Wage growth during the boom wasn’t supported by productivity improvements and was well above sustainable levels. When commodity prices began to fall, beginning in 2011, but more rapidly in 2013, this house of cards collapsed. Income dried up and businesses were forced to cut costs. And it’s difficult to trim expenses without addressing wages.
Since 2013, Australia’s relative unit labour costs and real exchange rate have gradually declined, improving the Australian business sector’s competitiveness. That is creating an environment in which wage growth can finally improve.
3. Australia’s corporate performance has been poor
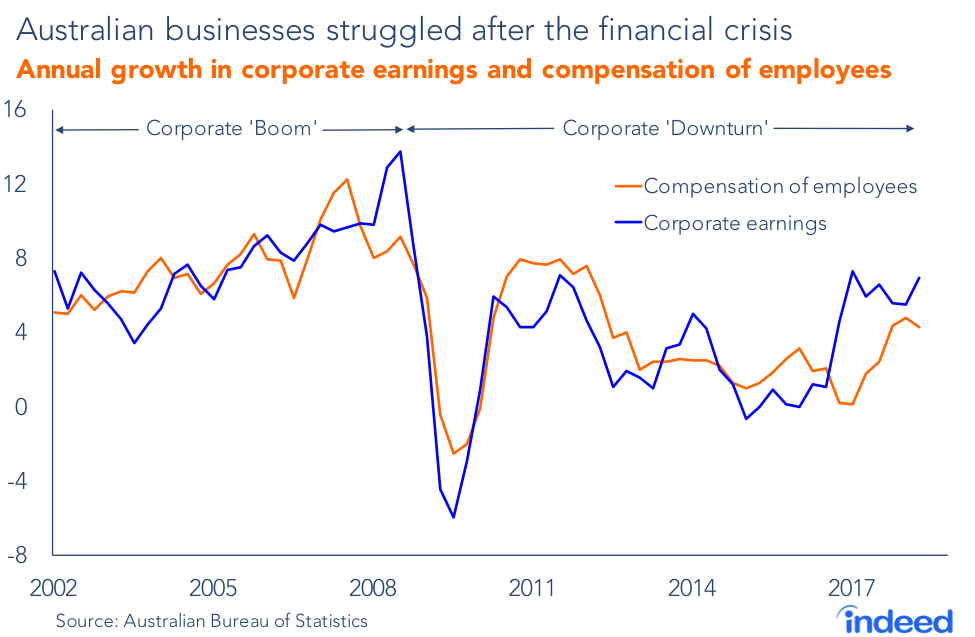
The Australian corporate sector has gone through two key periods since 2000: the 2001-08 boom and the 2009-2018 downturn. The first occurred in a strong economic environment, including rising commodity prices. The second began with the global financial crisis, leading to the collapse of commodity prices in 2013. This period lingers to this day.
In Australia, corporate earnings growth and corporate spending on wages and salaries are highly correlated. Until recently, strong corporate earnings growth was typically associated with strong wage growth Weak earnings growth was associated with weak wage growth.
Since 2001, corporate earnings growth across Australia has averaged almost 5% a year. The total amount spent on employee wages also rose 5% a year during the period. But corporate earnings and wages behaved differently during the boom and the downturn. In the boom period, wages and earnings rose 6.3%. In the downturn, they rose around 3.7%.
In fact, during much of the downturn, wage growth exceeded corporate earnings growth, squeezing profits. Since the beginning of 2017, businesses have managed to claw back some of that lost ground thanks to an unexpected spike in earnings. Eventually, Australian businesses began to increase payrolls, leading to strong employment growth over the past 18 months.
Australian businesses are now experiencing their best conditions in a decade and are flush with cash. This has led to a clamour for this newfound wealth to be shared. So, what explains the divergence between wages and earnings over the past 18 months?
First, the improvement in corporate earnings was unexpected. Many businesses believed the improvement was temporary. Second, employees have lost bargaining power. Higher unemployment and dwindling rates of unionisation have left many employees with little leverage to press for higher pay. Third, some corporations took the opportunity to improve their financial standing following years in which wages grew faster than earnings. Fourth, some companies may have felt pressure to maintain or even increase dividends… Dividend payout ratios in Australia are higher than in other advanced economies.
The global financial crisis constrained the income of many Australian businesses. Given the relationship between wage growth and corporate earnings, those businesses were ill-equipped to boost pay. Delivering higher wages would have come at a cost — higher unemployment — because of the tradeoff between paying employees more or laying some of them off. Thus, lower wage growth kept thousands of Australians employees.
4. The relationship between wage growth and unemployment has flattened
An analysis of wage growth would hardly be complete without exploring the relationship between wage growth and unemployment.
In Australia, wage growth is highly correlated with changes in the underutilisation rate, a broad measure of unemployment that includes not only those who are unemployed, but also those who are employed but seek more hours. The relationship between the two is very different during periods of economic strength and periods of weakness. Wage growth tends to be more sensitive to changes in the underutilisation rate during a downturn than during a boom.
When the economy strengthened between 1999 and 2008, a 1 percentage point decline in the underutilisation rate typically led to a 0.4 percentage point increase in wage growth. As the economy deteriorated, a 1 percentage point increase in the underutilisation rate pushed wages on average 0.7 percentage point lower.
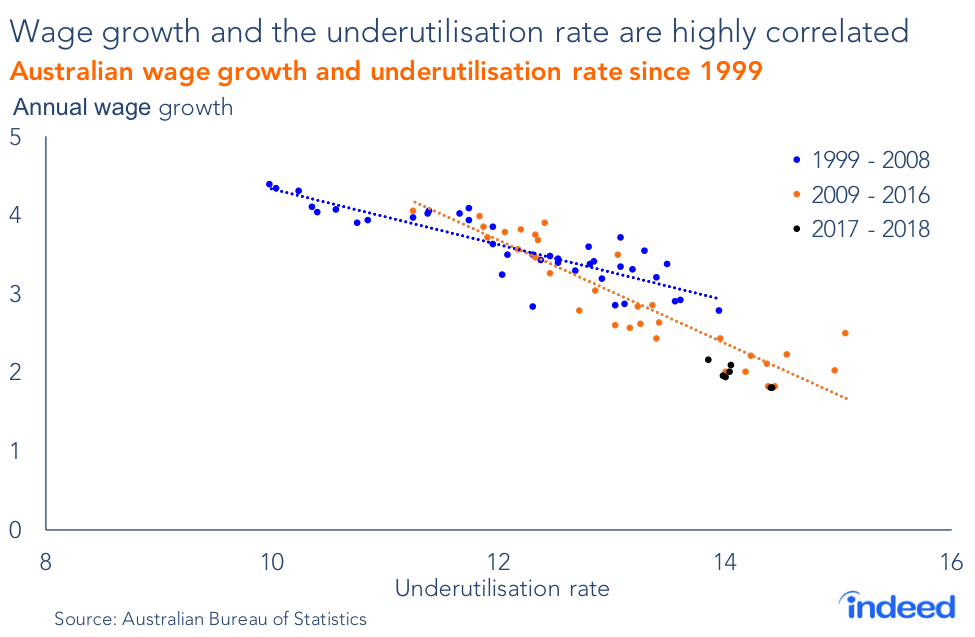
Since the beginning of 2017, labour market conditions have improved. Employment growth has been strong and the underutilisation rate has tumbled to its lowest level in almost five years. Yet wages have responded poorly. The relationship between wage growth and underutilisation appears to have flattened a little, suggesting that wage growth during the upswing will be lower than Australian workers have been accustomed to.
Expectations and declining unionisation underpin this development. Low wage growth has been so persistent that employees and unions may now negotiate wages with low expectations. It appears that they anticipate they will receive a small bump in pay and adjust their bargaining positions accordingly. Unions also lack the influence they once had and have only limited capacity to push back against powerful employers.
5. Unionisation rates have tumbled, reducing employee bargaining power
Labour market deregulation, pursued through the 1990s and 2000s, may also explain the evolving relationship between wage growth and the underutilisation rate. Previous downturns created widespread unemployment. But our most recent downturn primarily hit wages. The tradeoff between wages and employment has shifted in favour of employment.
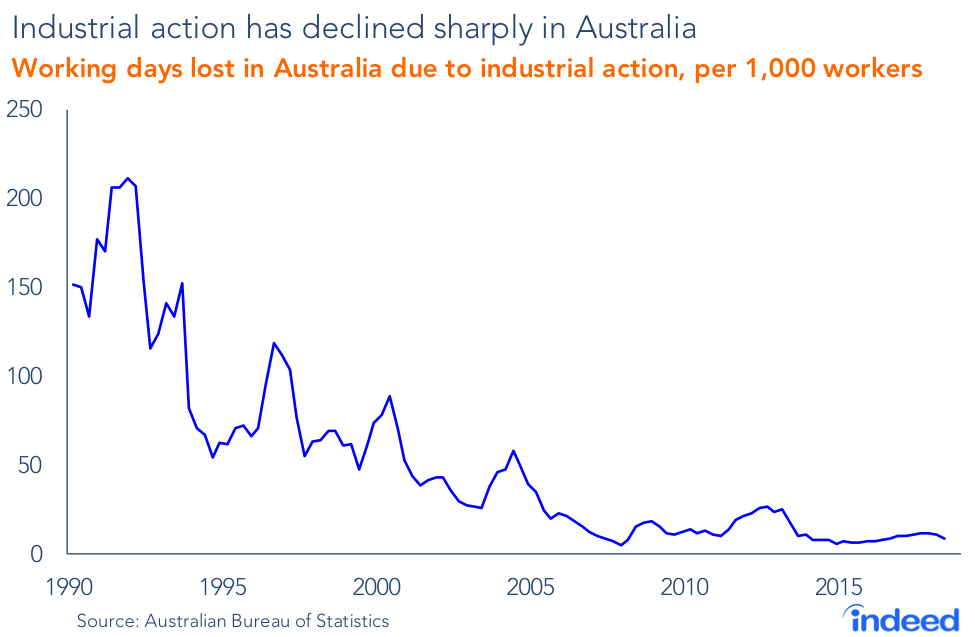
A key reason is the declining strength of the union movement. Union membership has tumbled in recent decades, accounting for just 14.5% of the workforce in 2016 compared with around one-quarter in 2001. And the number of days lost because of industrial action has fallen three-quarters since 2001.
Union membership and industrial action have declined primarily for two reasons. First, employment has shifted away from blue-collar work toward the service sector, which has historically had a smaller share unionised workers. Second, a concerted political movement has pushed to liberalise the Australian labour market. This was most famously represented by the passage of the ill-fated WorkChoices legislation in 2005.
Decentralisation of wage negotiations is hardly unique to Australia. The United States is known for forcing workers to fend for themselves, while decentralisation in Germany has shifted negotiations from the sectoral level down to the employer or individual level. Both countries have struggled to boost wage growth despite tighter labour markets than Australia’s.
Employees’ reduced bargaining power has made wages more flexible, saving jobs during the downturn. Yet, as conditions improve, that loss of bargaining power stands in the way of a sustained improvement in wages. A recent cross country study by the Reserve Bank of Australia estimated that a 1 percentage point decline in the rate of unionisation lowered wage growth the following year by almost 0.3 percentage point.
Another important factor is the relative power of employers themselves. Powerful employers are often in a strong bargaining position regardless of economic climate. Their strong position helps them contain wages when conditions are tight. It also allows them to take advantage of worker insecurity when conditions deteriorate.
Employer power can be assessed by degree of market concentration. Everyone can identify Australian businesses that dominate their respective industries — think Coles and Woolworths, the major four banks and big miners such as BHP Billiton and Rio Tinto. Yet market concentration in most Australian industries does not appear unusual compared with other advanced economies. Furthermore, the degree of concentration has waned over the past decade. The revenues of the 100 largest Australian companies have fallen as a share of GDP. Global competition may also reduce the relative power of large Australian employers.
Nevertheless, dwindling unionisation puts large employers in a better position to wield their power. This has been amplified by changes in work practices. Since 2013, 45% of employment growth has been in part-time jobs, while positions with no leave entitlements account for 43% of growth, both well above their historical levels. These workers generally have limited rights and bargaining power, and they can be easy pickings for a hard-nosed employer.
6. Structural change is weighing on wage growth
The ageing of Australia’s population and the blurring of traditional gender roles have transformed the Australian workforce. Yet the ageing of the Australian workforce has not made much difference to aggregate wages over the past five years. The changing age profile of Australia’s workforce has cut the national average wage by just 0.1% or $48 a year. Older workers typically earn less than workers between 25 and 54 because a higher share of them are in part-time roles. However, this has been offset by much stronger wage growth among older workers.
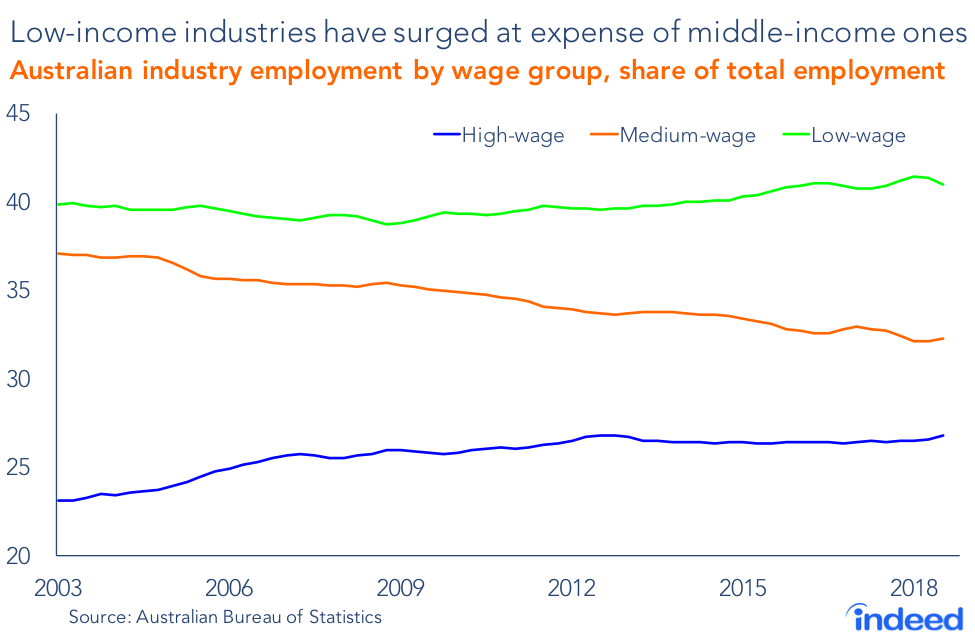
A more important structural change has been to the industry mix. Had Australia’s industry mix been unchanged since 2013, annual wages would have been around 0.5%, or $352, higher in 2018, according to Indeed estimates. Low-wage industries account for 41% of employment, from a little under 40% five years ago, reflecting a surge in jobs in healthcare and social assistance, and in hospitality. By comparison, the share of employment in middle-income industries has steadily declined over the past 15 years.
Industry wage growth has partly offset the impact of the changing industry mix. Since 2013, wage growth has risen 2.3% a year in low-wage industries, 1.9% in middle-income industries and 1.2% in high-wage industries.
Changes in the average size of Australian businesses and the number of government employees have also weighed on wage growth. A higher share of the Australian workforce is employed by small business, where wages tend to be lower. The public sector, where wage growth has been higher, have cut staff.
Technology has also transformed the Australian workplace. Technological change underpins many of the structural shifts cited in this report, generating rapid growth in some industries, allowing workers to remain in the workforce longer, creating greater competition, particularly from overseas, and facilitating the increasing shift towards part-time work, according to a recent Reserve Bank of Australia research paper. .
Unlike the cyclical factors holding wage growth down, these structural factors will continue to weigh on worker pay for the foreseeable future. The Australian population is getting older and the underperformance of middle-income roles shows little sign of abating. Technological change is unrelenting. The demand for workers in healthcare and social assistance, typically for lower-income jobs, will continue to surge. New opportunities in some middle-income roles, such as manufacturing and wholesale trade, will be few and far between.
7. Conclusion
Australia’s wage problem began with the global financial crisis, which softened up Australian businesses and came to a head when commodity prices collapsed in 2013. The past five years have been an exercise in frustration for many Australian workers. But weak wage growth largely reflects the difficult economic environment Australian businesses were confronted with.
A more-flexible labour market and reduced union power have allowed wages to adjust to new economic circumstances. Lower wage growth since 2013 has saved thousands of jobs and helped contain the economic fallout from the collapse in commodity prices.
But the same forces that saved jobs during the downturn may now be an impediment to higher wages in the future. Dwindling unionisation and lower wage expectations on the part of both workers and employers will actively crimp wage growth in the future. Reduced bargaining power has left workers without leverage during pay negotiations. Early evidence indicates that wage growth in the future is unlikely to reach the level that was considered normal before the global financial crisis. Indeed, we anticipate that, even in a tight labour market, wages may struggle to exceed 3%.
Methodology
This research post utilises several wage measures.
The wage price index (WPI) is the most commonly cited wage measure in Australia. This measure tracks change in wages and salaries over time, but controls for changes in the quality or quantity of work performed and changes in the characteristics of the job occupant. It offers the clearest indication of underlying wage growth.
Other measures used are average weekly earnings and compensation of employees. The former reflects the average weekly earnings for an individual and the latter refers to total amount spent on wages and salaries by Australian corporations. Unlikely the WPI, these measures fluctuate due to changes in the mix of industries or occupations or other characteristics of the Australian workforce.
Growth in compensation of employees and corporate earnings are highly correlated. Since 2001, contemporaneous correlation of the two has been 0.6 on a quarterly basis and 0.8 on an annual basis. However, this relationship has weakened since 2009, with an annual contemporaneous correlation of 0.5. This was largely due to an unexpected improvement in corporate earnings since 2017 that wasn’t quickly passed on to employees.
Unit labour costs are compared against such costs in the United States, Japan, the United Kingdom and New Zealand. Ideally, this analysis would have included China, Australia’s largest trading partner, but data limitations made that infeasible. An earlier Reserve Bank of Australia analysis, which included an estimate for China, led to similar results to those found in this report.