
What surprised us: Real, inflation-adjusted wages and salaries for private-sector workers fell for the first time since 2022, dropping 0.4% year-over-year. Private-sector wage growth fell to 3.1% year-over-year in Q2 2026, down from 3.5% a year earlier. Inflation rebounded in the second quarter, driven in part by higher energy prices associated with the conflict in Iran. The combination of softening wages and higher prices is translating into less purchasing power for workers. 
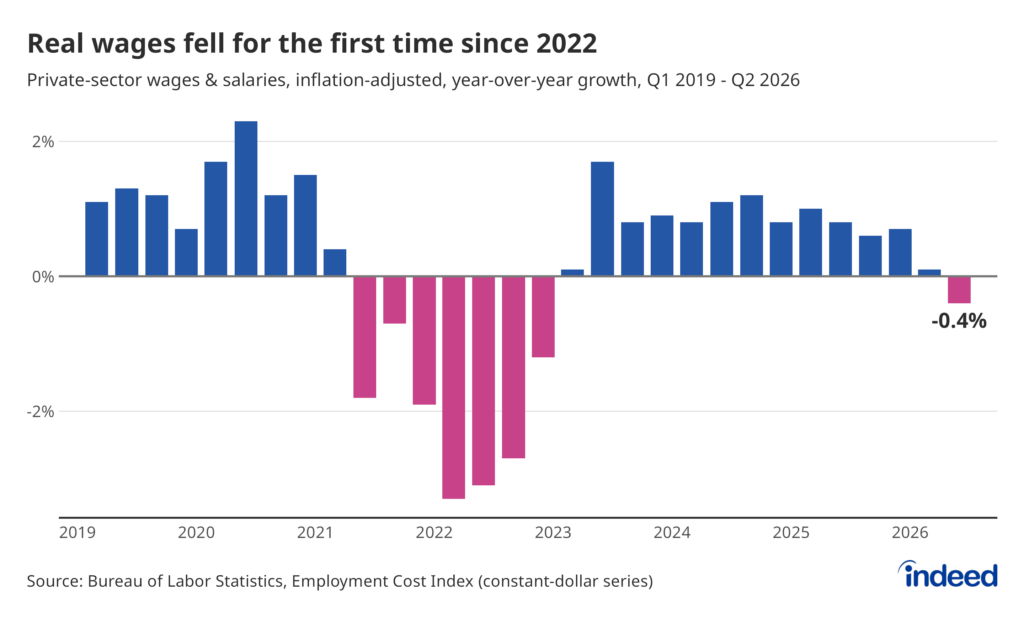
Bar plot titled “Real wages fell for the first time since 2022” shows inflation-adjusted year-over-year growth in private-sector wages and salaries from Q1 2019 to Q2 2026. Real wage growth dropped below zero in the most recent quarter to -0.4%, the first time since Q4 2022.

What Indeed Data Shows: Posted wage growth in the Indeed Wage Tracker was 2.4% in June, about 0.8 points below ECI’s ex-incentive paid series, typically the least volatile wage and salary data. Changes in advertised pay reach new hires before incumbent workers, so the Tracker tends to turn first. Shifting posted wages forward by seven months shows the data tracking the government measure more closely, suggesting more cooling is already in the pipeline.
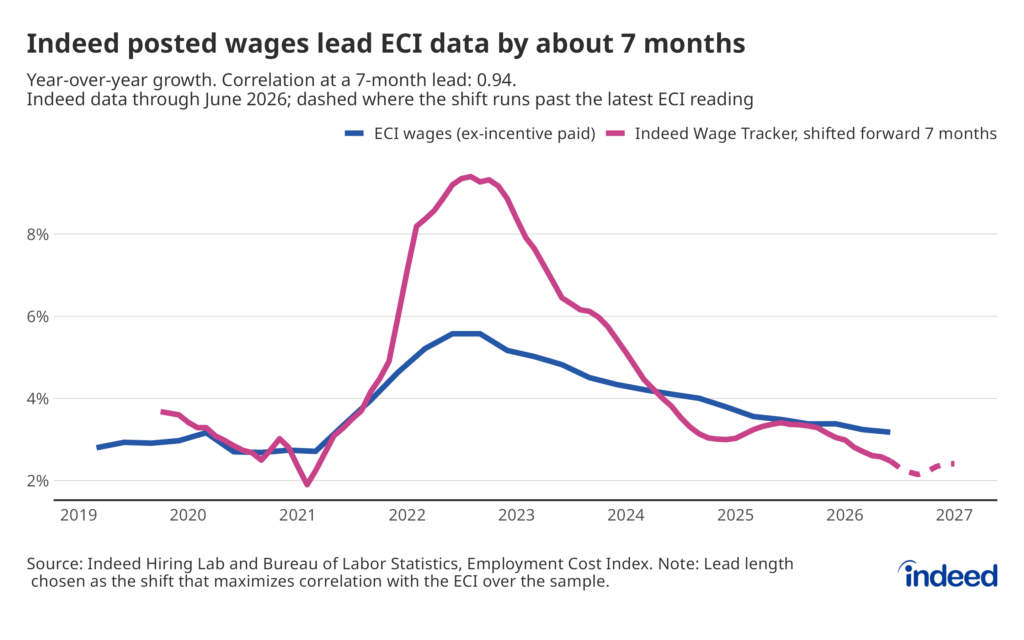
A line chart titled “Indeed posted wages lead ECI data by about 7 months” compares year-over-year growth in the Employment Cost Index for wages and salaries (excluding incentive-paid work) with the Indeed Wage Tracker shifted forward seven months, from 2019 through 2026. A dashed line appears where the shifted Indeed series runs past the latest ECI reading. Once shifted, the two lines tend to track each other well over time. 

What to watch going forward: Whether wage growth across industries keeps converging. The spread between annual wage growth in the fastest (utilities, +4.1%) and slowest-growing (accommodation & food services, +2.6%) industries narrowed to 1.5 percentage points in the second quarter, down from 2.5 points a year ago. The sectors cooling hardest are the ones that were running the hottest – wage growth in transportation and warehousing, real estate and leasing, and accommodation & food services all fell by more than 1 percentage point year-over-year. While some of these moves are fairly large, the fact that they are converging suggests that the uneven post-pandemic winddown, characterized by different industries adjusting wages at different speeds in response to different trends, may be smoothing out. 
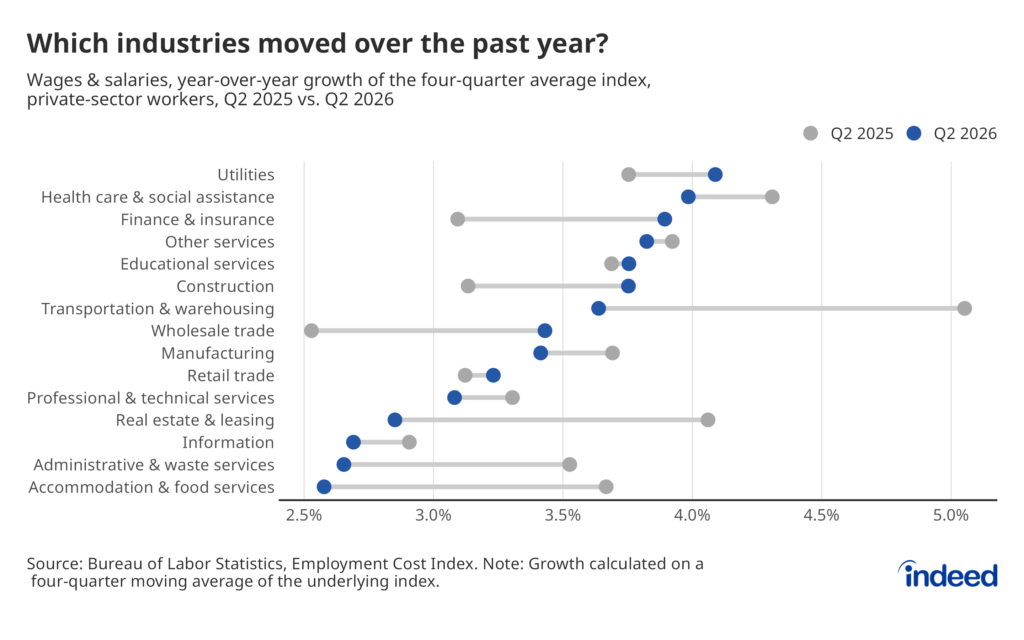
Connected dot plot titled “Which industries moved over the past year?” comparing year-over-year wage and salary growth for private-sector workers by industry, a year apart — the second quarter of 2025 (gray) versus the second quarter of 2026 (blue), using a four-quarter average index.