
Key points:
- In the early 1990s, men held almost 7 million more jobs than women. As of early 2026, that gap had entirely closed.
- In recent months, male employment has contracted while female employment has held steady, suggesting the convergence is still accelerating.
- The gender gap in labor force participation has been declining uninterrupted for decades, and hit its lowest recorded level in February 2026.
Our monthly Labor Market Update examines important trends using Indeed and other labor market data. Our US Labor Market Overview chartbook provides a more comprehensive view of the US labor market. Data from our Job Postings Index — which stood 2.2% above its pre-pandemic baseline as of March 20, 2026 — and the Indeed Wage Tracker (including sector-level data) are regularly updated and can be accessed on our data portal.
For 250 years, simple arithmetic has helped define the US labor market: More jobs are held by men than women. That gap has shaped everything from wage dynamics to sector composition to how employers think about their recruiting pipelines. But that gap is closing, likely faster than most people realize. At this point, it has vanished entirely.
The US added 1.2 million jobs between February 2024 and February 2026, an average of 51,200 jobs a month. A full two-thirds of this growth, some 814,000 jobs, was in jobs held by female workers. Much of this was driven by strength in the health and social assistance subsector, which tends to attract more women, and the relative softness of just about everything else.
Zooming in on the past year highlights an even more uneven distribution. Between February 2025 and February 2026, US employers added a lackluster 156,000 nonfarm payroll jobs, an average of just 13,000 jobs each month. The number of jobs held by men declined on net in 6 of those 12 months, and fell overall by 142,000 jobs over the course of the year. Over the same period, total jobs held by females grew by 298,000 and was negative in only two months. One of those months was October, when the bulk of 2025’s federal layoffs and resignations were recorded in official data. This is not surprising, given that women make up nearly half of civilian federal employment.
Data suggests that what is happening in the labor market is not a short-run fluctuation, but rather the latest chapter in a structural realignment between men and women at work. This realignment will have significant implications for employers, job seekers, and anyone trying to understand where the US labor market is headed.
A gap that took decades to build is disappearing quickly
The male-female employment gap, defined here as the difference in total nonfarm jobs held by men and women, stood at almost 7 million in the early 1990s and reflected decades of labor market history. Women began entering the workforce in meaningful numbers in the 1960s, reducing the gap to 21 million by 1964, when data collection began. However, even 30 years later, men still outnumbered women in total employment by a wide margin.
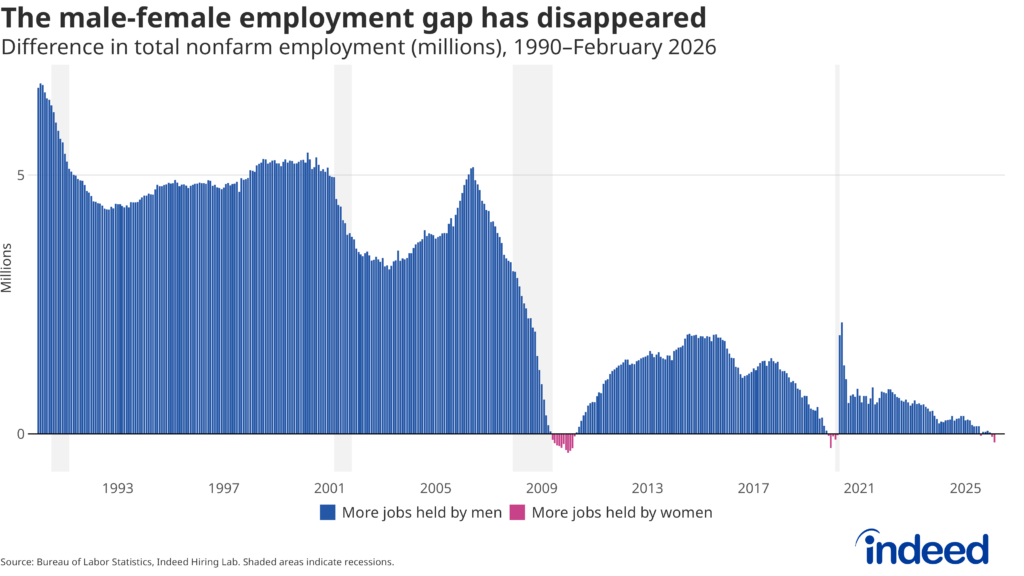
Male-dominated industries, including manufacturing and construction, are notoriously cyclical. When the economy contracts, men get hit harder; when it expands, they recover. Over the decades, the gap tended to erode rapidly during recessions and recover during economic expansions, but never to the level seen before the recession. By the mid-2000s, the gap had narrowed to around 5 million. The Great Recession sharply accelerated the convergence: Male-dominated industries bore the brunt of the downturn, and for a brief period in 2009–2010, more nonfarm jobs were held by women than men for the first time in the historical record.
Then, from 2015 to 2019, an interesting trend emerged: Even without a recession, the gap between the number of jobs held by males and females began to fall considerably. In June 2018, the gap closed to less than 1 million, the first time it had done so outside an economic contraction. The gap continued to narrow through November 2019 and finally reversed again, with women once again holding slightly more jobs than men by the eve of the pandemic.
When COVID-19 shuttered much of the economy in early 2020, women’s employment was impacted more than men’s. This was partially because sectors that tended to employ more women, including hospitality and retail, were more heavily impacted by pandemic-era restrictions. But it was also attributable, in large part, to caregiving roles placed primarily on women as children learned from home and daycare centers closed. The subsequent Covid recovery period restored the male advantage in total jobs held, but only partially. By early 2026, the gap had again closed and reversed (now for the third time), and trends and data related to the topic indicate this is unlikely to shift back in the near future. It took 250 years, but here we are: More jobs are held by women than men in the nonfarm economy, not because of a recession, but because of years of eroding male labor force participation.
The long trend of declining male labor force participation rates
The gender gap in labor force participation — the difference between the share of men and the share of women who are working or actively seeking work — tells us something different from employment counts alone. It controls for population size and is less sensitive to the composition of any given recession. That gap has also been falling steadily for decades. In 1948, when the data series began, the gap between male and female labor force participation rates stood at 54.7 percentage points — 86.7% of men were in the labor force, compared to just 32% of women. This gap closed substantially as women began entering the labor force, and stood at around 19 percentage points by 1990. By the early 2000s, the gap was still around 15 percentage points.
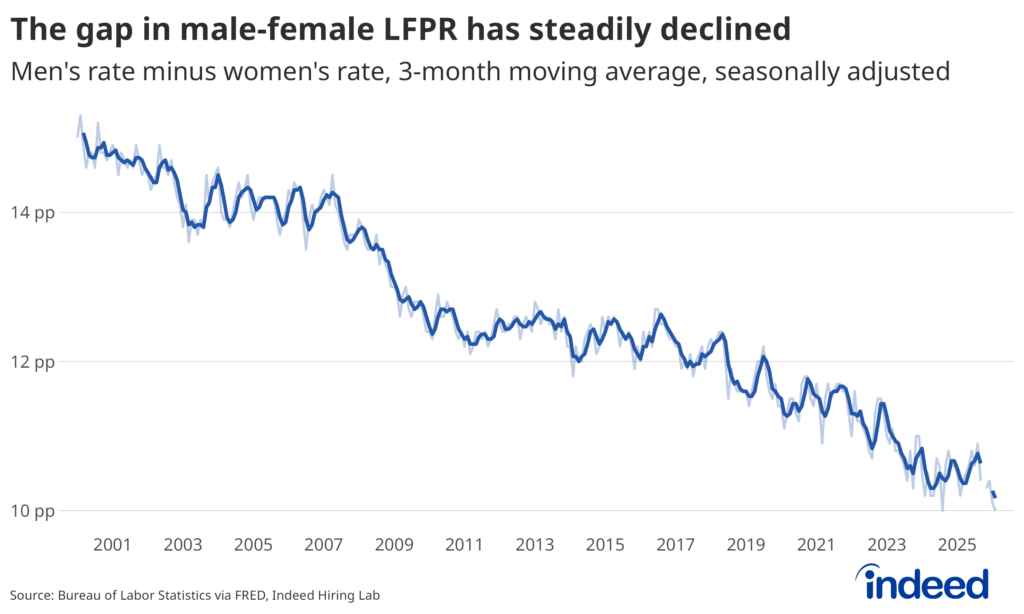
Today, the gap has narrowed to 10 percentage points — a decline of roughly 5 percentage points over 25 years — and reached its lowest recorded level in February. What’s notable is how consistent the descent has been. Unlike the number of men employed in the economy, the labor force participation rate (LFPR) gap shows no post-recession recoveries. Recessions accelerate the narrowing, recoveries slow it, but the underlying trend is negative.
That consistency is the key signal. A gap driven purely by cyclical forces would be expected to widen during expansions as male-dominated sectors rehire. The fact that it doesn’t, that even during the longest economic expansion in US history, the LFPR gap continued to compress, points to something structural. It is also important to note that an increase in female labor force participation has not driven the narrowing of this gap. In fact, both male and female labor force participation rates are lower now than they were in January 2000. But over that time, the female LFPR declined by just 2.8 percentage points (from 60.1% to 57.2%), while the male LFPR fell by 8 points (from 75.1% to 67.2%).
2024 and 2025 were different
A look at monthly jobs added since 2021, broken out by sex, reveals a pandemic recovery that was initially strong for both men and women but has since diverged in ways that reinforce the structural pattern.
Jobs held by both males and females were recovering rapidly as the economy reopened in 2021 and into 2022, with male-held jobs increasing more in most months, consistent with their higher absolute employment levels. Jobs held by men accounted for the majority of the jobs added during this period, but female employment also recovered well.
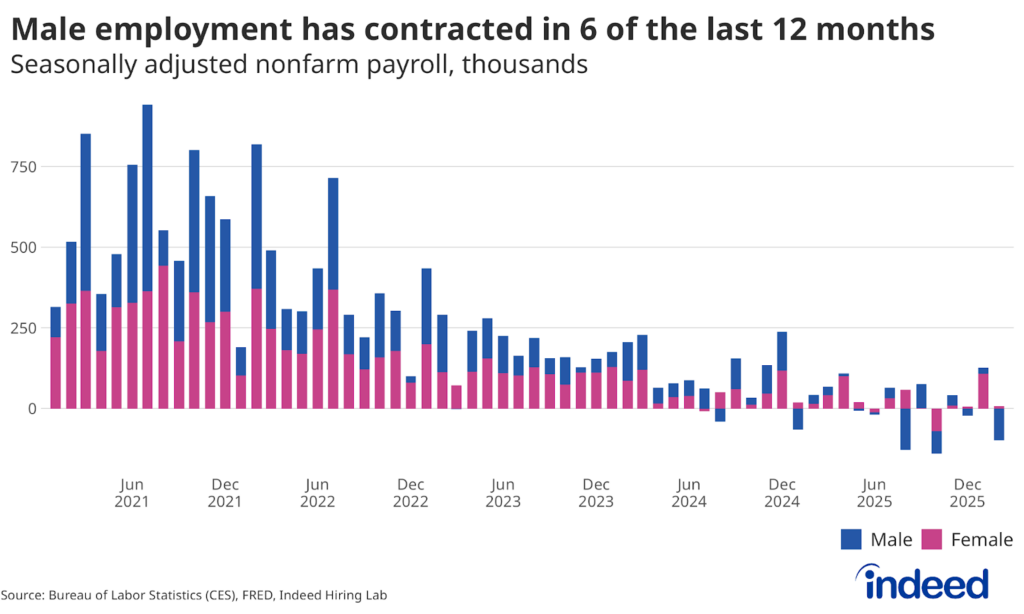
Beginning in 2023, as the market stabilized and job growth slowed, the balance began to shift. Monthly totals fell across the board, as expected in a cooling labor market. But the male share of new jobs became increasingly volatile in 2024, and by late 2025 and into early 2026, jobs held by men have been the primary driver of monthly employment declines. In recent months, male employment has actually contracted while female employment has remained flat or edged up. The labor market is no longer adding male jobs at any meaningful pace, while women’s employment has shown more resilience.
This is consistent with the broader structural story. The sectors that have driven post-pandemic hiring in its final stages, including healthcare, education, and leisure & hospitality, skew female. Some male-concentrated sectors that saw strength in the immediate post-COVID recovery — including manufacturing and information — are now cooling fastest.
Conclusion
At least for now, more jobs are held by women than men in the US nonfarm economy. The LFPR trends show no sign of reversing, and the most recent monthly data suggest men may be losing ground in real time. The gender gap in employment is not disappearing because women have simply entered the workforce in greater numbers. It is disappearing because men are participating less, and that distinction matters enormously for how employers, policymakers, and workforce planners should be thinking about the decade ahead.
For employers, the implications are practical. Recruiting pipelines and workforce assumptions built around a labor market that heavily favors male participation will increasingly misread the available talent pool. In sectors that have historically drawn on male labor — including logistics, skilled trades, and manufacturing — the competition for workers is intensifying not just because of demographic aging but because the underlying male participation rate is structurally weaker than it once was.
Methodology
Data on non-seasonally adjusted Indeed job postings are an index of the number of job postings on a given day, using a seven-day trailing average. February 1, 2020, is our pre-pandemic baseline, so the index is set to 100 on that day. Data for several dates in 2021 and 2022 are missing and were interpolated.
The number of job postings on Indeed.com, whether related to paid or unpaid job solicitations, is not indicative of potential revenue or earnings of Indeed, which comprises a significant percentage of the HR Technology segment of its parent company, Recruit Holdings Co., Ltd. Job posting numbers are provided for information purposes only and should not be viewed as an indicator of performance of Indeed or Recruit. Please refer to the Recruit Holdings investor relations website and regulatory filings in Japan for more detailed information on revenue generation by Recruit’s HR Technology segment.