
Key points:
- Following the post-pandemic inflation surge, real posted wages in the US and UK are currently around their January 2021 levels but are still lagging in Canada and Japan. Performance among euro area countries has been mixed.
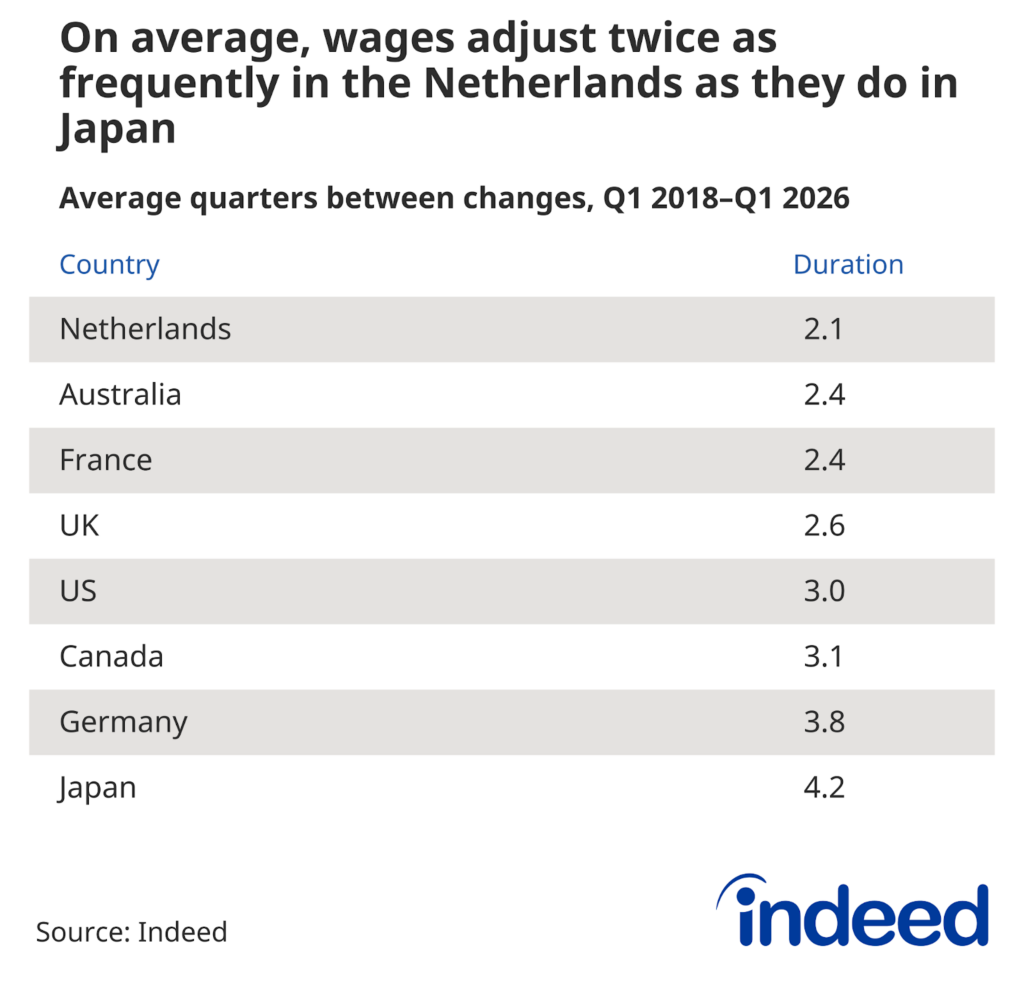
- One reason for the uneven recovery is that advertised wages tend to adjust at different speeds (and by different amounts) across countries — from roughly twice a year in the Netherlands to just once a year in Japan.
- Wage growth is now slowing across major economies, and inflation remains relatively high in many countries, making the remaining gap harder to close — especially in countries where wages tend to adjust slowly and incrementally.
The inflation surge of 2021-23 eroded many workers’ purchasing power across advanced economies as consumer prices rose faster than wages. But the subsequent pace of recovery has been highly uneven, according to an analysis of Indeed Wage Tracker data. In the UK, the purchasing power of advertised wages declined but has broadly returned to its January 2021, pre-shock level, while in the United States, advertised wages largely kept pace with inflation during this period. But in Canada, Japan, and much of the euro area, posted wages are still catching up.
One key factor behind these differences is how often wages adjust, and by how much. Our analysis of wages in job postings across eight major economies over the past eight years shows that advertised wages change more frequently in some countries than in others, ranging from roughly twice per year in the Netherlands to less than once per year in Japan. Because wages are typically reset periodically and in discrete steps, they can take time to adjust in response to shocks. In turn, this friction can be amplified by structural features of the labor market, including local wage-setting practices and collective bargaining. A return to pre-shock purchasing power, which also depends heavily on trends in productivity, can take some time and will vary across countries.
The speed at which advertised wages adjust is useful information for workers and employers alike. For workers who remain in their jobs, awareness of how often advertised pay changes can help decide when to ask for a raise and/or when to seek better pay advertised by a competitor. And in faster-moving markets, employers may need to adjust employee pay more frequently to retain their workforce.
Recovery from the 2021-22 inflation shock has been uneven
To assess whether the purchasing power of posted wages has fully recovered from the 2021-22 inflation surge, we constructed a cumulative real wage index rebased to 100 in January 2021. Values above 100 mean that cumulative, nominal, advertised wage growth has outpaced cumulative inflation since that date, while values below 100 mean workers’ purchasing power is still lower than before the shock.
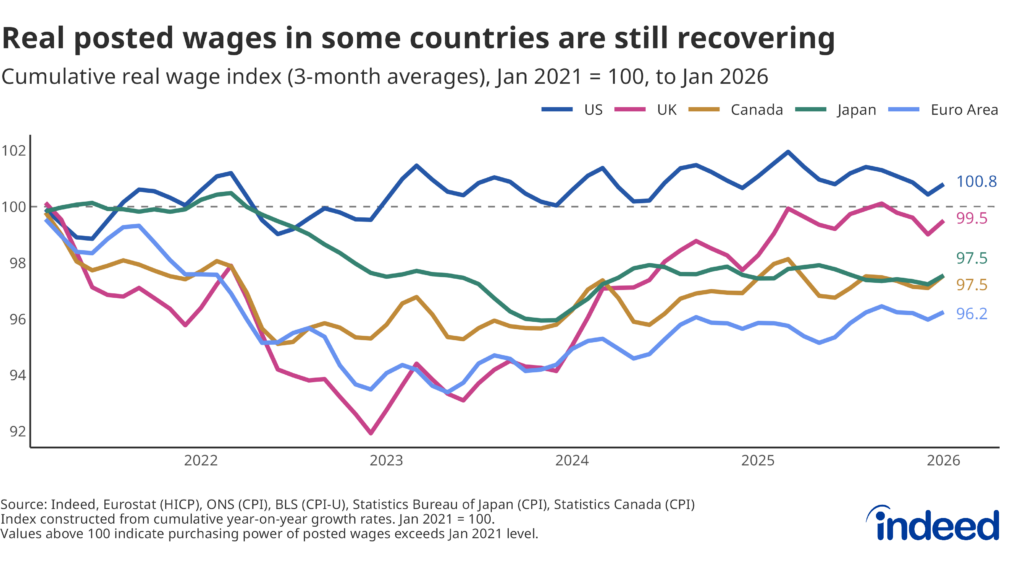
In the US, the real posted wage index stands at about 101 as of January 2026 and has hovered above 100 since early 2023, meaning that growth in posted wages has largely kept pace with growth in prices over the past few years (real wages of all workers, not only new hires, did experience a more V-shaped recovery). In the UK, advertised pay growth is also roughly even with inflation from the past few years, with robust recent wage growth (especially relative to peer economies) helping to gradually close a yawning gap that opened up from 2022 to 2023.
Canada and Japan both sit at 97.5, meaning new hires in both countries still face a purchasing power shortfall of about 2.5 percentage points relative to January 2021. The euro area as a whole remains further behind at 96, indicating that cumulative inflation across the bloc has outstripped cumulative wage growth by 4 percentage points.
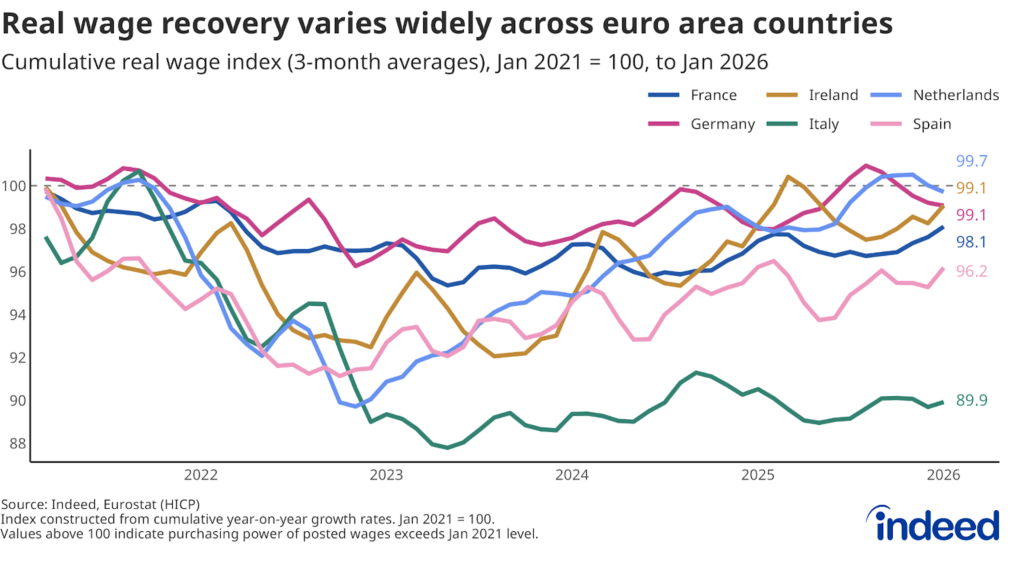
However, the euro area average masks dramatic variation across member countries. The Netherlands (99.7), Germany (99.1), and Ireland (99.1) are close to full recovery, consistent with local wage growth that has exceeded the pace of inflation in recent periods. France (98.1) remains two percentage points short, while Spain (96.2) has further to go. Italy is the clear outlier at 89.9: posted wages there have fallen roughly 10 percentage points behind cumulative inflation, reflecting persistently weak growth in advertised pay. Full recovery is expected to take time.
Wage growth is slowing, making the remaining gaps harder to close
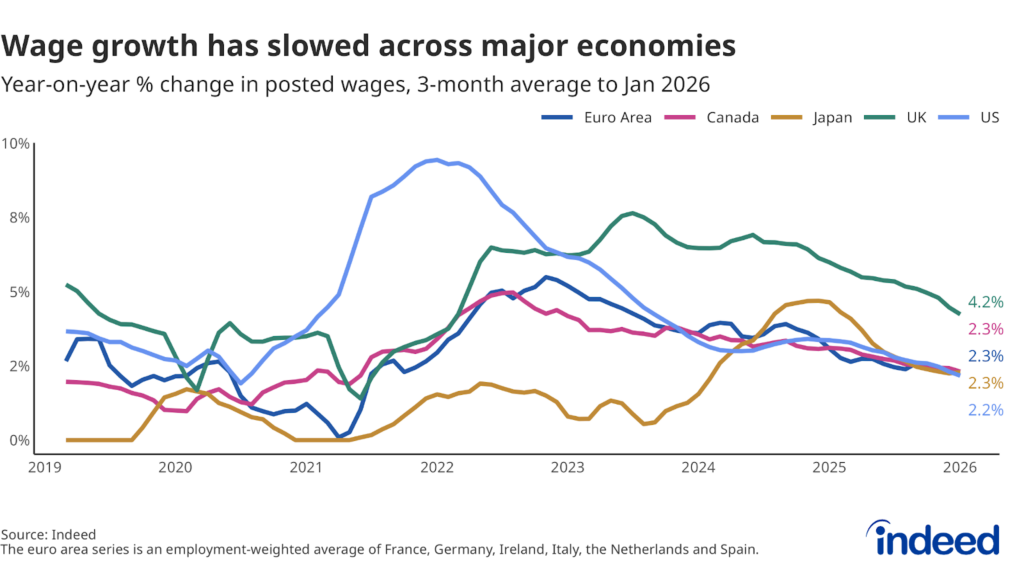
Complicating the picture going forward is the fact that advertised wage growth is slowing, making it harder for those countries that have not yet done so to fully close the wage/inflation gap, depending on what happens with inflation. According to the latest data from the Indeed Wage Tracker, nominal posted wage growth has decelerated in most large economies over the past year. Looking at three-month averages, in the euro area, year-on-year growth in posted wages fell from 3.1% in January 2025 to 2.3% in January 2026. Over the same period, US posted wage growth slowed from 3.4% to 2.2%. Wage growth also slowed from 6.0% to 4.2% in the UK, from 4.6% to 2.3% in Japan, and from 3.1% to 2.3% in Canada.
Fully closing any remaining gaps will depend on whether posted wage growth continues to outpace growth in prices. In several countries, wage growth still comfortably exceeds inflation, meaning the gap should continue to close. But in others, the margin is narrow or has disappeared entirely.
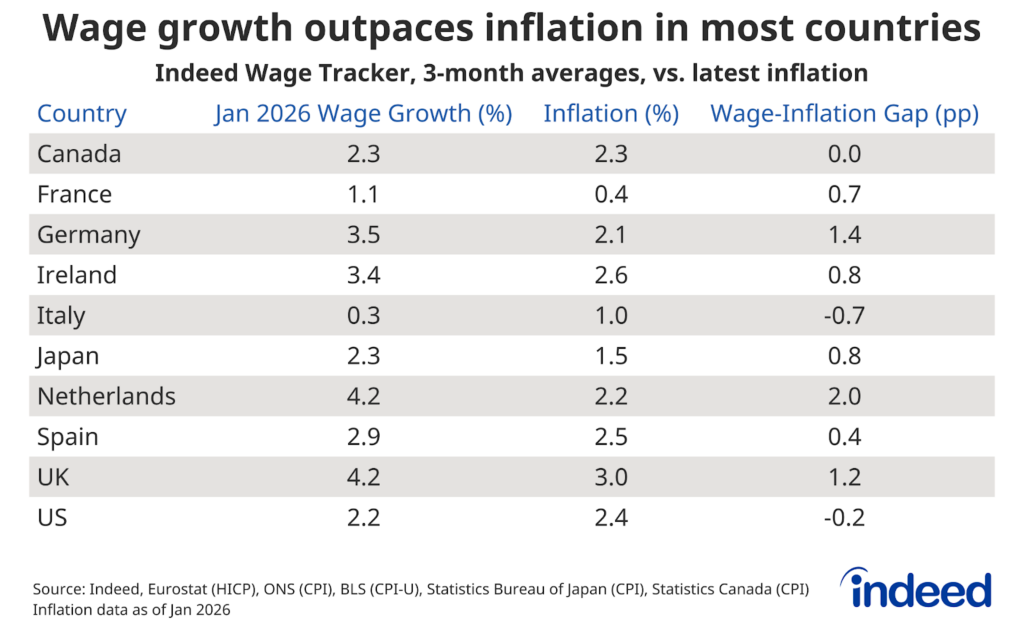
In the Netherlands and Germany, posted wages grew 2.0 and 1.4 percentage points faster, respectively, than consumer prices in the twelve months to January 2026. In Germany, posted wage growth actually accelerated from 2.7% to 3.5% over the past year, likely reflecting the delayed pass-through of wage increases in past collective bargaining agreements. If these trends continue, both countries should complete their real wage recovery soon.
In the UK, wage growth has exceeded inflation by 1.2 percentage points, meaning workers there continue to gain ground despite the UK having the highest inflation rate among the countries tracked. In France, wage growth has slowed to just 1.1%, but inflation is only 0.4%, so real wages are still growing. Similarly, in Japan, posted wage growth narrowly exceeds inflation as well, but with a cumulative 2.5 percentage point shortfall to make up (as shown in the first plot above), this dynamic needs to persist for some time. In Canada, posted wage growth now essentially matches inflation, meaning the gap is no longer closing.
In the US, the pace of posted wage growth has fallen below that of inflation, implying a modest decline in real posted wages. This is a reversal from the real wage gains of 2023-24, though the cumulative real wage index remains just above 100, so the overall purchasing power of posted wages has not yet fallen back below its January 2021 level. In Italy, the outlook is most challenging: posted wage growth of just 0.3% is well below inflation of 1.0%, meaning the already large gap is continuing to widen.
Advertised wages adjust at different speeds across countries
One reason for the uneven recovery might be that wages do not adjust at the same pace in all countries. Some labor markets reprice jobs frequently, while others are much slower to respond.
Wages are “sticky” for several reasons. For instance, contracts and collective bargaining agreements lock in pay for set periods. Firms face costs in monitoring the market and adjusting advertised pay. Employers also worry about fairness between what they offer new hires and what they pay existing staff. Recent research has shown that posted wages track well with actual wages paid to new hires, making the patterns we observe in job postings a meaningful signal of broader wage dynamics.
Using Indeed job postings from 2018 to early 2026 across eight major economies, we tracked posted wage changes for individual jobs — defined as unique combinations of a job title, wage type, firm, and location. For each job — for example, a barista paid by the hour in London at a specific chain of coffee shops — we calculated how long advertised wages stayed constant and how much they changed when they did adjust. We then averaged these results across all jobs in each country.
The differences across countries are substantial. The fastest adjustments happen in the Netherlands, where posted wages change on average once every 2.1 quarters, or roughly twice a year. Posted wages in Australia, France, and the UK also adjust relatively frequently. At the other end of the spectrum, advertised wages in Japan typically stay constant for more than a year before adjusting. The US sits in the middle, with posted wages adjusting roughly once every nine months.
The local pace of inflation is not closely associated with the local frequency of posted wage changes across nations. Instead, structural features of labor markets — including the strength of unions, employment protection laws, and wage-setting institutions — appear to play a larger role.
Occupational composition likely matters too. In the US, posted wages for higher-paying occupations, including software development, data & analytics, and industrial engineering, adjust roughly every two quarters, compared with about every three quarters for lower-paid occupations like retail or driving. Higher-paying roles tend to require more differentiated skill sets. For example, a company might hire a data scientist in one quarter and another the following quarter, but advertise different salaries for each role because of different tasks and responsibilities. Higher-paying roles also offer greater scope for salary negotiation and are less bound by minimum wage constraints. Lower-paid roles, by contrast, are often more standardized, with pay often closely tied to minimum wage floors.
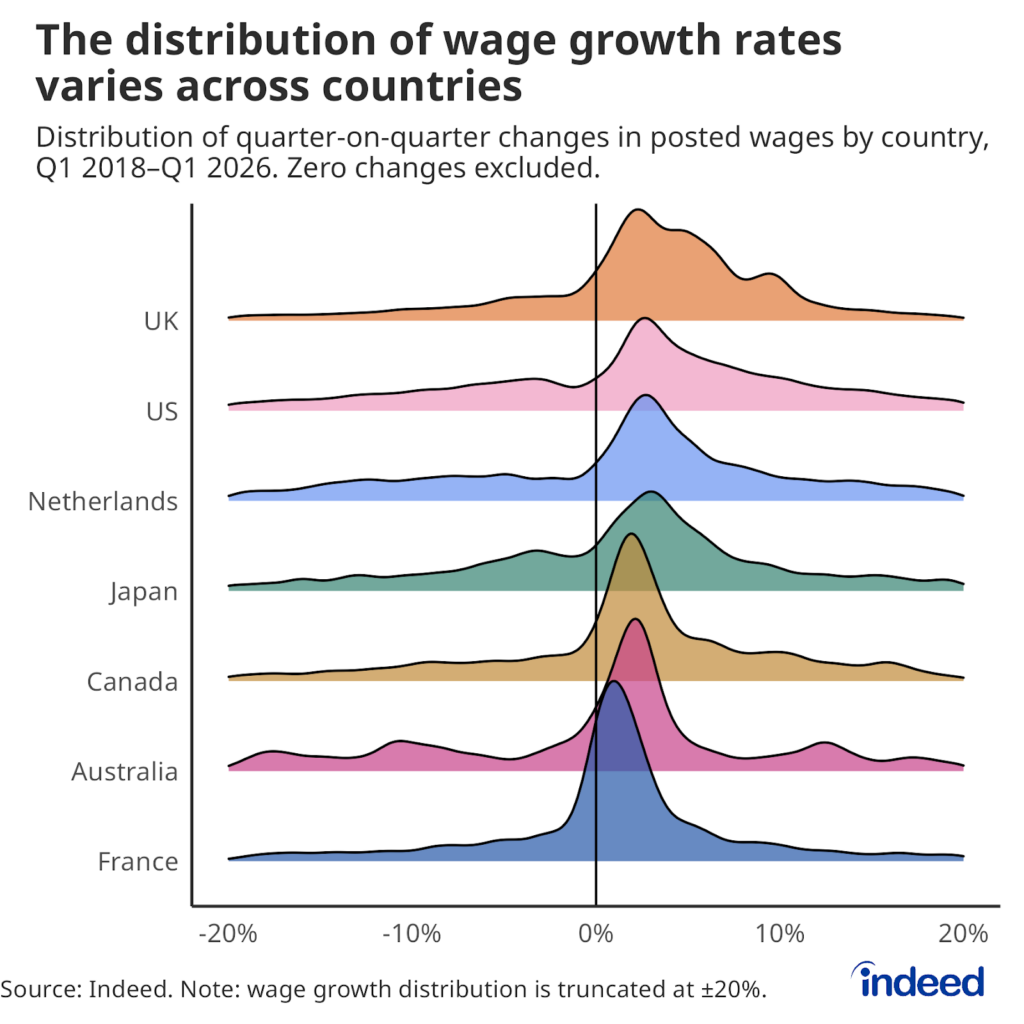
When wages do change, the size of the adjustment varies across countries
It is important to monitor not only how often wages change, but also by how much. The UK has had the highest posted wage growth during our study period, followed closely by the US, while France had the lowest median wage growth. But the dispersion of those changes has differed widely. The UK shows a broad spread of wage adjustments, with some large jumps and some small ones. In France, by contrast, wages tend to change in smaller, more predictable increments. In all countries, posted wages were more likely to adjust upward, but downward revisions were also fairly common.
This compounds the differences in frequency. In a country like France, where wages adjust infrequently and in small amounts, recovering from an inflation shock can be inherently slow. With current inflation at just 0.4% in France, small wage increases are enough to sustain modest real wage growth today. But at the current pace, it will still take time to fully make up for the ground lost during years when inflation was much higher. In the Netherlands or the UK, by contrast, more frequent and more varied adjustments typically allow wages to respond more quickly to changing labor market conditions.
Wage flexibility and real wage recovery: Connecting the dots
While we cannot measure wage flexibility in every country individually, the cross-country patterns are suggestive. Real wage recovery has been faster in countries with more flexible labor markets, including the Netherlands and the UK, while those with more rigid wage-setting structures, like Japan, remain further behind. The euro area sits between these extremes, although the real wage recovery picture varies across individual member countries.
The speed of wage adjustment alone does not fully explain why some countries remain behind. After all, even in the markets with the least frequent adjustments, wages have had several years to catch up to consumer prices. One thing that matters is the combination of frequency and size. In France and Japan, for example, wages not only adjust infrequently but also change by small amounts when they do. As a result, even after several years, cumulative wage growth has not been high enough to offset the past inflation shock. In the Netherlands, the UK, and the US, on the other hand, more frequent adjustments and a wider range of wage changes have allowed wages to respond more forcefully. In the long run, real wage recovery also depends in part on productivity. Productivity, in turn, can be influenced by labor market rigidities that hinder an efficient allocation of labor.
The slow real wage recovery in southern Europe does not appear to be driven by weak hiring demand. On the contrary, as previous research shows, job postings in Italy and Spain remain well above pre-pandemic levels, indicating robust demand for new workers. Yet this demand has not translated into rapid real wage growth, consistent with structural factors, such as delays in renewing collective bargaining agreements in Italy and higher labor supply from immigration in Spain.
With wage growth now slowing across major economies, these structural differences are becoming even more consequential. In more flexible markets like the Netherlands, wages can decelerate responsively as conditions cool but pick up when demand for workers rises. In more rigid markets, the slowdown risks leaving workers with no real wage growth for extended periods.
What this means for workers and employers
These patterns have practical implications. In countries where posted wages adjust frequently and decisively, advertised pay is more likely to reflect current market conditions, meaning job switchers are more likely to receive a salary that matches the prevailing rate. In countries where wages are stickier, the timing matters more. Workers may benefit from aligning their job search or pay negotiations with their current employer to annual review cycles or collective bargaining rounds.
For employers, the message depends on the market. In flexible labor markets, where posted wages adjust often, staying competitive on pay requires frequent reviews of both advertised and actual salaries. In more rigid markets, advertised pay is slower to reflect changing conditions, making it harder for employers to gauge the correct going rate and increasing the risk of pricing roles too high or too low for extended periods.
Looking ahead, wage flexibility may matter even more if AI or other technologies reshape skill demands across occupations. Labor markets that allow pay to adapt are better positioned to absorb these shocks. Policies that reduce rigidities and support wage adjustment may help cushion the impact of technological change and ensure that workers’ purchasing power can keep pace with an evolving economy.
Methodology
The wage flexibility analysis used Indeed job postings data from Q1 2018 to Q1 2026 across eight large economies: Australia, Canada, France, Germany, Japan, the Netherlands, the UK, and the US. We define a “job” as a unique combination of job title (e.g., barista), wage type (e.g., hourly or yearly), firm, and location. For each job, we aggregate daily data into quarters using the mode and restrict the sample to jobs with at least 20 observed quarters. We calculate the probability of a wage change in any given quarter, the expected duration of a wage spell (the period during which wages remain constant), and the average size of wage changes when they occur.
Previous studies have examined the probability of posted wage changes in the US using an earlier time period and a different data source. Our international data enable us to conduct cross-country analyses and uncover new facts. This matters because some labor markets are more flexible than others due to differences in regulations, contracts, culture, and more.
The Indeed Wage Tracker calculates wage growth using an approach similar to the Atlanta Fed US Wage Growth Tracker, tracking jobs rather than individuals. We calculate the median posted wage for each country, month, job title, region, and salary type (hourly, monthly, or annual), then compute year-on-year wage growth for each combination, generating a monthly distribution. The monthly measure of wage growth is the median of that distribution. Euro-area figures are an employment-weighted average of growth rates in France, Germany, Ireland, Italy, the Netherlands, and Spain. Updated employment weights from Eurostat are applied periodically. For a detailed methodology, see our research paper, What Do Wages in Online Job Postings Tell Us about Wage Growth? For access to the data, see the Hiring Lab Data Portal.
The cumulative real wage index is constructed by chaining year-over-year posted wage growth rates from the Indeed Wage Tracker and consumer price inflation rates (CPI or HICP) into separate wage and price level indices, then taking their ratio. The index is rebased so that January 2021 equals 100. All series are shown as three-month moving averages.