Key points:
- Just over 5% of job seekers in the US are internationally mobile workers, with at least one work experience in another country.
- Internationally mobile workers made up more than a third of data & analytics applicants in Q2 2025, up almost seven percentage points from Q2 2024.
- In many STEM occupations, internationally mobile workers applied to more jobs per person on average than non-mobile workers.
- Internationally mobile workers are significantly more likely to apply for STEM roles than non-mobile workers.
This is the third piece in our global mobility series, which examines foreign job seekers’ interest globally. You can find part one here and part two here.
Even as technology hiring has cooled, workers currently in the United States with at least one international work experience, or internationally mobile workers, continue to target tech and broader STEM roles at elevated rates.
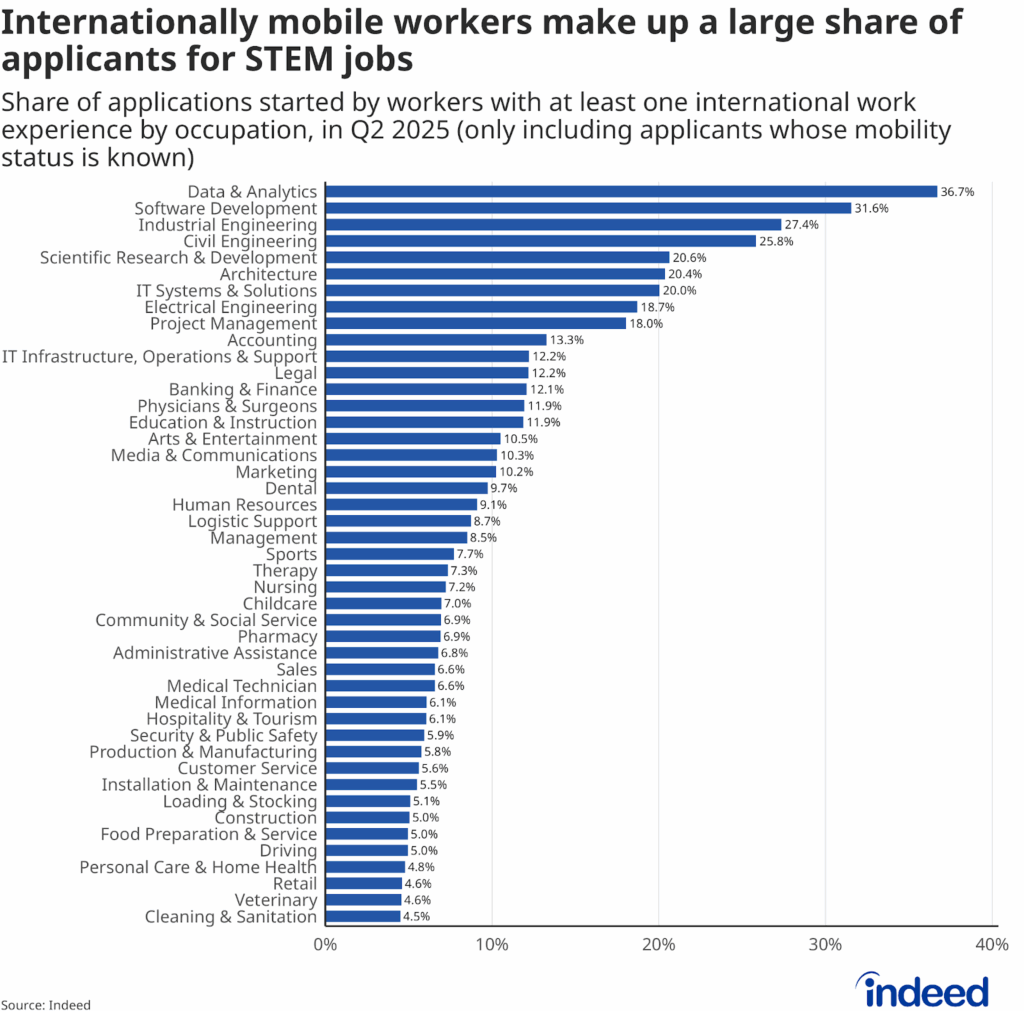
While roughly 1-in-20 US job seekers (5.1%) are internationally mobile, almost 37% of job applicants in the data and analytics sector in Q2 2025 were internationally mobile workers. Nearly a third (31.6%) of applicants for software development and more than a quarter (27.4%) in industrial engineering were also internationally mobile.
Conversely, fewer than 5% of applicants in personal care & home health, retail, veterinary, and cleaning & sanitation roles were internationally mobile workers.
This data not only highlights which occupations attract internationally mobile workers, but also which fields are structurally more likely to enable international mobility in practice through transferable skills or certifications that span borders. On the other hand, sectors that require localized knowledge, language fluency, or licensing tied to US standards may have lower interest from workers with international work experience.
Furthermore, STEM roles likely offer more opportunities for international placements, transfers, or assignments. Therefore, high shares of internationally mobile workers in these sectors could be a reflection of the presence of multinational employers with established global recruitment and placement pipelines.
Finally, most traditionally white-collar jobs, including STEM occupations, tend to require candidates to submit highly detailed and up-to-date resumes, often specifying international experience and precise career chronology. This encourages applicants to list all relevant roles, including those held abroad, making internationally mobile workers more visible in these fields.
Conversely, occupations with a lower share of internationally mobile applicants (cleaning & sanitation, retail, personal care & home health, driving, construction, etc.) are less likely to require the most up-to-date resumes in job applications. Therefore, these workers would not be captured in the data as “internationally mobile” if they choose to condense or omit their foreign experience in their resumes.
Internationally mobile applicants also apply much more aggressively to tech roles. For example, the typical internationally mobile worker applying for a software development job started an average of 12.8 applications, compared to just 5.8 for non-mobile applicants. Applications for data & analytics jobs showed a similar pattern.
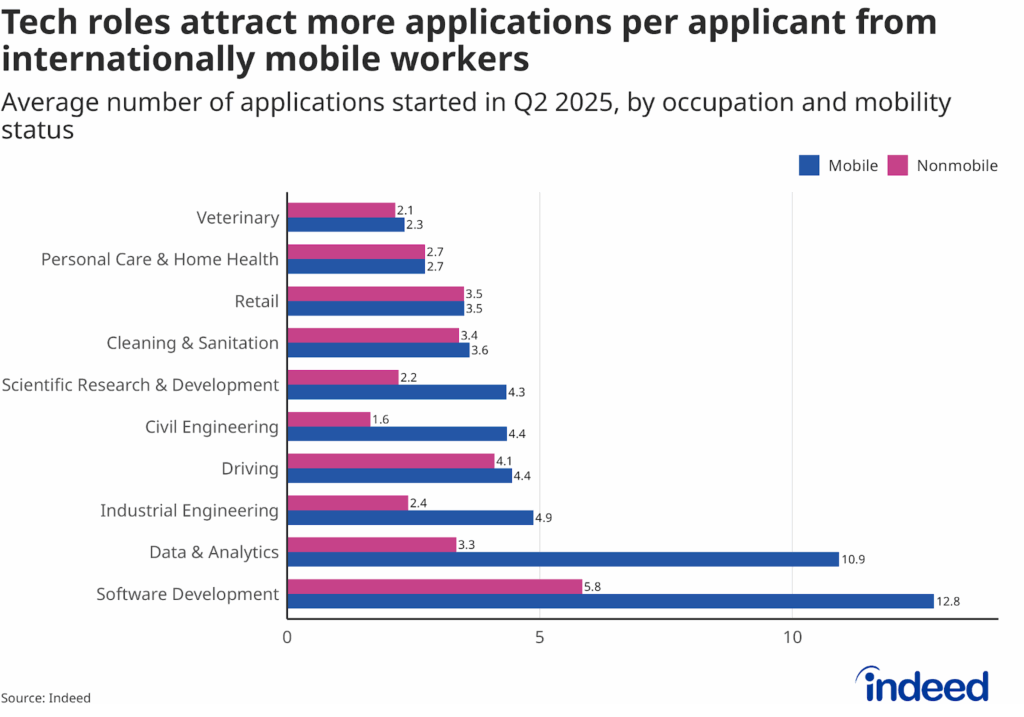
Additionally, roles that received the lowest share of internationally mobile applicants also had little to no difference in the average number of applications started per person between internationally mobile and non-mobile workers.
Annual growth concentrated in STEM roles
STEM roles have also seen the greatest increase in share of internationally mobile applicants since 2024, making up six of the top eight occupations with the highest percentage point increase in share of internationally mobile applicants.

Compared to Q2 2024, the share of internationally mobile applicants in civil engineering roles increased by almost 10 percentage points, followed by data & analytics roles (nearly 7 percentage points) and software development roles (more than 5 percentage points).
Diving deeper into the specific job titles tells a similar story: STEM roles comprised almost all of the top 15 roles that received the highest share of applications from mobile workers in Q2 2025. Those same STEM titles also posted clear year-over-year gains in the share of internationally mobile applicants compared to 2024 and 2023. The percentage point increase between Q2 2023 and Q2 2025 ranged from about 4 percentage points to 20 percentage points.
A mix of factors likely explains these increases. Internationally mobile workers, many of whom are likely to be migrants, could have been more heavily impacted by the recent rounds of layoffs or might have started searching more actively and aggressively for new opportunities.
In general, the pullback in tech hiring has likely reshaped how people apply. With fewer openings and increases in time-to-hire, job seekers might be casting a wider net across STEM roles to land an offer — highlighted by a decrease in the number of tech job postings but an increase in the number of applications for all but two of these occupations.
Distribution of applications by occupation and mobility status
Overall, internationally mobile workers tend to apply more to white-collar roles. Mobile workers were 4.6 percentage points more likely to apply for software development roles than non-mobile workers in Q2 2025, followed by 2.6 percentage points for data & analytics and 1.8 percentage points for accounting.

Breaking this down even further, more than 16% of mobile workers with a master’s degree applied for software development roles in Q2 2025, up from just over 12.5% in Q2 2024. Notably, this was the highest of all mobility status-education level combinations, closely followed by 14.4% of internationally mobile workers with a PhD applying for roles in scientific research & development in Q2 2025.
Conversely, slightly more than 5% of non-mobile master’s degree holders applied for software development roles in Q2 2025. Workers, whether internationally mobile or not, whose highest level of education was an associate degree, were most likely to apply for administrative assistance roles, with around 11% of each group targeting this occupation.
Highest level of education by mobility status
Generally, mobile workers are more likely to have post-secondary education. Mobile workers are more than 12 percentage points more likely to have a bachelor’s degree, almost 16 percentage points more likely to have a master’s degree, and 2.5 percentage points more likely to have a PhD.

It is possible that some of the degrees held by mobile workers were earned outside the US, particularly in the case of foreign-born workers who moved for employment. As a result, even with those qualifications, US employers may not fully recognize their degrees, potentially forcing them to apply for or take up roles that they are overqualified for. Some mobile workers, therefore, might choose tech roles strategically because these fields tend to have the most portable skills and have historically offered clearer immigration pathways.
Last foreign experience
Interestingly, blue-collar occupations tend to be the most common current occupation of job seekers with the most recent foreign work experience. Food preparation & service, loading & stocking, veterinary, cleaning & sanitation, and sports show the shortest gaps since job seekers’ last overseas job.

On the other hand, workers currently in white-collar roles tend to have the longest time since their last foreign work experience, with the highest being around nine years for workers currently in industrial engineering, closely followed by job seekers in IT systems & solutions, and accounting.
The average time since the last foreign work experience also varies widely by the country where that experience occurred.
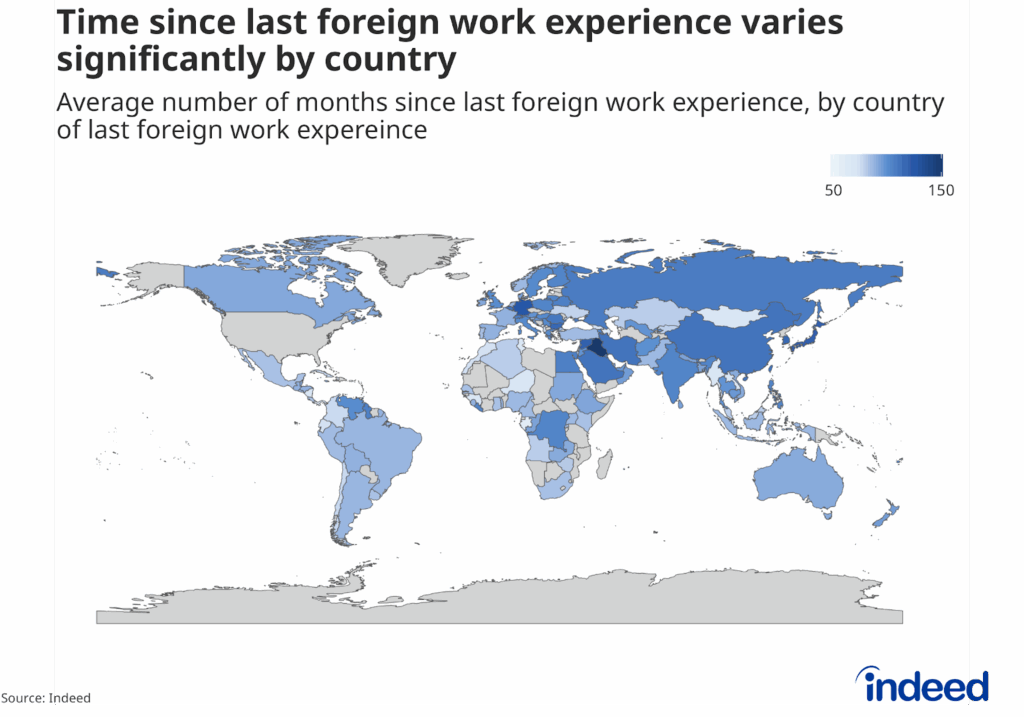
Among countries where at least 2,000 internationally mobile job seekers had their last foreign experience, the time since that previous work experience was longest for Iraq (about 12 years) and shortest — not including Puerto Rico — for Seychelles (around 58 months).
Interestingly, the most common occupation of the last foreign work experience of internationally mobile workers was management; over 10.5% of mobile workers worked in a management role in the last position before starting their US work experience. This was followed by administrative assistance (7.5%) and food preparation & service (6.8%).
Conclusion
The persistence of high interest in tech roles from internationally mobile workers, even as postings have dipped, suggests that global talent continues to view the US as a hub for innovation careers. Understanding these job application patterns can help employers and policymakers identify where international talent is most engaged and where barriers may be limiting participation.
Methodology
On data privacy: To protect workers’ personal information, all datasets are stripped of identifying information, including names and addresses. Results are only reported in an aggregated format. Analysis and data review are also performed to ensure that data points cannot be tied back to individuals.
For this analysis, we utilized Indeed’s pool of hundreds of millions of job seeker profiles to identify workers currently residing in the United States with at least one work experience outside the US, based on the most recent resume as “mobile.” Workers who had listed all their work experiences as being in the US were identified as “non-mobile.” A smaller but meaningful share of workers had some US work experience alongside other roles where the location was not specified. Because it was not possible to determine whether these unspecified experiences occurred domestically or abroad, these workers were categorized as “unknown” in the dataset. Workers with resumes that didn’t have first or last names and/or had over 32 work experiences were filtered out.
Application data is based on the number of workers who started an application on Indeed, regardless of whether they saw the process through. For each application started in the second quarter of 2023, 2024, and 2025, the number of applicants that were “mobile,” “non-mobile,” and “unknown” was determined based on the earlier categorization of those workers. If an applicant had started an application for the same role more than once, they were only counted once. Applications were labelled “uncategorized” if not associated with any of the profiles categorized earlier (possibly filtered out or not clicked by a US worker). For each occupation and job title, we counted the number of applications started by job seekers in each category. Subsequently, while calculating the share of applications in each occupation or job title from internationally mobile workers, the number of applications started by mobile workers was divided by the combined number of applications from both mobile and non-mobile workers, ensuring that “unknown” and “uncategorized” cases did not affect these figures.
Internationally mobile workers were further analysed based on their highest level of education, last foreign work experience, time since last foreign work experience, etc.