
Key points:
- Posted wages for jobs that pay an annual salary grew 2.9% from Q1 2025 to Q1 2026, compared to just 1.7% for jobs that pay an hourly wage.
- In many industries, workers performing similar roles may experience very different pay trajectories depending on whether they are hired as salaried or hourly employees, reinforcing broader inequalities in compensation growth and purchasing power.
Advertised compensation for salaried positions grew faster over the past year than for hourly roles, according to a Hiring Lab analysis of wage data across millions of job postings. The discrepancy has real implications both for workers’ current purchasing power and their ability to grow income over time, especially as inflation continues to bite. And some early-career and/or flexible workers (such as contractors or freelancers) that are more likely to be hired at an hourly rate may feel the biggest crunch.
Tracking growth in wages advertised in job postings provides an early signal of how employers are adjusting pay for both new hires and, over time, existing staff. Hiring Lab found that while posted wages for salaried roles grew at 2.9% between the first quarters of 2025 and 2026, wages for hourly roles grew at only 1.7% during that same period. The differences hold in nearly all high‑pay, white-collar sectors, as well as several blue-collar occupations where both hourly and salaried arrangements coexist.
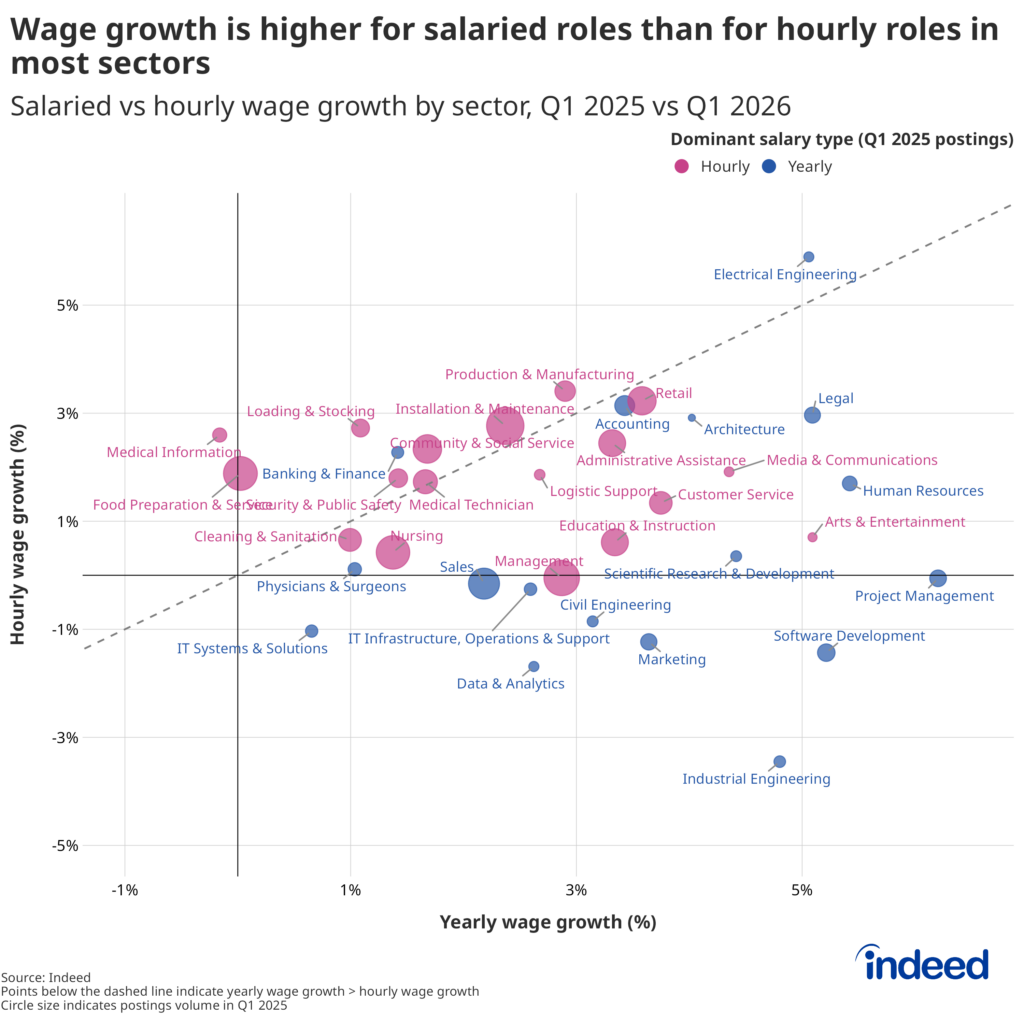
Almost all STEM sectors — including industrial engineering, software development, IT systems & solutions, and data & analytics — saw negative wage growth in hourly job postings, as did white-collar sectors of marketing and sales. Human resources, accounting, architecture, and legal occupations saw positive wage growth in hourly job postings, though it remained below the wage growth seen in salaried roles.
Salaried positions accounted for a larger share of job postings in most of the sectors in which salaried pay is growing faster than hourly pay. In contrast, hourly work is more concentrated in flexible, support-oriented roles, including sectors like industrial engineering, marketing, and data and analytics. But this also points to a deeper segmentation. Entry‑level professionals, contractors, freelance workers, and interns are all more likely to be hired on an hourly basis in these sectors, according to Indeed’s data. And because hourly pay is not rising as quickly as annual pay, these workers may be settling for pay that is less likely to keep up with current inflationary pressures. Their potentially more-experienced peers, applying for salaried roles in the same fields, may be starting from a higher base of pay and have a built-in advantage as their careers progress.
Posted wages aren’t just about new hires; they tend to mirror what employers are willing to pay across the board. That means that slower growth in wages advertised in job postings is also an indicator of slower pay growth for workers already in those roles. For example, two customer service representatives doing the same work for the same number of hours in the same city might experience wildly different pay trajectories depending on whether they’re paid hourly or are salaried. In other words, in some sectors, your salary type can affect your purchasing power in the economy.
The pattern here reinforces a familiar labor-market inequality: salaried workers tend to be in higher‑income roles to begin with. They are also more likely than hourly workers to receive employer‑provided benefits, including health insurance, retirement contributions, and/or paid leave. Faster nominal wage growth, on top of better non‑wage compensation, widens the gap in living standards between salaried and hourly workers over time, even within the same sector.
Taken together, these trends suggest that wage growth is increasingly bifurcated not just across industries, but within them. If the gap persists, salary structure may become an increasingly important factor in how workers build — or lose — purchasing power over time.
Methodology
To calculate the rate of wage growth by occupation sector and salary type, we begin by calculating the median posted wage for each job title, US county, and salary type (hourly or yearly) in each quarter, then compute year‑over‑year wage growth for each job title–county–salary type combination by comparing Q1 2025 (January–March 2025) to Q1 2026 (January–March 2026). This yields a distribution of growth rates. Our measure of wage growth for each occupation sector is the postings‑weighted mean of that distribution, adjusting for differences in job posting volume across counties. Where a posting lists both a minimum and maximum salary, we use the midpoint; where only one bound is provided, we use that value directly. Occupation sector classification is held constant at its Q1 2025 mapping to avoid compositional changes driving the results. Sector–salary type combinations with very few qualifying job titles–county cells are excluded, and job title–county combinations with year‑over‑year growth below −50% or above +50% are dropped as likely data anomalies. In the chart, circle color indicates whether a sector had more hourly or yearly postings in Q1 2025, and circle size reflects total Q1 2025 posting volume across both salary types.
While this analysis follows an approach closely aligned with the Indeed Wage Tracker, some methodological adaptations were made to suit a point-in-time quarterly comparison rather than a rolling monthly series.
The number of job postings on Indeed.com, whether related to paid or unpaid job solicitations, is not indicative of potential revenue or earnings of Indeed, which comprises a significant percentage of the HR Technology segment of its parent company, Recruit Holdings Co., Ltd. Job posting numbers are provided for information purposes only and should not be viewed as an indicator of the performance of Indeed or Recruit. Readers seeking more detailed information on revenue generation by Recruit’s HR Technology segment should refer to the Recruit Holdings investor relations website and regulatory filings in Japan.