
Key Points:
- Foreign job seeker interest in US jobs has fallen sharply since 2024 and is currently at a 6-year low.
- Employers’ stated willingness to hire workers requiring visa sponsorship has tripled since the pandemic.
- International talent is an important component of the US labor market, representing a significant proportion of workers in industries including cleaning, farming, construction, tech, healthcare, production, transportation, and service.
- Broad changes to immigration policy since early 2025 are reshaping who contributes to the United States labor force.
The United States labor market has long depended on a steady flow of immigrant workers. In recent years, as the native-born population aged and labor force growth stalled, immigration has filled critical gaps across sectors. But a new Hiring Lab analysis shows that pipeline has been disrupted, with foreign interest in US jobs falling to its lowest level since before the pandemic, even as employers’ demand for immigrant workers has skyrocketed.
Since early 2025, broad changes to immigration policy have impacted virtually every channel through which immigrants enter and remain in the US labor force. It will take years to fully measure the economic impact of these policy shifts. But declining interest in US jobs from potential migrants, coupled with changes to law enforcement priorities intended to actively shrink the pool of foreign-born workers already in the US, will very likely have lasting and widespread economic and labor market impacts.
Foreign job seeker interest dropped
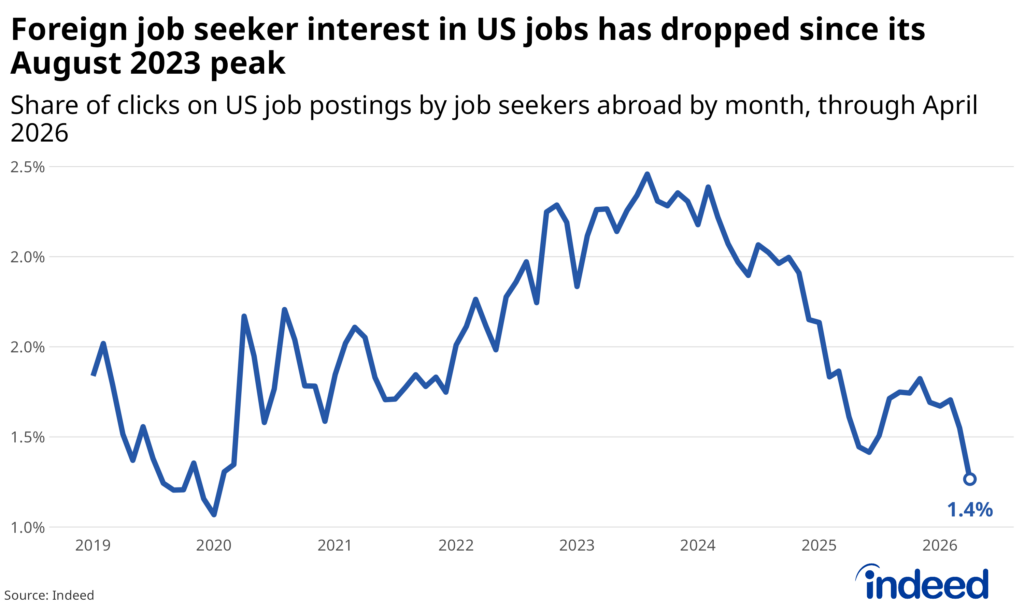
The share of clicks on US job postings from abroad peaked in 2023 and has been falling sharply since, sitting at just 1.4% as of April 2026, the lowest value since January 2020. This decline predates many of the policy changes and enforcement actions taken over the past year, suggesting that the US began losing its appeal to foreign talent well before the most recent changes took effect.
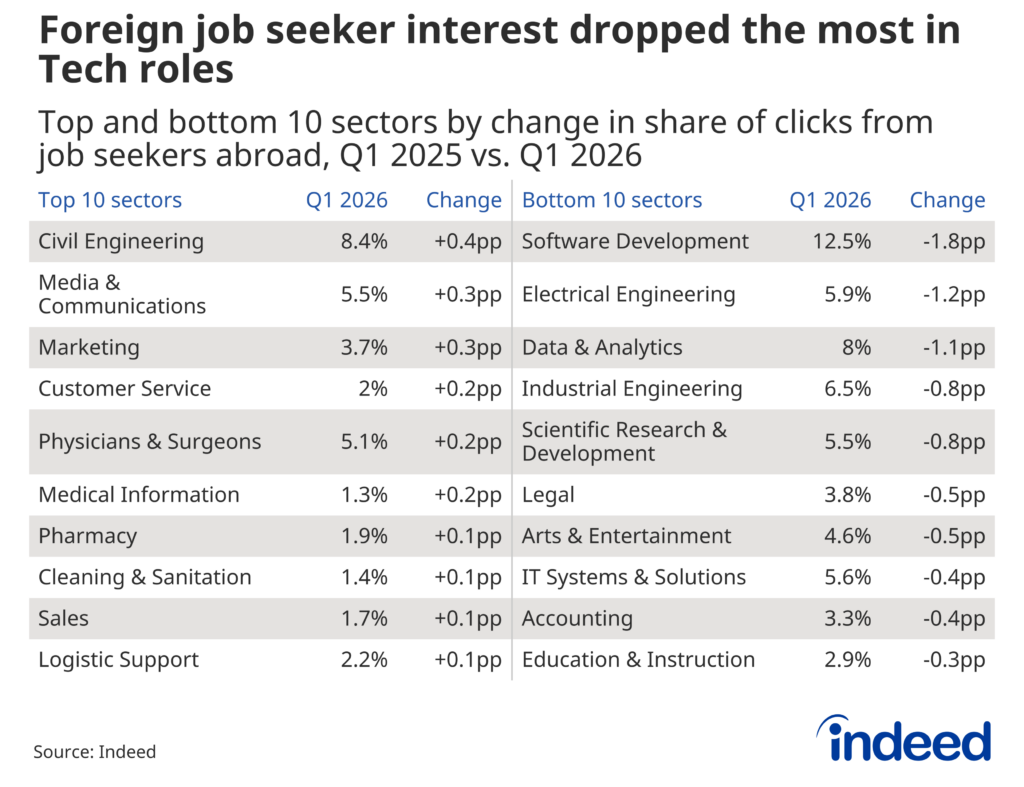
The decline in foreign interest over the past year has been particularly acute in the tech sector. In the first quarter of 2025, 14.3% of clicks on US software development postings came from job seekers outside the US, the highest among all sectors tracked. Fast-forward a year, and software development remains the sector that attracts the highest share of foreign clicks, but the share has fallen to 12.5%, a decline of 1.8 percentage points, the largest absolute decline observed. The share of clicks from abroad that went to postings for electrical engineering and data & analytics also fell by more than a percentage point each. Foreign interest in some sectors did grow modestly over the past year, including in civil engineering, marketing, and media roles, but not by enough to counter deeper declines in other industries.
Indeed’s job seeker click data has previously been shown to correlate with migration patterns in countries within the Organisation for Economic Co-operation and Development (OECD). When foreign job seekers click on jobs outside of their home countries, it’s a sign they intend to eventually move. A decline in intentions to move will eventually translate into fewer actual moves. At the same time, foreign workers who have already moved to the US are being impacted by tighter immigration and enforcement policies intended to shrink their numbers. Going forward, both dynamics will ultimately contribute to more-limited labor force growth overall, especially as the native-born population ages and future generations become smaller.
Immigrants’ population and labor force impact
Broadly speaking, the immigrant population of the United States is split into four categories: foreign-born US citizens (46%), permanent residents (23%), temporary visa holders (4%), and unauthorized migrants (27%). After increasing each year since 2020, net international migration peaked at nearly 2.7 million in 2024. According to the Census Bureau, it is now projected to fall to 321,000 by mid-2026, a decline of nearly 90% in two years.
The labor market implications of this are inseparable from a longer-term demographic reality: the United States is aging, and immigrants, on average, are more likely to be of prime working age than native-born Americans. Virtually since the nation’s founding, there have consistently been more births than deaths in a given year. But beginning in 2030, that trend is expected to reverse, according to the Congressional Budget Office. Keeping US population growth positive beyond then will require a steady inflow of migrants.
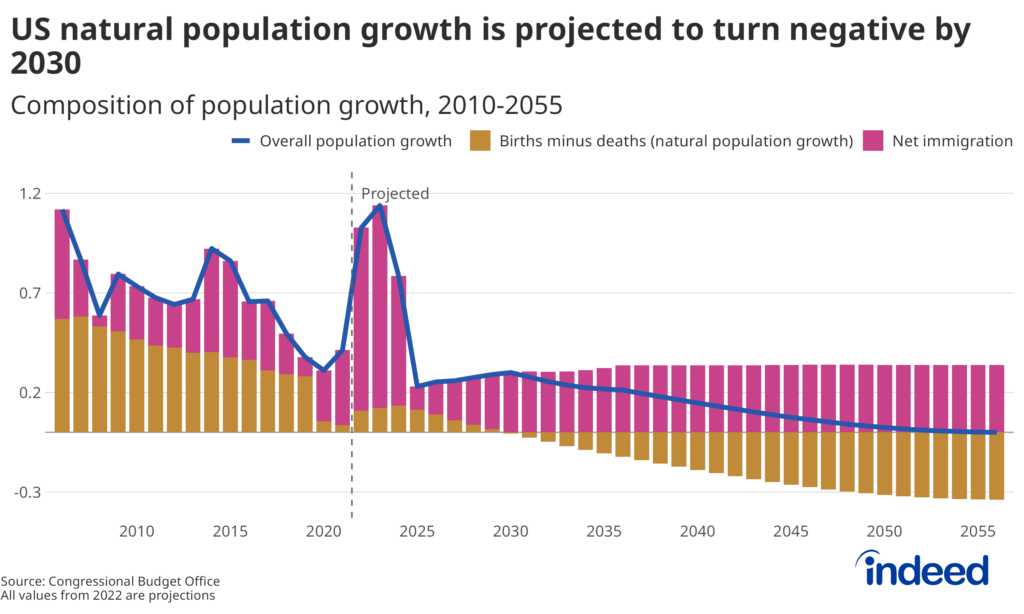
The US population will likely begin to decline at some point between 2030 and 2055. And if net immigration falls close to zero, the US will start experiencing population declines within a matter of years. Barring some unexpected shift in labor force participation rates, a smaller population will mean a smaller labor force. Put simply, immigration will soon become the primary mechanism keeping the population and the labor force growing. Without it, the US will not just be facing a tighter labor market, but a shrinking one.
Immigrants in the labor force
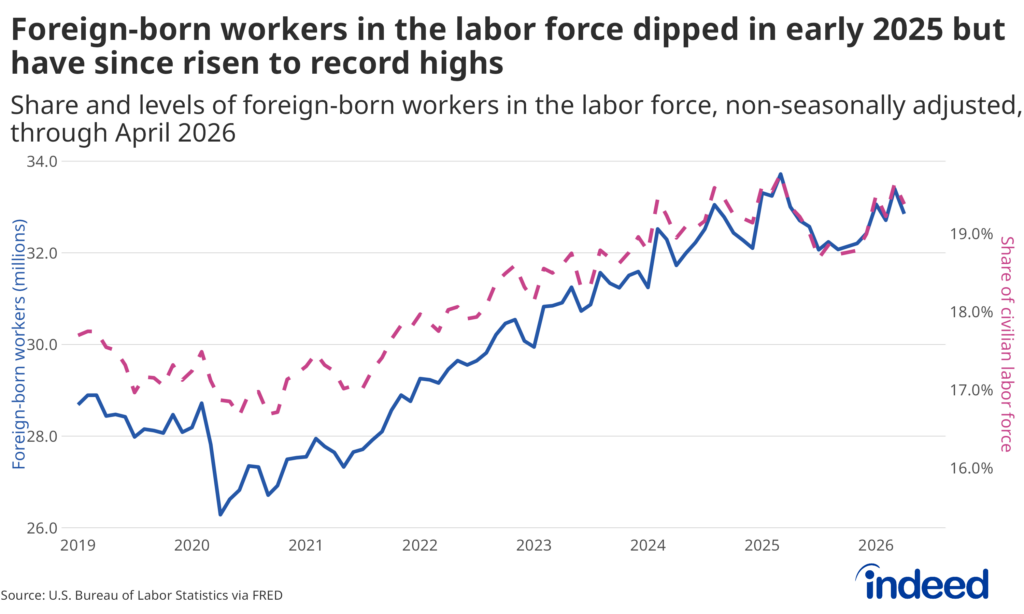
Immigrants are embedded in many of the nation’s industries. As of 2024, there were more than 50 million foreign-born individuals in the United States, making up 14.8% of the total population. However, because a higher share of immigrants are in the 25-54-year-old age bracket, they have a higher labor force participation rate and represent close to one-in-five workers in the labor force. Overall, immigrants contributed 17% more in taxes per capita between 1994 and 2023 than US-born individuals, primarily driven by this higher labor force participation rate.
Immigrants are especially overrepresented in certain industries, meaning that disruptions to the immigrant labor supply will not affect all industries equally.
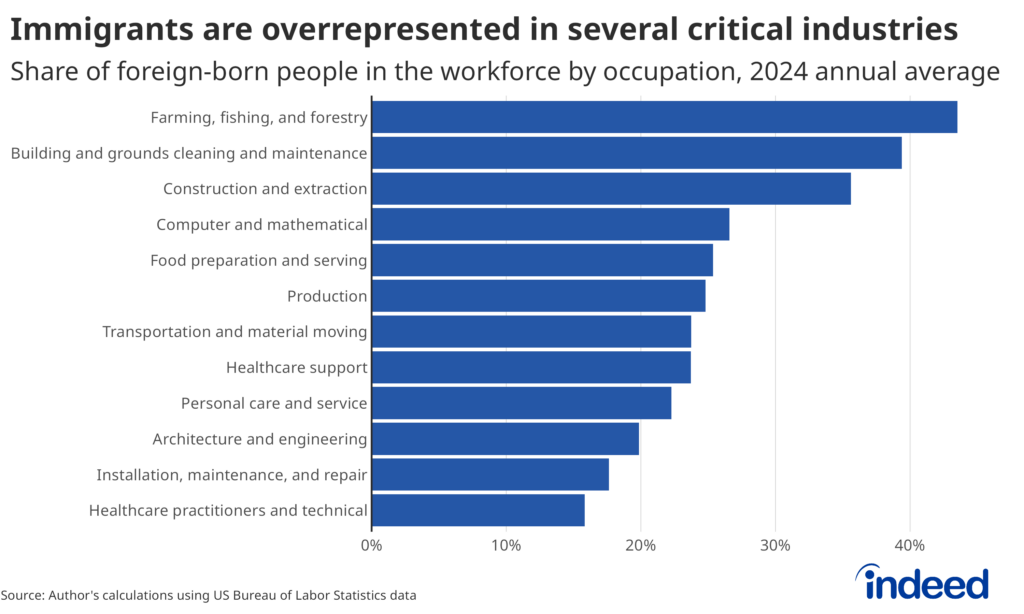
Many of the sectors that are traditionally more reliant on immigrant labor are also directly linked to critical goods and services, and a reduction in workforce availability across all stages of these supply chains will have a ripple effect on consumers. Fewer farm workers could mean smaller harvests; a decline in transportation workers could slow pickups and deliveries; and a shortage of cooks could lengthen restaurant turnaround times. As the flow of goods slows and the flow of services gets delayed, employers will face rising operational costs that they may not be able to absorb. The result is often passed on to consumers through higher prices or, increasingly, shrinkflation – paying the same for less.
Immigrants are also consumers who purchase products and business owners who hire workers. In 2023, immigrants’ after-tax spending totaled some $1.7 trillion, money that flowed directly into the economy for goods and services. Immigrants also own roughly 20% of all US small businesses. Almost half of Fortune 500 companies were founded by immigrants or their children, collectively employing 15.4 million people and generating $8.6 trillion in revenue in 2024 alone. Data show that immigrant-founded firms generate 42% more jobs per company than their native-founded counterparts.
Demand for immigrant labor remains high, especially in healthcare
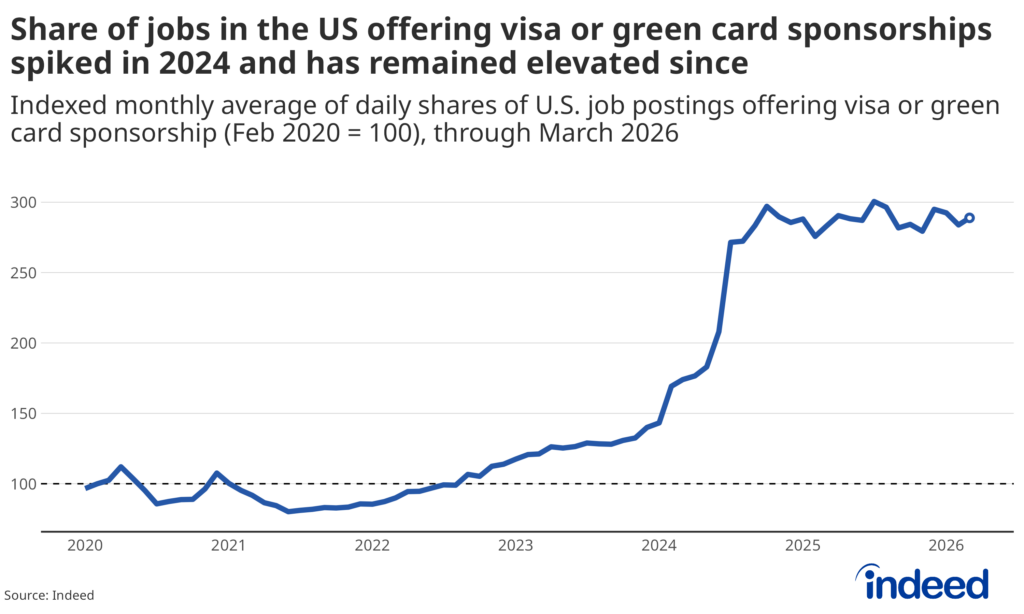
Immigrants are strongly represented across virtually every sector of the economy, from food service to healthcare, and many did not end up in these fields by chance. In many cases, they were directly sought by employers and encouraged to apply for open roles with the promise of employer-sponsored visas. The share of US job postings offering visa or green card sponsorship has tripled since the pandemic and has remained persistently elevated. Employers are not pulling back on their demand for foreign workers; if anything, the prospect of a tighter labor supply has intensified it. These diverging trends — foreign workers becoming less interested in the US, at exactly the moment US employers are competing harder to attract them — are perhaps the clearest summary of the challenge facing employers in this environment.
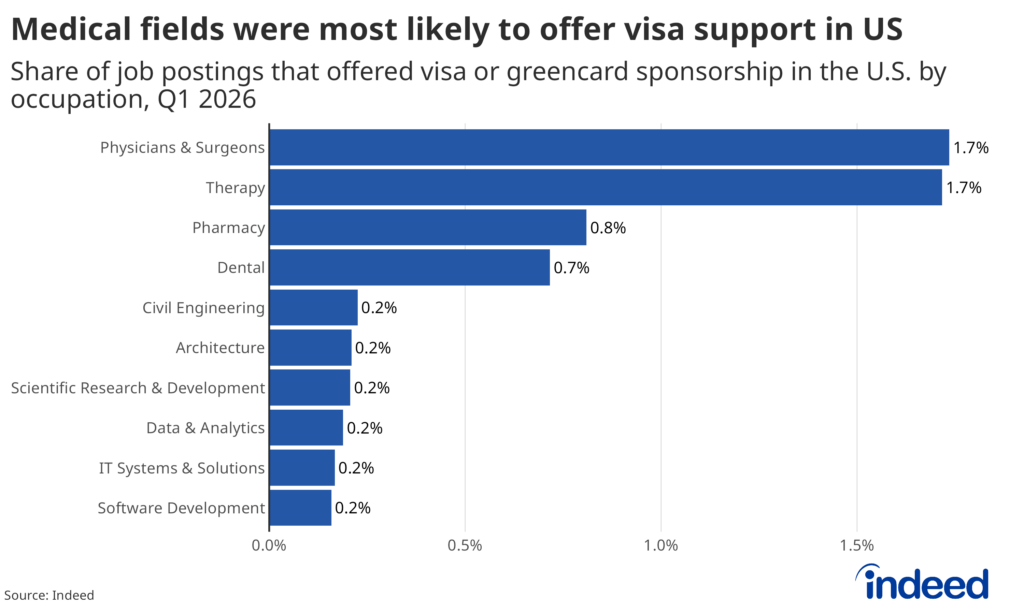
Sectors with the highest shares of postings advertising visa sponsorship are concentrated in healthcare — therapy, physicians and surgeons, dental, and pharmacy lead the list. These roles require substantial training and licensure and can be notoriously difficult to fill. And they are precisely the fields where the domestic supply of workers has been structurally short for years.
Recent policy changes appear to recognize and seek to address that dynamic. The cap for the H-2B visa program — the country’s primary source of non-agricultural, blue-collar migrant workers, including construction workers and landscapers — was recently nearly doubled for this fiscal year in order to support businesses that might be harmed by labor shortages in these occupations.
Uncertainty in the data
Official data from the Current Population Survey (CPS) is a critical data source and one of the government’s key data sources on the labor market in particular. It shows foreign-born labor force participation rebounding over the past couple of months. But no data set is perfect. Declining survey response rates (from more than 80% pre-pandemic to just 66.6% in April 2026), seasonality, changes in immigrants’ behavior in response to ongoing policy changes, and simple demographic math are all likely serving to push up headline figures in a potentially misleading way. These limitations make it difficult to interpret this apparent rebound in foreign-born labor force participation.
The Census Bureau itself, which oversees the CPS, cautions against using it to measure immigration flows. And the Bureau’s own annual projections are not designed to capture near-term shifts in workforce composition driven by the kinds of rapid policy changes we’ve seen over the past year. The St. Louis Fed also recently urged caution when interpreting the survey’s findings on the size and composition of the US labor force for subgroups like immigrants.
In short, it’s getting increasingly challenging to determine with confidence how many immigrants are currently participating in the US labor force, and how that’s changed over the past year. Indeed’s data can help fill in some of the blanks, often in close to real-time.
Conclusion
While we can observe some short-run impacts of immigration changes, there is still much we do not yet know. Immigration is particularly hard to measure right now: unauthorized migrants are often undocumented, survey response rates are falling, and the true impact of today’s policies will not be fully known for several years. Realistically capturing what these changes mean for the macroeconomy remains an open — and genuinely difficult — question.
The available demographic and workforce data show that immigration will remain a significant factor in US labor force dynamics well into the future. It is one variable among several, including retirement trends, labor force participation, and AI-driven productivity shifts, that will shape the workforce available to employers.
Methodology
We assess foreign job seeker interest by tracking the share of total clicks on Indeed job postings in a given country by job seekers with IP addresses outside of that country. Data from job seekers in 254 countries and overseas territories was included in this analysis. Job seekers whose location could not be determined were removed from the analysis. All data in the post are summarized by month, unless noted otherwise.
Data on Indeed job postings are presented as an index of the number of unique job postings in a given month. February 2020 is used as the pre-pandemic baseline, with the index set to 100 in that month. For the visa and green card sponsorship analysis, we calculate the daily share of U.S. job postings that mention visa or green card sponsorship attributes and then compute the monthly average of those daily shares.
The number of job postings on Indeed.com, whether related to paid or unpaid job solicitations, is not indicative of potential revenue or earnings of Indeed, which comprises a significant percentage of the HR Technology segment of its parent company, Recruit Holdings Co., Ltd. Job posting numbers are provided for information purposes only and should not be viewed as an indicator of performance of Indeed or Recruit. Please refer to the Recruit Holdings investor relations website and regulatory filings in Japan for more detailed information on revenue generation by Recruit’s HR Technology segment.