
Key points:
- The US Bureau of Labor Statistics projects a decline in the overall Labor Force Participation Rate (LFPR), from 62.6% in 2024 to 61.1% by 2034 — a 1.5 percentage point decline over the decade.
- Workers ages 16 to 24 are the largest contributors to the overall decline in the LFPR, driven by both a shrinking population and lower labor force attachment.
- The LFPR remains historically high for prime-age workers (ages 25 to 54), but is trending downward, with small projected declines combined with slower population growth.
- As older workers remain in the labor force longer, an aging population shifts more workers into lower participation age brackets, pulling down the overall LFPR.
The US labor force is quietly shrinking, not because of a weak economy, but because of a demographic squeeze. The population is aging, fewer younger workers are entering the workforce, and relative stability amongst prime-age workers (aged 25-54) can’t fully offset the gap. The result, according to the BLS projections, will be roughly 4.3 million fewer workers by 2034 than would be expected if participation rates held steady.
Each year, the Bureau of Labor Statistics (BLS) develops 10-year projections about the labor market. The latest projections for the decade stretching from 2024 to 2034 show a steady decline of the overall labor force participation rate (LFPR), from 62.6% in 2024 to 61.1% by 2034, a 1.5 percentage point drop over a decade. Given the size of the US labor market, that 1.5 percentage point decline represents roughly 4.3 million fewer people who are either employed or actively seeking work, relative to 2024 participation levels.
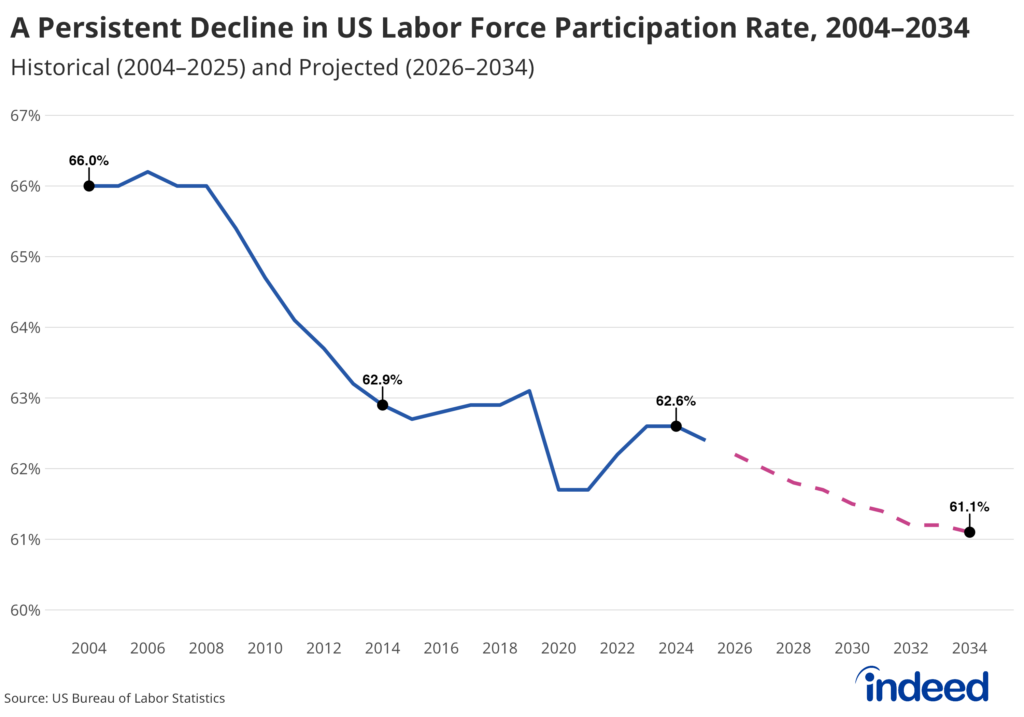
Labor force participation overall has been broadly declining for two decades. This trend matters because LFPR plays an important role in shaping economic growth, hiring conditions, and wage dynamics. When participation falls, it limits the pool of available workers, even if labor demand remains strong. Understanding why participation is projected to decline — and the different factors driving the declines amongst different age groups — is critical for interpreting the future trajectory of the US labor market.
LFPR reductions through 2034
Labor force projections are based on expectations of the future size and composition of the population. The LFPR measures the percentage of people 16 and older, excluding those who are institutionalized or in the military, who are either working or actively looking for work. The BLS labels individuals who are not working and have not actively searched for work in the prior four weeks as “not in the labor force.”
Unlike the unemployment rate, which tends to fluctuate with business cycles, the participation rate captures who is available to work. Because the labor force includes unemployed individuals who are seeking work, participation is best understood as a measure of the economy’s potential labor supply. This distinction matters. A strong economy can encourage individuals to reenter the labor force by increasing job opportunities, but it cannot alter the underlying age structure of the population. As a result, gradual shifts in age structure can exert persistent effects on the labor market.
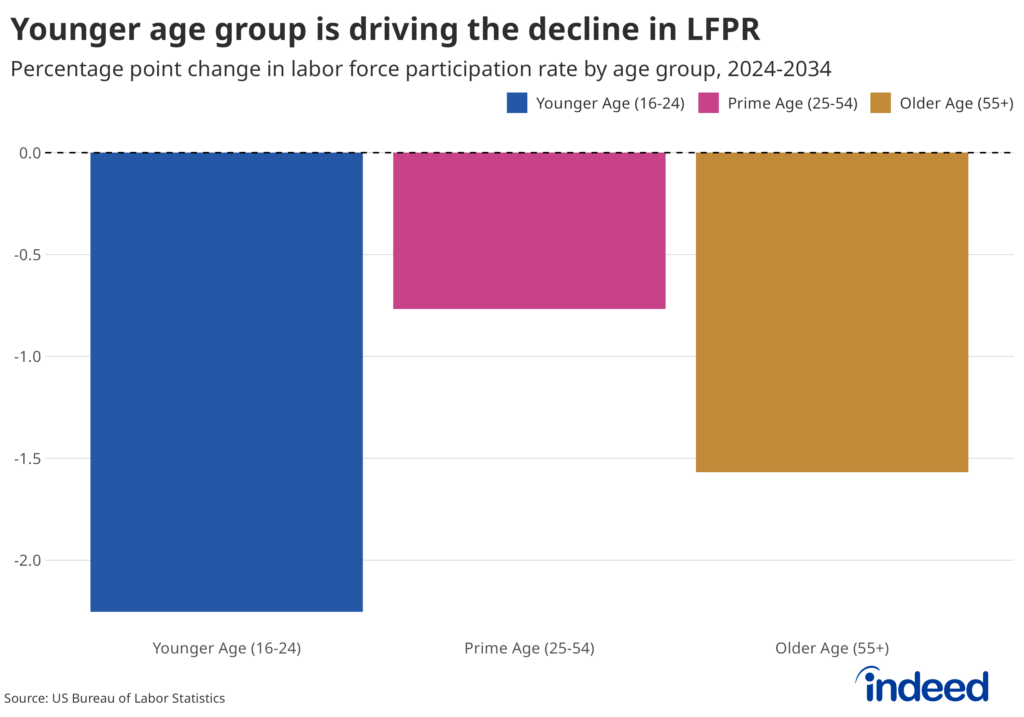
The chart below shows the expected percentage point change in participation rate by age groups through 2034. LFPR is expected to decline across all age groups, with the most pronounced change amongst younger workers ages 16 to 24.
Demographic shifts are visible in the underlying population and labor force levels
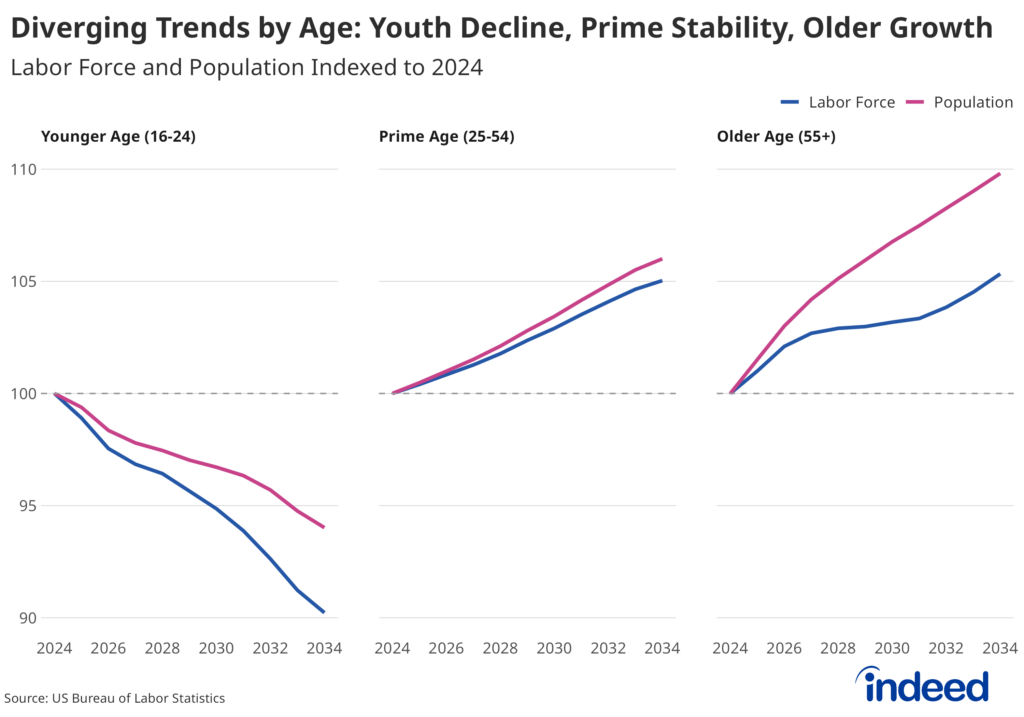
Participation rates alone do not tell the full story. When indexed to a 2024 baseline, population and labor force trends make the structural shifts clearer. Three distinct trends across age groups are expected to drive reductions in LFPR between 2024 and 2034:
- Both the total population of 16-to-24-year-olds, and the share who participate in the labor force, are expected to decline. The overall population of this group is expected to fall by 6%, while the number of young people in the labor force is expected to fall by 10%.
- Trends for prime-age workers aged 25 to 54 are expected to stay relatively stable. Population and labor force levels amongst those ages 25 to 54 are expected to increase 6% and 5%, respectively.
- The number of those aged 55 and older is expected to increase by about 10%, the largest among all age groups. But the number of people in this group who will be in the labor force is only expected to grow at half that rate (5%), reflecting a persistently low participation rate among older workers.
These trends illustrate a demographic rebalancing of the labor force. Even though prime-age participation remains strong and older workers are expected to remain employed longer, this is not enough to offset the decline observed amongst the youngest workers.
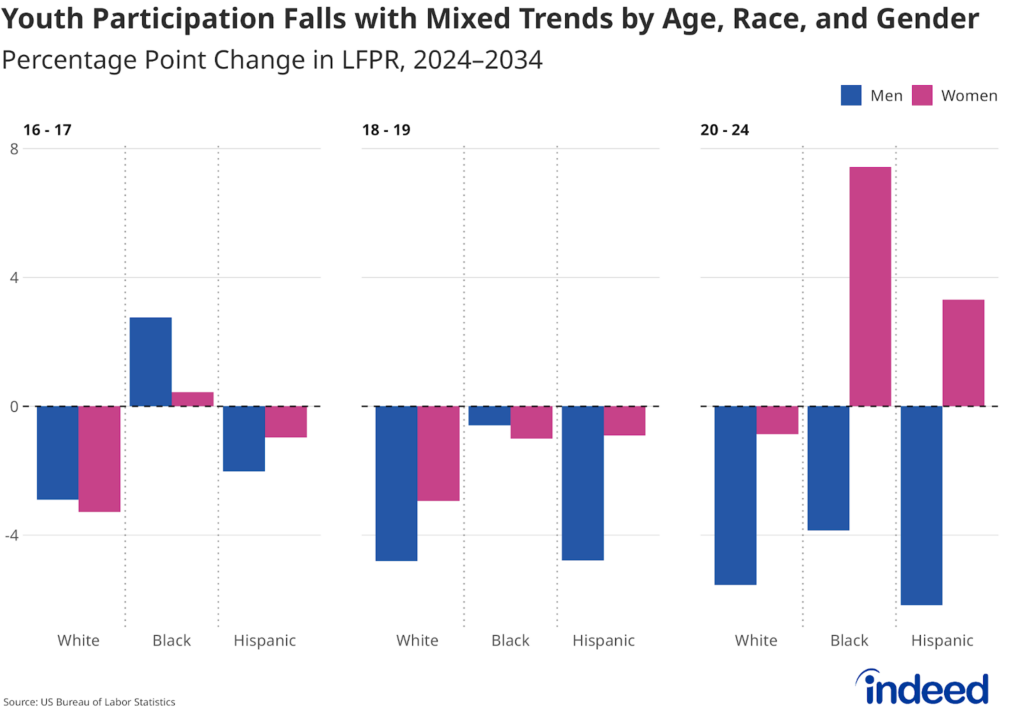
For workers ages 16-24, it’s not just about population decline
The largest contributor to the overall decline in LFPR is the youngest group of workers. The LFPR for those aged 16-24 is projected to fall from 55.9% in 2024 to 53.6% in 2034, a 2.3 percentage point decline.
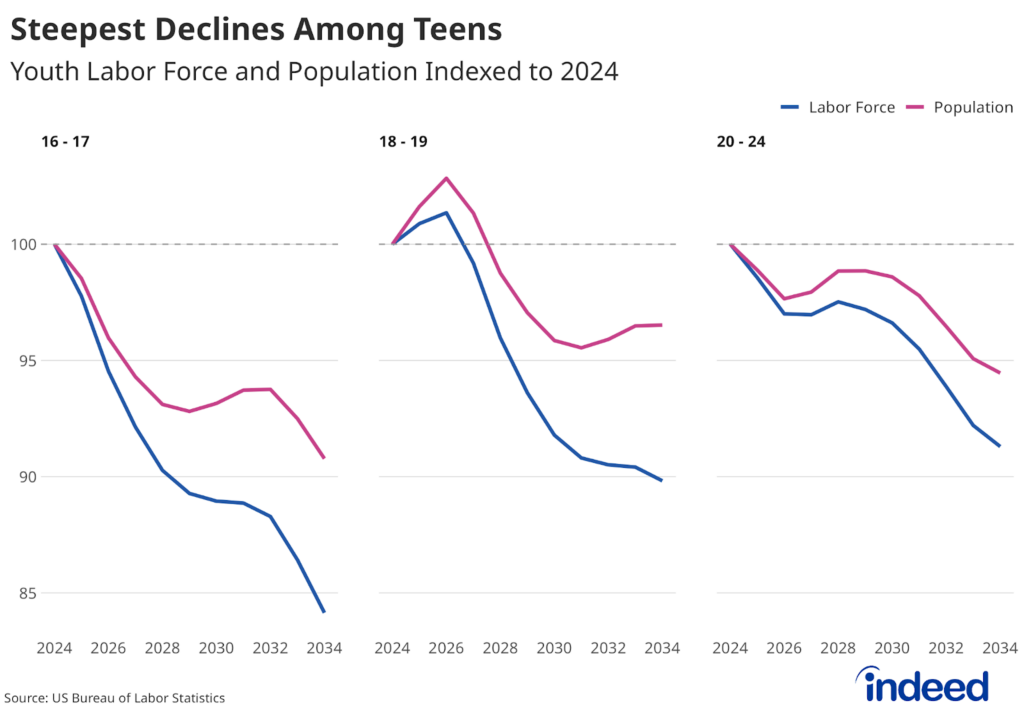
Looking within that cohort at three distinct age bands — late adolescence (ages 16-17), early adulthood (ages 18-19), and early career-building (ages 20-24) — reveals two important trends. First, the population for this group is shrinking, steadily declining across all three age bands, meaning there are simply fewer people expected to enter the labor market over time.
Second, labor force attachment is weakening, likely driven by several factors. Labor market conditions are creating new barriers for first-time job seekers. Research from Indeed Hiring Lab shows entry-level job postings have softened, limiting opportunities for workers trying to gain an initial foothold in the labor market.
At the same time, a growing share of young people face structural barriers, including unequal access to professional networks, transportation constraints, and persistently high rates of youth disconnection from both school and work. As a result, declining youth participation reflects both a shrinking cohort and delayed entry into the labor market.
Declines in participation among 16-24-year-olds are not evenly distributed across demographic groups. Young men are projected to have larger declines than young women, particularly among those ages 20 to 24.
Across racial and ethnic groups, white youth show some of the most consistent declines, especially among younger men. This aligns with broader demographic projections showing steeper population contraction among young, white youth cohorts. For Hispanic youth, participation declines are larger for young men than for young women. In contrast, several groups, particularly Black young women ages 20-24, are projected to have increased participation.
Prime-age workers: Stability isn’t enough to offset demographic headwinds
While the younger age group represents the typical entry point into the labor market, the majority of the labor force is made up of prime-age workers. That makes even modest shifts in their participation significant. The LFPR for this age group is projected to fall from 83.6% in 2024 to 82.8% in 2034, representing about 1 million fewer workers than if the participation rate were held constant.
But while the overall prime-age LFPR is expected to decline, the decline is not expected to be uniform across all races and age bands. Hispanic and white men ages 25 to 29 are expected to experience the largest declines. And some groups may even see small gains in participation, especially female workers.
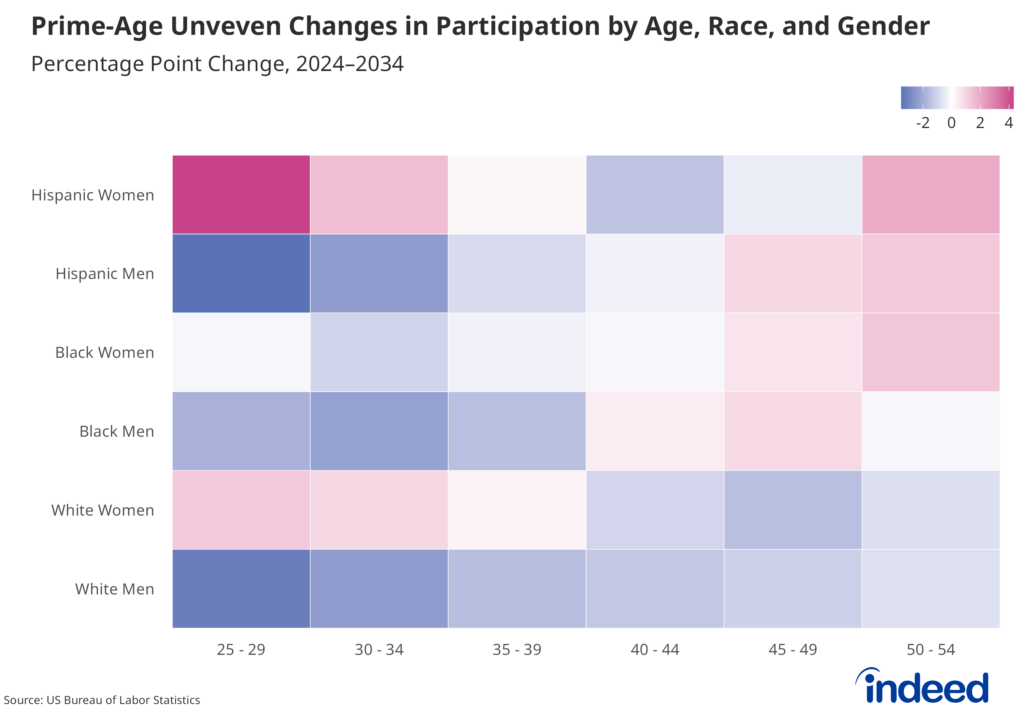
Prime-age workers remain the backbone of the labor force, with participation rates higher than those of younger and older workers. However, even a small decline translates into labor force losses, and the relative stability of their expected participation going forward isn’t enough to counterbalance the demographic pressures and ultimate losses from other groups.
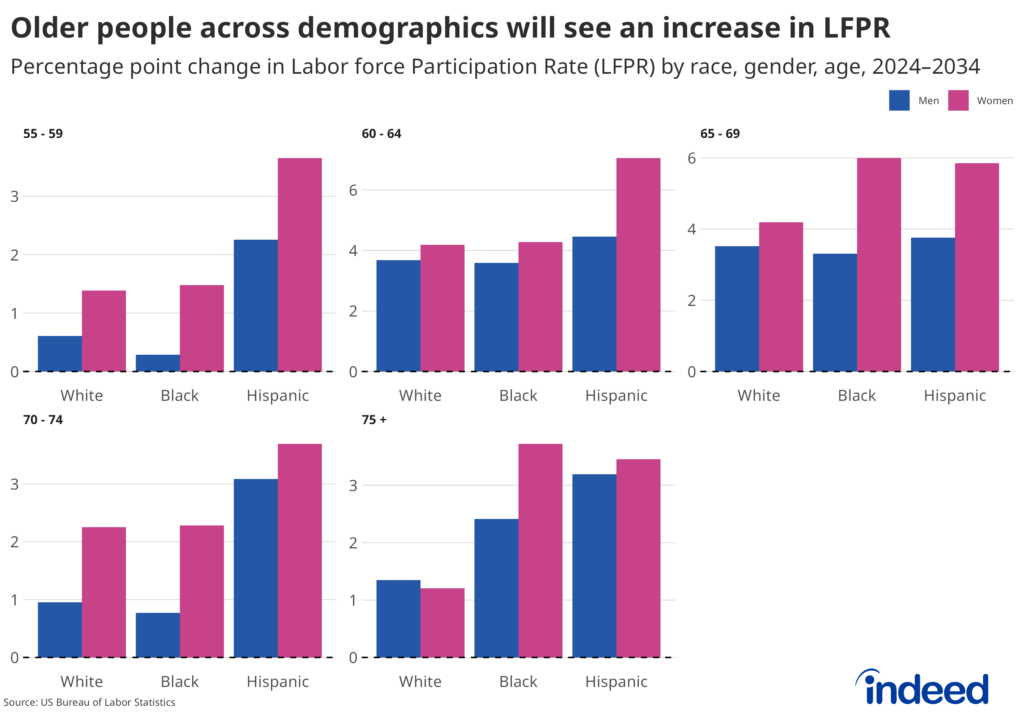
Older workers, 55 years and older, are retiring later
The overall labor force participation rate among those ages 55 and older is expected to fall from 38.4% to 36.9%, a 1.6 percentage point decrease, between 2024 and 2034. Older workers are staying in the labor force longer than in previous decades, even as participation among those 55 and older remains well below that of prime-age workers. Additionally, the overall increase in the share of the total population aged 55+ continues to place downward pressure on the total participation rate.
Interestingly, data for this age group shows that the LFPR is projected to rise across all age bands over the next decade. Among those ages 55 to 64, the aggregate LFPR is expected to increase from 65.9% in 2024 to 68.6% in 2034. For ages 65 to 74, it rises from 27.1% to 29.6%, and among those 75 and older, LFPR climbs from 8.6% to 10.2%. The reason for this may be a mix of financial necessity and shifting preferences. As defined benefit pensions are mostly replaced by defined contribution plans, more workers are exposed to market risk, which often requires longer work spans to ensure retirement security. Additionally, the nature of work has changed, and factors including technology, remote work, and flexible arrangements have made continued employment more feasible for older workers. Just as importantly, improved health and longevity mean many workers in their 60s and 70s are able, and often willing, to continue working.
Unsurprisingly, the largest gains in LFPR are concentrated among those ages 60 to 69, underscoring the steady extension of work spans. These increases are pronounced for women, who are projected to see the strongest participation gains, across nearly all age and race categories.
Even so, the population is aging and ultimately dominates the aggregate outcome. The fastest growth is occurring among those 75 and older, a group where participation, despite possibly rising, remains low at 10.2% by 2034. The population share in this age bracket is projected to increase from 9.2% in 2024 to 12.5% in 2034, pulling down the overall participation rate for the older age group.
Conclusion
The projections point to a demographic squeeze on the US labor market. As the population ages, workers move into older age groups where participation is lower. At the same time, fewer younger workers are entering the labor market, and prime-age participation rates decline slightly. Even with strong participation among prime-age workers and later retirements among older adults, the population is gradually shifting toward age groups with lower structural participation. The result is a slow but persistent decline in the overall LFPR.
For employers and policymakers, these trends suggest labor market tightness may increasingly reflect demographic realities rather than cyclical economic conditions. The result will be a labor force that is both smaller and older.
At the same time, technology is reshaping how work is performed. Recent work from the Indeed Hiring Lab shows that generative AI is transforming the tasks and skills within many jobs rather than eliminating them, with almost half (46%) of skills in a typical job potentially undergoing hybrid transformation by GenAI. While human oversight remains vital, GenAI can already handle a substantial amount of routine work. This transformation could enable companies to reduce their reliance on human labor over time, helping counteract the diminishing labor supply caused by demographic shifts.
Understanding both technology and demographic shifts will be essential for businesses to navigate the changing workforce landscape successfully.
Methodology
This analysis uses the labor force projections from the U.S Bureau of Labor Statistics covering the 2024-34 period. The data include labor force levels, civilian noninstitutional population, and labor force participation rates by age, gender, race, and ethnicity.
The projections assume full employment for the target year and are based on the economic conditions, demographic trends, and policies in place as of 2024. Changes in immigration flows, labor market demands, or workforce policies after 2024 are not incorporated into this analysis.
Percentage point changes are calculated as the difference between the projected values for 2034 and 2024.
To illustrate relative growth and decline across demographic groups, population and labor force levels are indexed to a 2024 baseline equal to 100. This normalization highlights the proportional changes in each group over time.