Key points:
- Job openings increased slightly to 6.9 million in January from a revised 6.6 million in December, according to the US Bureau of Labor Statistics.
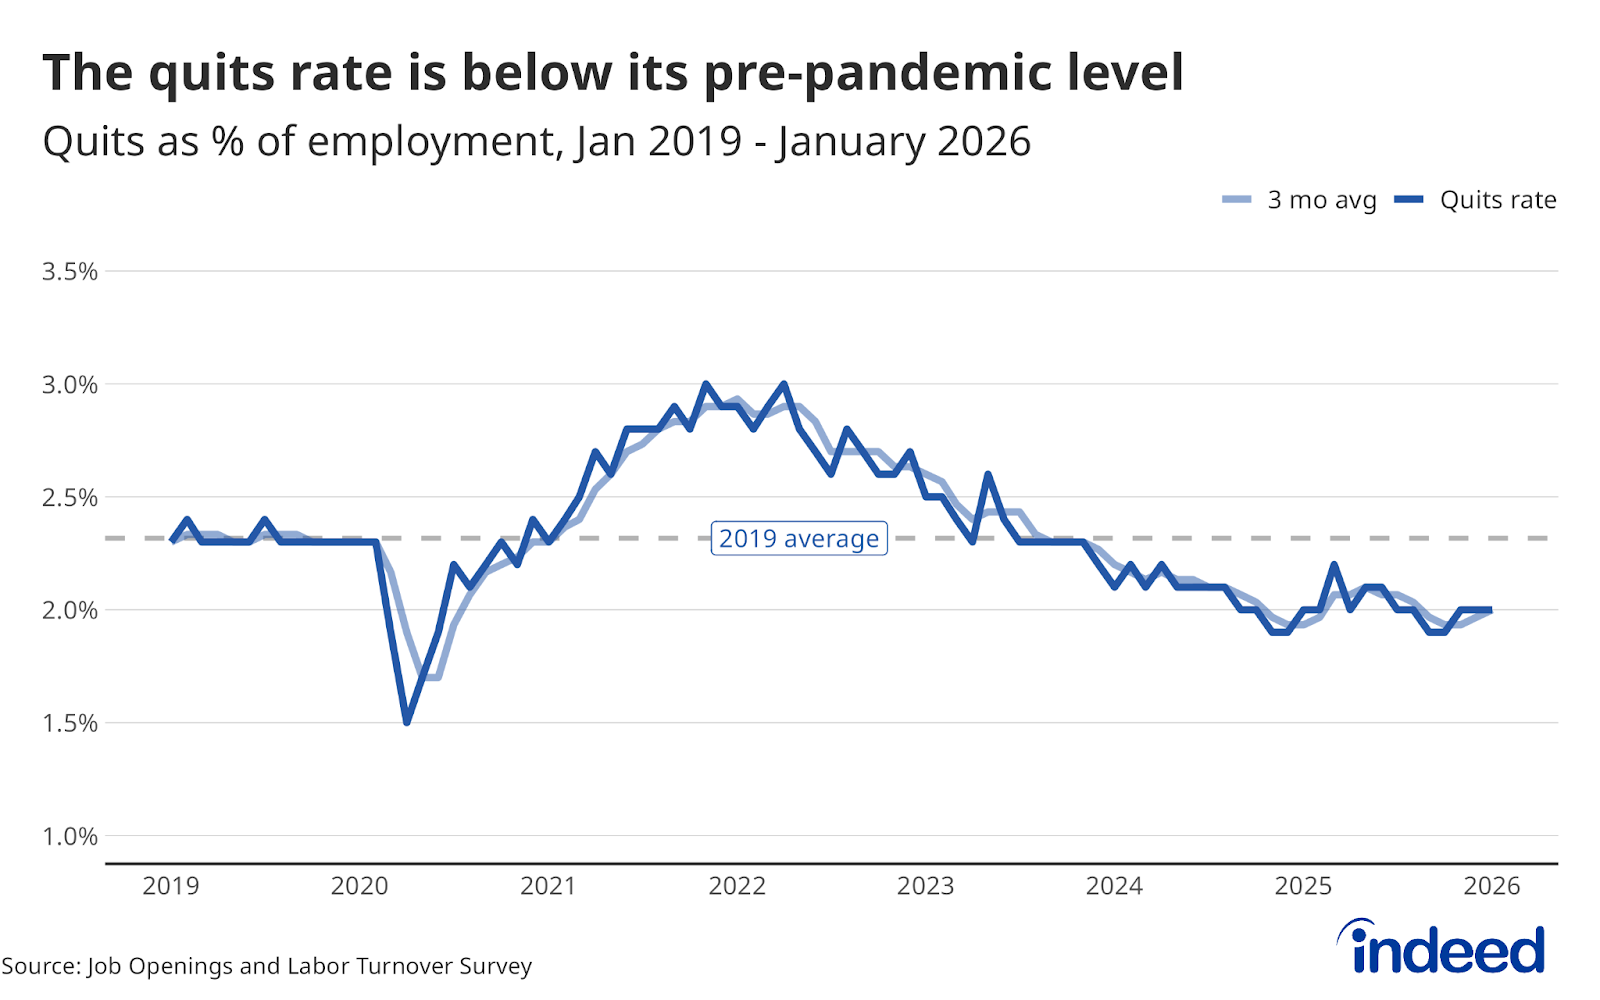
- The quits rate remained at 2.0, and has been at or below that level for seven consecutive months.
- Total layoffs and discharges decreased slightly to a 1.0% layoff rate.
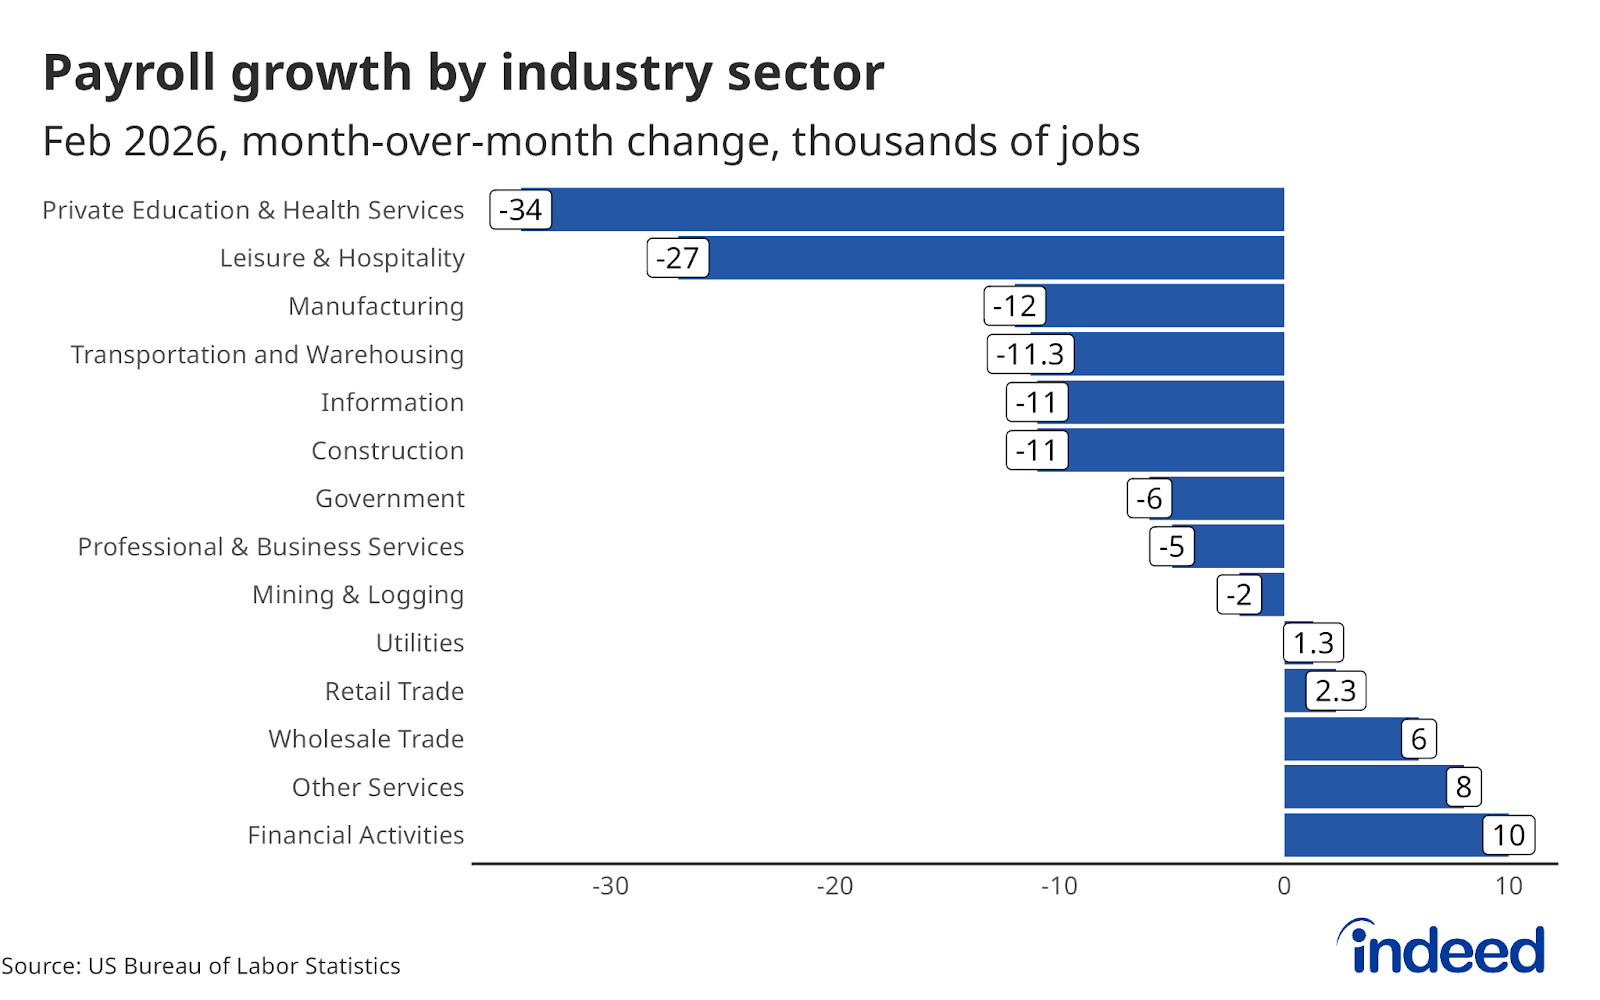
The modest uptick in job openings in January, to 6.9 million from an upwardly revised 6.6 million in December, offers a small chance to exhale for a market that has otherwise been holding its breath amid ongoing volatility and uncertainty. There was little change across most sectors, with financial activities seeing the largest month-over-month increase in openings. Revisions to 2025, included in the report, showed relatively large downward revisions to job openings over the year, but revisions were minimal across hires, quits, and layoffs. There is no doubt that 2026 started much the same way as 2025 ended, dominated by a persistent “low-hire/low-fire” dynamic that is proving difficult to break and complicating the job search for many Americans. Any upward movement in job openings is welcome, but the longer-term trend has been unmistakably downward, with openings well below recent highs and in territory that not long ago would have been considered fairly weak by most standards.
The quits rate has now remained at or below 2.0% for seven consecutive months, with rates below 1.5% in the government, financial activities, and manufacturing sectors. The quits rate is a critical barometer of worker confidence, and that confidence has remained stubbornly, conspicuously low. Workers don’t quit jobs they can’t afford to leave, and the continued softness in quits suggests that for most Americans, the calculus of job-switching still feels too risky. While quits are relatively high compared to longer-term averages in some sectors (notably healthcare and social assistance), it’s generally unsurprising to see people hugging their jobs in an environment marked by persistent uncertainty and deteriorating labor market data. Until quits recover, the broader dynamism that drives wage competition, career mobility, and economic momentum will remain largely absent.

Looking ahead, the latest data puts the Federal Reserve in a difficult position as they weigh whether to cut rates. Inflation remains stubbornly above their 2.0% target, and recent geopolitical conflicts are likely to provide additional upward pressure on prices. At the same time, indicators of a softening and increasingly fragile labor market are mounting. Cutting rates might help improve the labor market, but could also be inflationary. Raising rates could help curb inflation but might cause further labor market deterioration. This, along with heightened economic uncertainty, increases the probability that the FOMC holds rates steady at next week’s meeting.