
Key points:
- Globally, AI adoption at work varies dramatically across countries. 70% of employed workers in Ireland say they have used the technology at work, compared to just 18% in Japan. Among observable factors, employer encouragement shows a strong association with adoption rates.
- AI users consistently feel they need more training than non-users, suggesting that hands-on experience reveals how much there is to learn. A significant share of non-users see no need for AI training at all.
- Between 16% and 40% of workers are disengaged with AI; they don’t use AI, and don’t feel they need training on AI. This group is more likely to be older, in manual occupations, and less engaged at work.
- Those who do use AI report meaningful time savings: over 80% save at least one hour daily, freeing them up for additional tasks, task qualities, and earlier departures.
The rise of generative AI has sparked widespread discussion about how it will reshape work. The headlines foretell both productivity gains and job displacement, but a more nuanced picture is emerging: AI adoption is creating distinct groups of workers with very different relationships to the technology.
Using data from the 2025 Indeed Workforce Insights Report, which surveyed approximately 80,000 workers across eight countries, we find that across demographics, AI users are more engaged at work. Meanwhile, a substantial segment of workers remains disconnected from both AI and broader career development — a pattern that carries significant implications for employers and policymakers alike.
The Global AI Adoption Landscape
AI adoption at work varies considerably across countries. In Ireland, 70% of employed workers said they have used AI at least more than once per month in their jobs, followed by Australia at 48%, Germany at 46%, the United States at 43% and the United Kingdom at 41%. At the other end of the spectrum, Japan stands at just 18%, with France in the middle at around 39%.
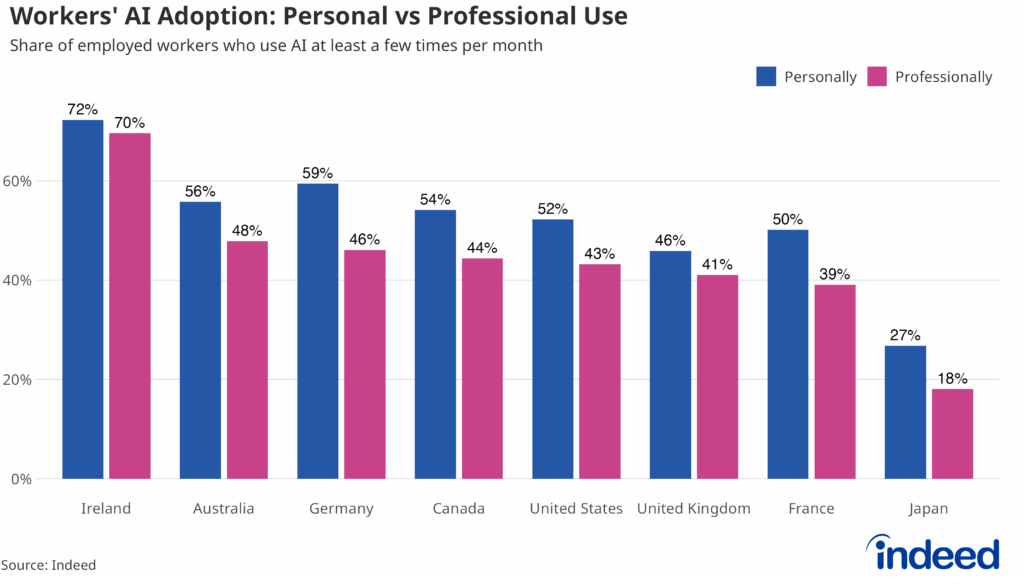
Despite country-country differences, one pattern holds steady: personal use exceeds professional use. In our data, this gap ranges from 3 percentage points in Ireland to 13 percentage points in Germany. This suggests workers may be more comfortable exploring AI on their own terms rather than in workplace settings, and/or that using AI at work may not be required cases, but still holds personal interest.
What explains the cross-country differences within our data? Among the factors observable in survey data, employer encouragement stands out as strongly correlated with adoption. In Ireland, 37% of workers report high levels of employer encouragement to use AI, compared to just 12% in Japan. Across all eight countries, we find that workers whose employers actively encourage AI use are significantly more likely to actually use AI at work, with the gap ranging from 28 percentage points in Ireland to 54 percentage points in Japan.
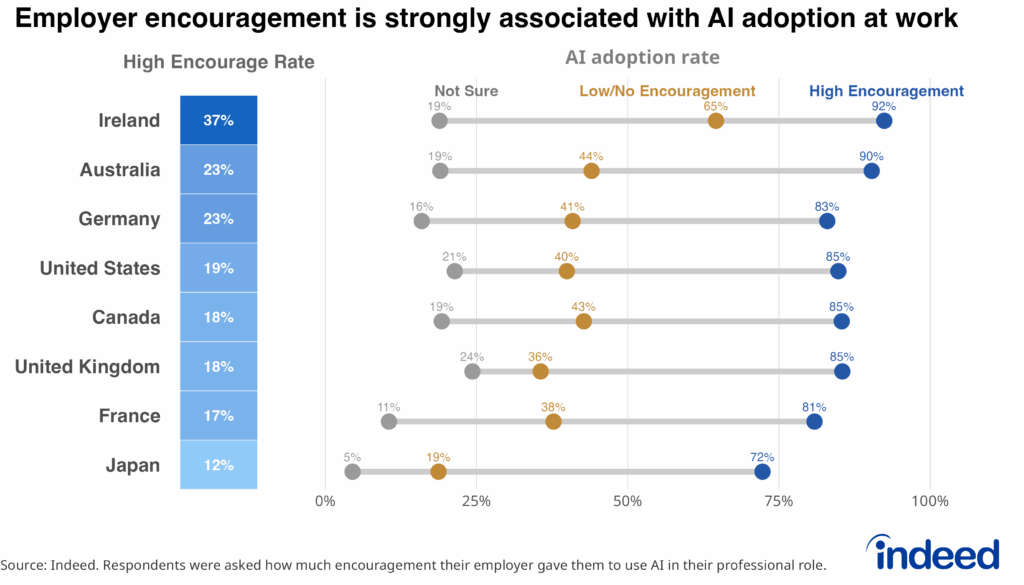
This pattern suggests that organizational support plays an important role in AI adoption, though other factors not captured in our survey — such as industry composition, regulatory environment, or technological infrastructure — may also contribute to cross-country differences. The implication is clear: If employers want workers to use AI effectively, encouragement and training are likely to matter more than waiting for workers to adapt on their own.
But what happens to workers who do adopt AI — and to those who don’t?
Who Wants More Training on AI?
Demand for AI training varies significantly across countries—and it closely mirrors patterns in employer encouragement. Workers in countries with lower encouragement rates report the highest rates of feeling undertrained. In Japan, where just 12% of workers receive strong employer encouragement, 61% of AI users feel they lack adequate training. France shows a similar pattern: 17% encouragement, 54% feeling undertrained. At the other end, the United States—where encouragement is higher—shows the lowest rates of feeling undertrained at 41%.
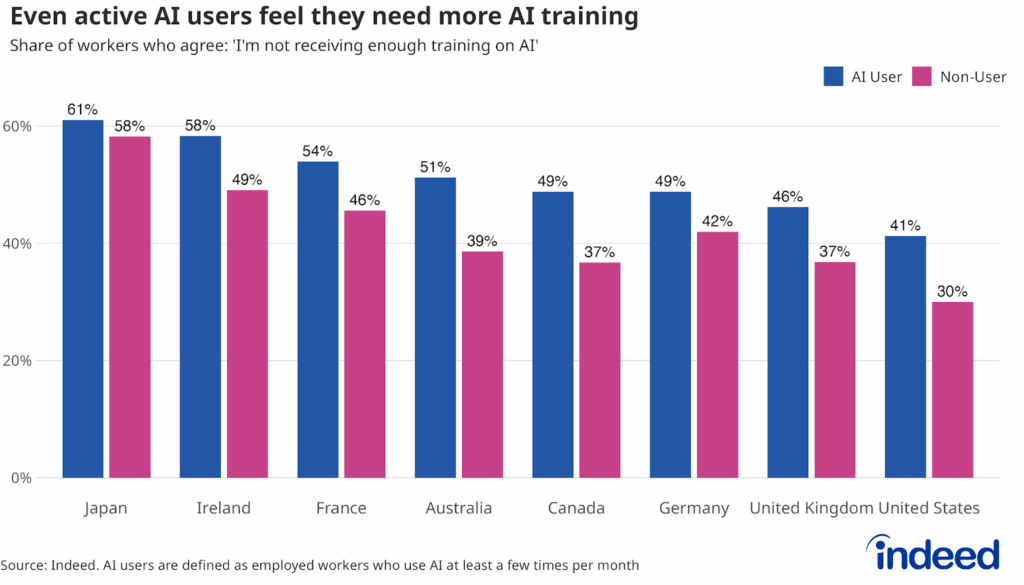
But the country-level view masks an important divide: AI users are consistently more likely to feel undertrained than non-users. This gap appears across all eight countries, ranging from 3 percentage points in Japan to 13 percentage points in Australia.
Why do AI users feel they need more training? One interpretation is that hands-on experience reveals just how much there is to learn — users discover capabilities they haven’t mastered and applications they haven’t explored. Another possibility is that AI users are simply more attuned to technological change and more inclined toward continuous development.
Either way, the takeaway is clear: Those who engage with AI want more support, while many of those who don’t may not realize what they’re missing.
This raises a question: What about workers who neither use AI nor feel they need training? Are they simply in roles where AI isn’t relevant — or are they at risk of being left behind?
Workers disengaged from AI
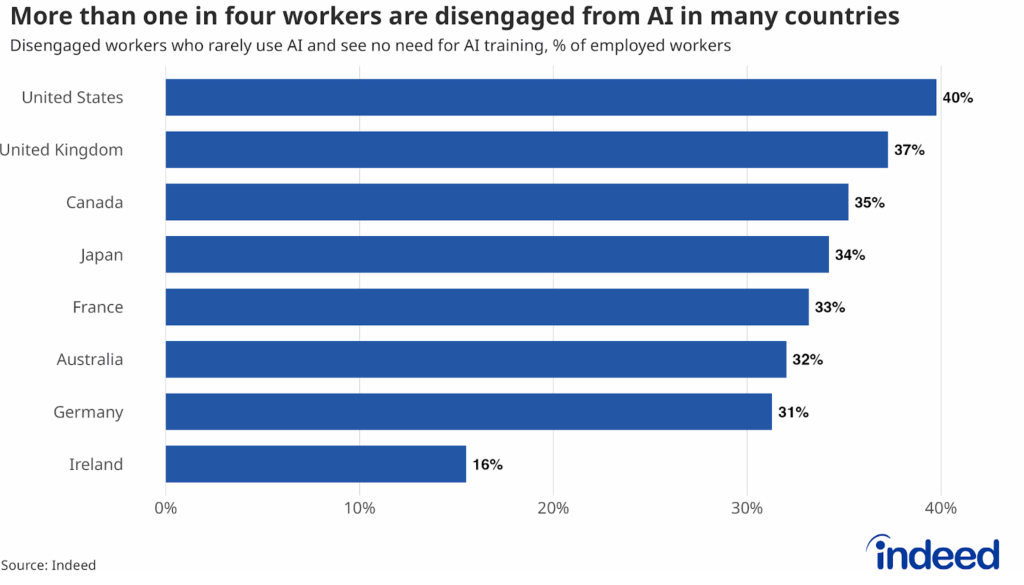
Who are these disengaged workers — those who neither regularly use AI nor feel they need training on AI? They represent between 16% (Ireland) and 40% (United States) of employed survey respondents. What’s notable is not active resistance to AI, but a lack of engagement with both the technology and broader career development.
Who are these workers? The data reveals clear patterns:
Age: Older workers are more likely to fall into this group. In the UK, 50% of workers aged 55 and older fall into this category, compared to 40% of those aged 18-24. Notably, Japan shows elevated rates even among young workers (37% for ages 18-24), suggesting that the pattern isn’t solely a function of career stage.
Occupation Type: Workers in manual and production roles have the highest rates of disengagement — reaching 62% in the UK. Those in knowledge-based occupations, by contrast, have the lowest rates (8-30% depending on country). This occupational divide underscores how unevenly AI is being adopted across job types. Notably, even in knowledge-based roles, the United States and Japan show an elevated rate of 30% and 27%, respectively.
Engagement & Culture: Workers in this segment consistently differ from their peers in how they view both their workplace and AI. The largest gap appears in AI perception — disengaged workers are 35-49 percentage points less likely to believe AI makes work more efficient. They are also 6-25 percentage points less likely to worry that AI will reduce job opportunities, suggesting that AI feels distant and irrelevant to their work lives.
Workplace engagement gaps are smaller but consistent: Disengaged workers are 7-20 percentage points less likely to report that their workplace culture allows them to thrive professionally. Likewise, disengaged workers are 3-16 points less likely to feel a sense of purpose in their work across countries.
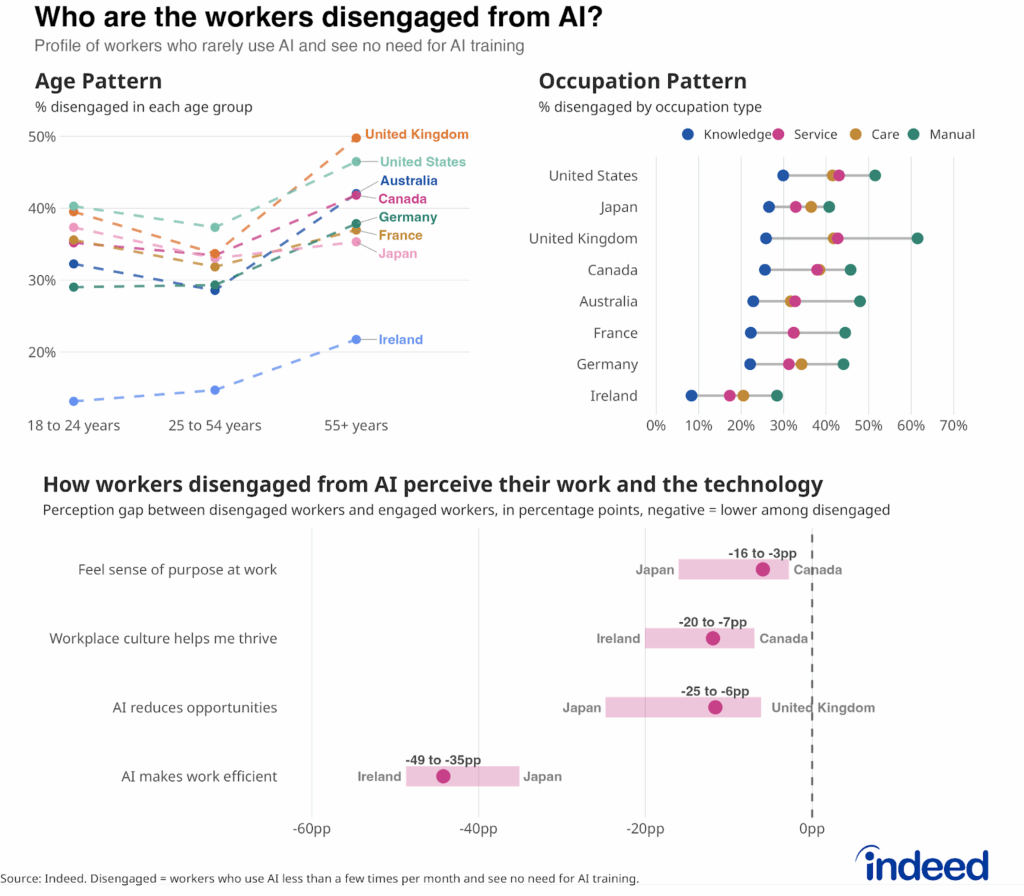
The lower scores on workplace thriving (7-20 percentage points) and sense of purpose (3-16 points) suggest that AI disengagement does not exist in isolation; it appears linked to broader workplace detachment. Whether one causes the other remains an open question, but the association is consistent across all eight countries.
Japan shows a somewhat different pattern. While other countries show clear age and occupation gradients, Japan’s disengagement is more evenly spread — even young workers and those in knowledge-based roles show relatively high rates. This suggests that workplace culture and training opportunities may play a larger role in Japan than demographic or occupational factors alone.
What Do AI Users Actually Experience?
Workers disengaged from AI are 35-49 percentage points less likely to believe AI makes work more efficient. But what do AI users themselves report about the benefits? The data suggests those who aren’t embracing AI may be missing out.
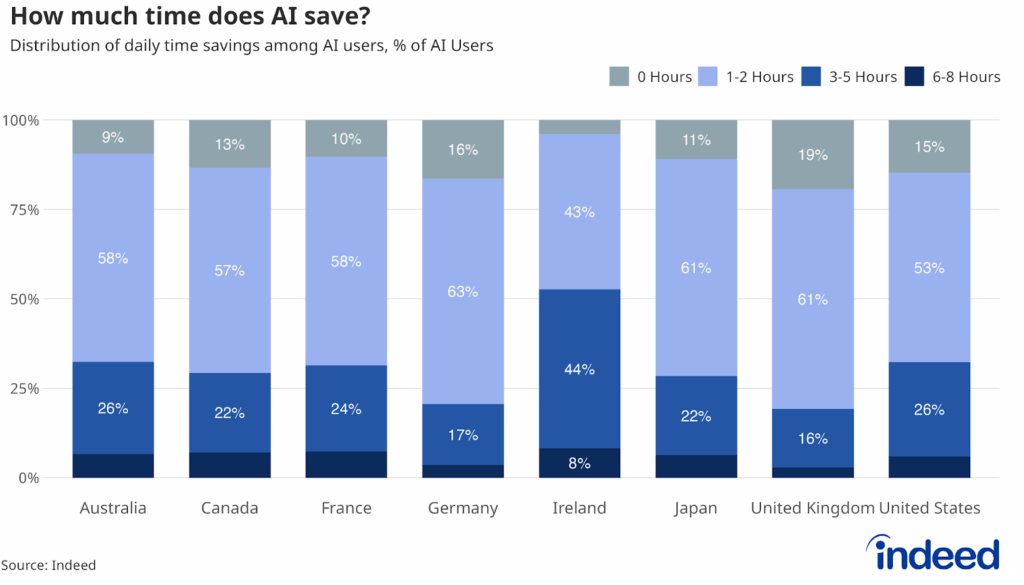
Time savings are real and significant. Across all eight countries, 81-96% of AI users report saving at least one hour per day through AI tools. In Ireland, where AI adoption is highest, half of users said they save three or more hours daily. Even in countries with more modest adoption, the majority of AI users report meaningful time savings.
Not everyone benefits equally, however. In the United Kingdom, one-fifth of AI users report saving no time at all — the highest rate among the eight countries. This variation suggests that simply using AI is not enough; how it’s integrated into workflows matters.
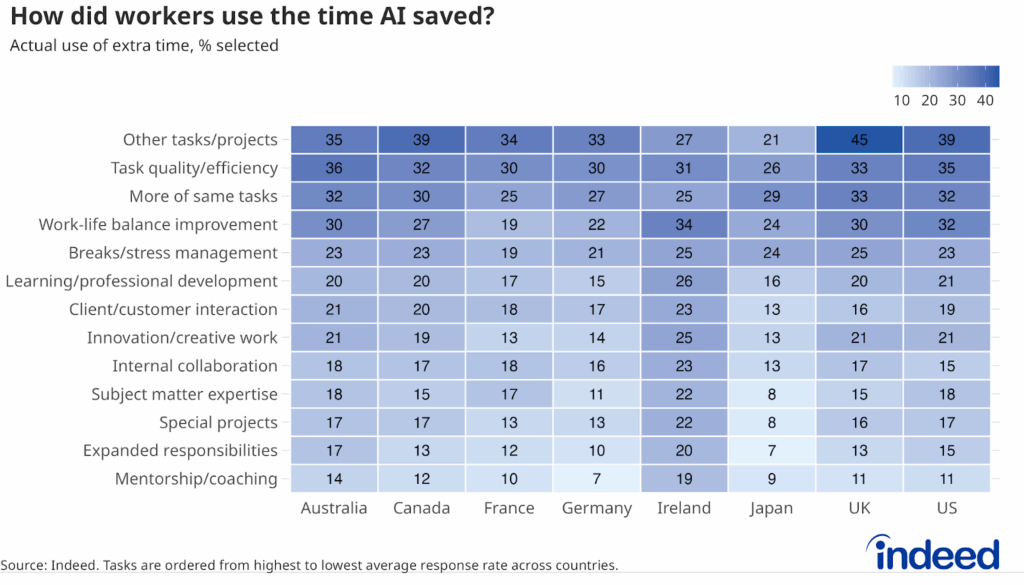
Where does the saved time go? When asked how they actually use time freed up by AI, workers’ top responses reveal a mix of productivity and personal benefit.
The most common use is taking on other tasks and projects (21-45%), with UK workers leading at 45% and Japan lowest at 21%. Around one-third use the time to enhance the quality and efficiency of their current tasks (26-36%). A similar share uses the time for more of the same tasks (25-33%), increasing throughput on existing responsibilities.
Improved work-life balance also features prominently, ranging from 19% in France to 34% in Ireland and 32% in the US. Workers also redirect saved time toward breaks and stress management (19-25% across countries), learning and professional development (15-26%), and innovation and creative work (13-25%).
Ireland stands out as the country where AI users most actively channel saved time into higher-value activities: 34% toward improved work-life balance, 26% toward learning and professional development, and 25% toward innovation and creative work.
Implications for Employers
These findings suggest four priorities. First, employer encouragement appears to be a key lever for AI adoption. Organizations seeking broader usage should invest in active support rather than passive availability. Second, training needs are widespread and persistent: Even active AI users report insufficient training, indicating that one-time introductions are inadequate. Ongoing skill development will be essential as AI capabilities evolve. Third, the disengaged segment — older workers, manual occupations, and those with lower workplace engagement — may require targeted outreach, as they currently see no need for change. Finally, the productivity benefits are tangible: Over 80% of AI users report saving at least one hour daily, with many redirecting that time toward higher-value work such as improving task quality, learning, and creative projects. Employers who take into consideration all priorities are well-positioned in an evolving and competitive job market.
Methodology
This analysis utilizes data collected from an online survey, conducted for Indeed Hiring Lab by YouGov, across eight countries: Australia, Canada, France, Germany, Ireland, Japan, the United Kingdom, and the United States. Fieldwork was conducted in May and June of 2025, with a total of n=80,936 interviews globally, and a minimum of n=10,000 interviews per market. This sample size provides a margin of error of ±1% at the 95% confidence level within each market.
Sampling was random and representative, with all responses weighted based on age, gender, education, and region in all markets, and by race, aligned to the US Census Bureau, American Community Survey, 2022. Any percentage point differences referred to in the text are statistically significant at the 10% level or better unless otherwise noted.
Encouragement levels are classified into three categories: “High Encouragement,” “Low/No Encouragement,” and “Not sure.”
- High Encouragement: Respondents who selected “AI is a core part of the company’s operations” or “AI is adopted, and its use is widely encouraged across all teams, but it is not essential.”
- Low/No Encouragement: Respondents who selected “AI is adopted and encouraged, but only in certain departments or functions,” “AI has not been adopted or encouraged in the company,” or“AI has been actively discouraged in the company.”
- Not sure: Respondents who selected “I’m not sure.”
AI users are defined as those who said they use AI more than one per month. This data shows adoption rates are higher than some other recent estimates. The Federal Reserve Bank of St. Louis’s Real-Time Population Survey found that 37% of US workers used generative AI for work as of August 2025 —compared to our figure of 43%. Eurostat’s 2025 data (isoc_ai_iaiu) shows 16% for Germany and 18% for France. Japan shows a similar result to our previous survey data regarding GenAI. The exact reasons for these gaps are unclear, but likely reflect methodological differences: our survey asks about “AI tools” broadly rather than “generative AI” specifically, focuses on employed workers rather than all adults, and captures any frequency of use rather than use within a specific timeframe.