
Key points:
- The nationwide unemployment rate rose to 4.6% in November, according to the Bureau of Labor Statistics, but was much higher for certain groups.
- Employer demand is increasingly concentrated among healthcare fields, squeezing out workers who don’t want or are not qualified for these jobs.
- Unemployment has risen both for the least- and most-educated workers.
Our monthly Labor Market Update examines important trends using Indeed and other labor market data. Our US Labor Market Overview chartbook provides a more comprehensive view of the US labor market. Data from our Job Postings Index and the Indeed Wage Tracker (including sector-level data) are regularly updated and can be accessed on our data portal.
The combined October and November jobs report brought much-anticipated (and missed) data. And while it will always need an asterisk beside it, several things stood out as interesting tidbits as we close out 2025.
Healthcare continues to crush it, but other sectors range from stagnant to suffering
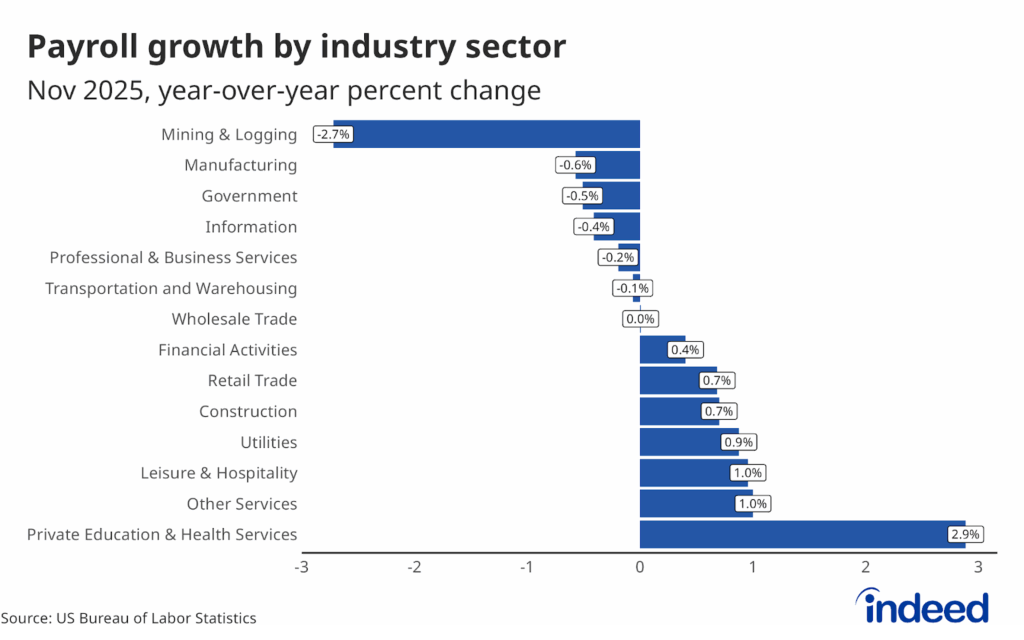
This is not a new story, and it’s one we find ourselves telling time and time again. But the pattern isn’t changing, and over time, the imbalance is becoming more troubling. Since November 2024, the private education and health services sector has seen employment growth of 2.9%, with nearly all of this increase coming from the healthcare side of the sector. Not only is this the only sector that has grown by more than 1.0% this year, but the growth in jobs in the healthcare and social assistance subsector alone has eclipsed net job growth in the US since this time last year.
This aligns with what we are seeing in our Indeed data as well. Six of the 10 occupational sectors with the highest Indeed Job Posting Index (JPI) are in healthcare fields, and there are no healthcare sectors represented in the bottom 10. Postings for physicians and surgeons, therapy, and personal and home health remain more than 50% higher than they were in February 2020.

Ongoing strength in healthcare is not surprising. Baby Boomers are now all over the age of 60, causing a demand surge in the field. Additionally, years of low interest rates and strong asset growth have made Baby Boomers an incredibly wealthy generation. This wealth increases their taste for healthcare, leading them to consume more (and more expensive) care.
While the high and growing demand for healthcare workers makes sense, it is the uncertain future supply of those workers that is most worrisome. Not everyone can — or should — simply snap their fingers and become a healthcare worker. These jobs require skills ranging from short-term training to many years of medical school, residencies, and fellowships. Labor supply remains constrained in many of these fields, and continuously expanding demand without related expansion in the supply of workers will eventually lead to a true supply crisis — a problem already happening in certain fields. Continued growth will require continued education and training at a pace that likely exceeds current levels.
Some demographic groups have seen serious increases in unemployment rates
The overall unemployment rate was 4.6% in November, according to this week’s jobs report. While not overly concerning in general, it is the highest rate since early 2017 (ignoring the pandemic). And, potentially more troubling, we are inching closer to triggering the so-called “Sahm rule,” which indicates that the US has historically entered a recession when the unemployment rate has increased by more than half a percentage point in a 12-month period. As of November, it has risen 0.4 points over the past 12 months.
But some demographic groups have experienced more extreme recent increases in unemployment rates, including the young and some racial groups. The unemployment rate for the youngest workers aged 16-19, where unemployment is typically much higher than the overall average (mostly due to inexperience), has risen to 16.3%, up from roughly 13% at this time last year. Absent the pandemic, this is the highest unemployment rate for this group since September 2015.
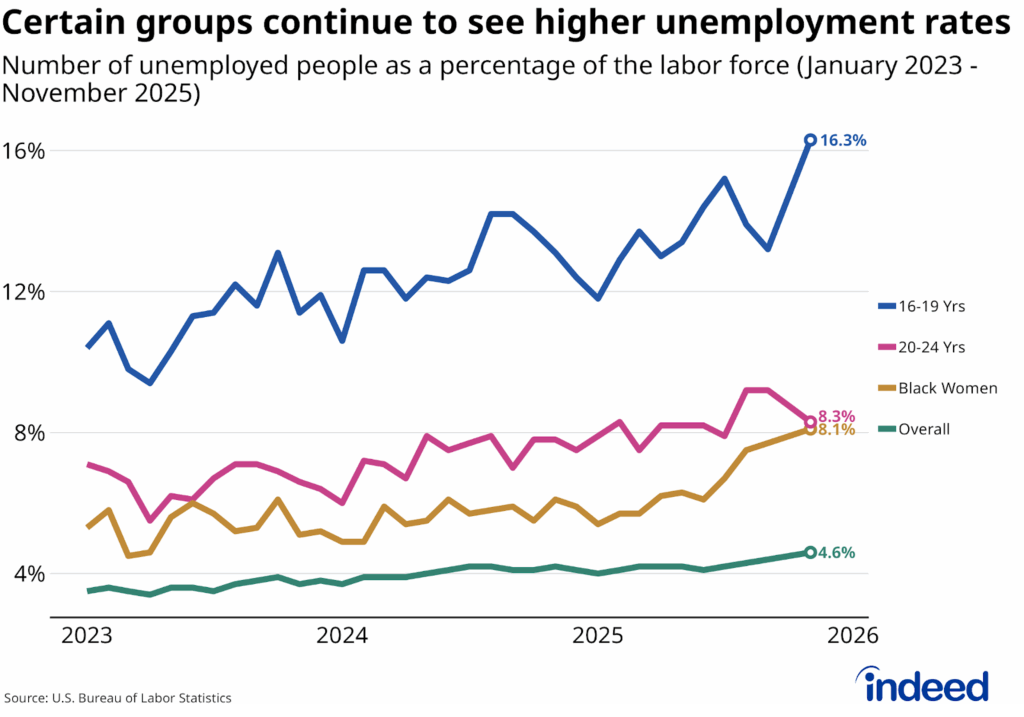
Unemployment among slightly older workers between the ages of 20-24 is faring better but has still risen notably throughout 2025, hitting a max of 9.2% in September before declining back to 8.3% in November. Interestingly, while overall unemployment rates in this specific age group are higher for men (9.1%) than women (7.1%), unemployment has risen faster over the past year among 20-24-year-old women than it has among men of the same age (up 0.8 percentage points since November 2024, compared to 0.1 for men).
Black females in particular have also seen a shocking increase in their unemployment rate this year, rising from 6.1% in November 2024 to 8.1% in November 2025, the highest rate observed since May 2016 (again, outside of the pandemic). A year ago, there was a 1.9 percentage point gap between the overall unemployment rate and the unemployment rate for Black women (4.2% vs 6.1%). That has now increased to 3.5 points, the widest since March 2016 (once again, ignoring the pandemic).
Unemployment is rising at the bottom and top of the education distribution
Historically, there has been a strong and unbroken relationship between unemployment rates and educational attainment – unemployment has always been lower among the most-educated workers. This story still holds, but it has changed a bit in 2025. A year ago, the unemployment rate for those with a bachelor’s degree or higher was 2.3%, compared to 4.4% for those with just a high school diploma. Over the past year, however, the unemployment rate for college graduates has climbed notably, rising to 2.9% in November 2025. On the contrary, unemployment rates for high school graduates have remained constant at 4.4%. The result is a reduction in the gap from 2.1 percentage points to 1.5 percentage points.
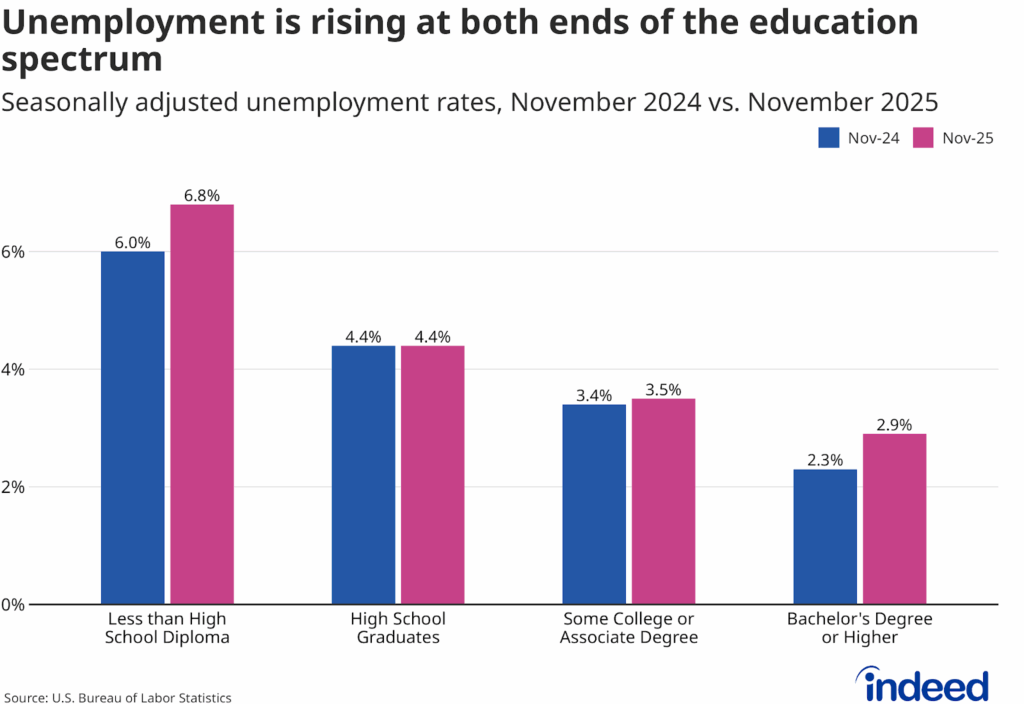
Unemployment rates have also increased substantially for those without a high school diploma, increasing from 6.0% in November 2024 to 6.8% in November 2025. These workers have faced lower unemployment rates than are typical in the past few years (outside of the pandemic), reversing a trend of elevated unemployment rates that existed for years following the Great Recession in 2007-2009.
This fits with the data we’ve seen both from the BLS and our internal data at Indeed. There is continued strong demand for workers in technical trades, healthcare fields, and leisure and hospitality, and many of those jobs require a high school degree and/or some form of technical training. The softness in the economy has been concentrated in business and professional services, the federal government, tech, and information (media), all of which are more likely to require a bachelor’s degree.
Conclusion
From a macro point of view, the low-hire-low-fire environment we’ve seen for most of 2025 continues as we exit the year. But underneath the hood, particular groups — be it workers in specific sectors or of certain races, ages, or education — are experiencing the labor market quite differently. The labor market of 2026 is likely to do one of two things: improve to the point where non-healthcare sectors begin to add jobs again, or further deteriorate, leading to an even more lopsided labor market. We hope for the former, but it would behoove us to also prepare for the latter.
Methodology
Data on seasonally adjusted Indeed job postings are an index of the number of job postings on a given day, using a seven-day trailing average. February 1, 2020, is our pre-pandemic baseline, so the index is set to 100 on that day. Data for several dates in 2021 and 2022 are missing and were interpolated.
The number of job postings on Indeed.com, whether related to paid or unpaid job solicitations, is not indicative of potential revenue or earnings of Indeed, which comprises a significant percentage of the HR Technology segment of its parent company, Recruit Holdings Co., Ltd. Job posting numbers are provided for information purposes only and should not be viewed as an indicator of performance of Indeed or Recruit. Please refer to the Recruit Holdings investor relations website and regulatory filings in Japan for more detailed information on revenue generation by Recruit’s HR Technology segment.