Key points:
- According to the US Bureau of Labor Statistics, job openings rose to 7.7 million in September and October, from 7.2 million in August.
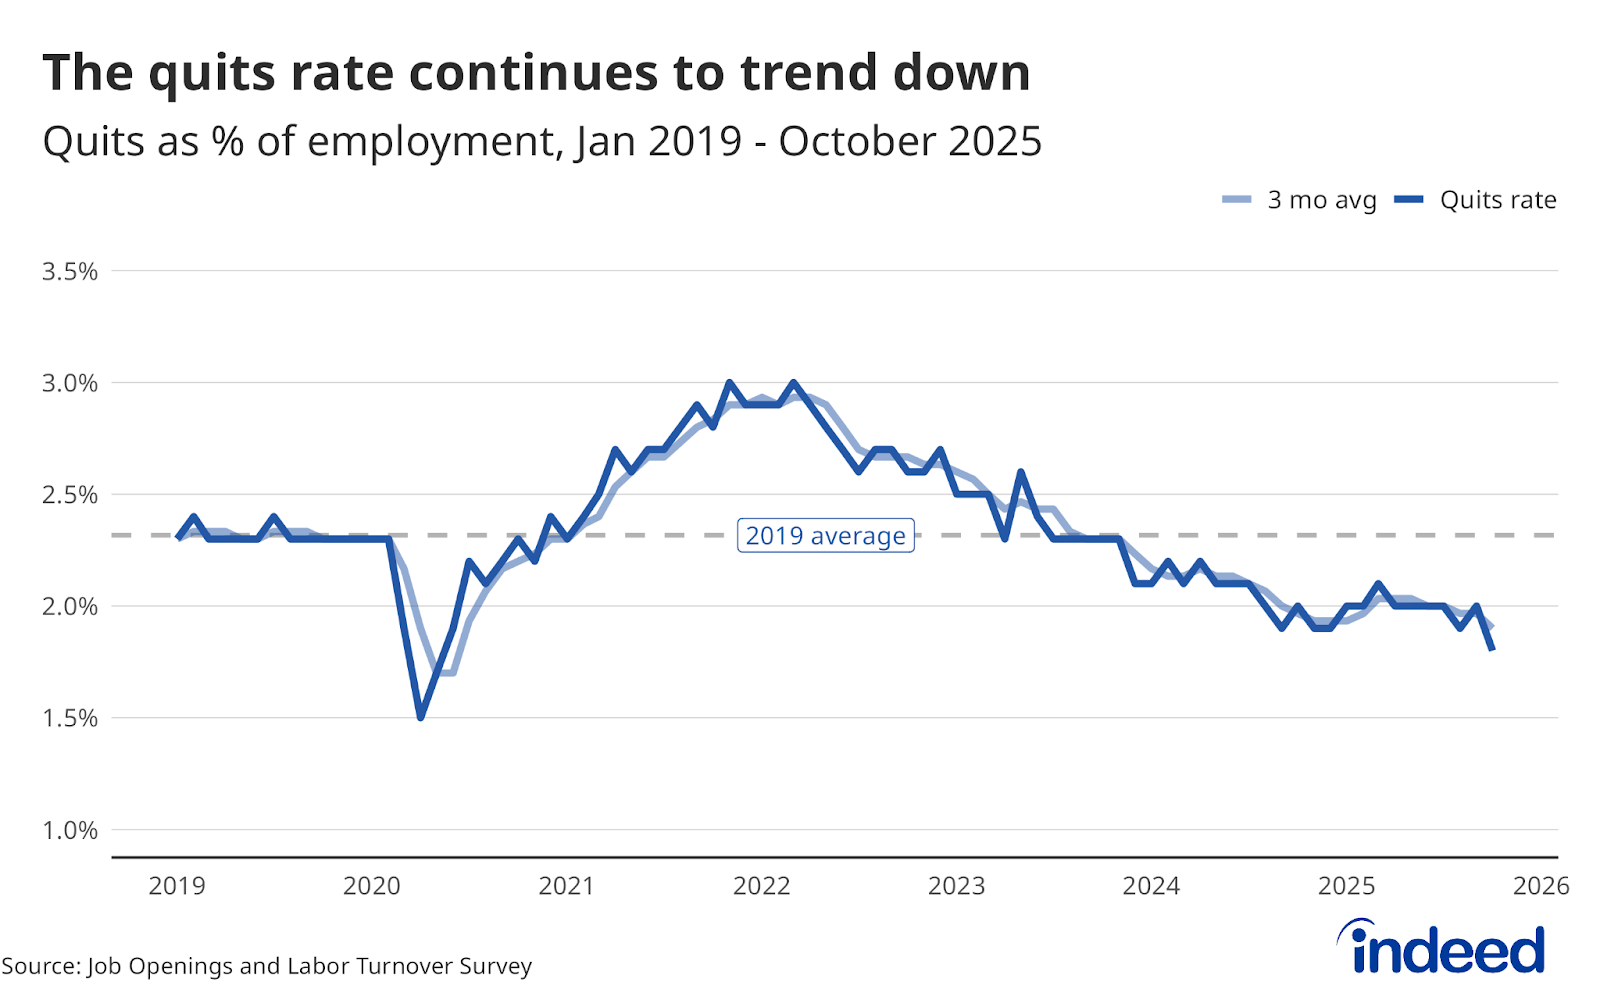
- There were 2.9 million quits in October, roughly unchanged from the prior month, while the quits rate stood at 1.8%.
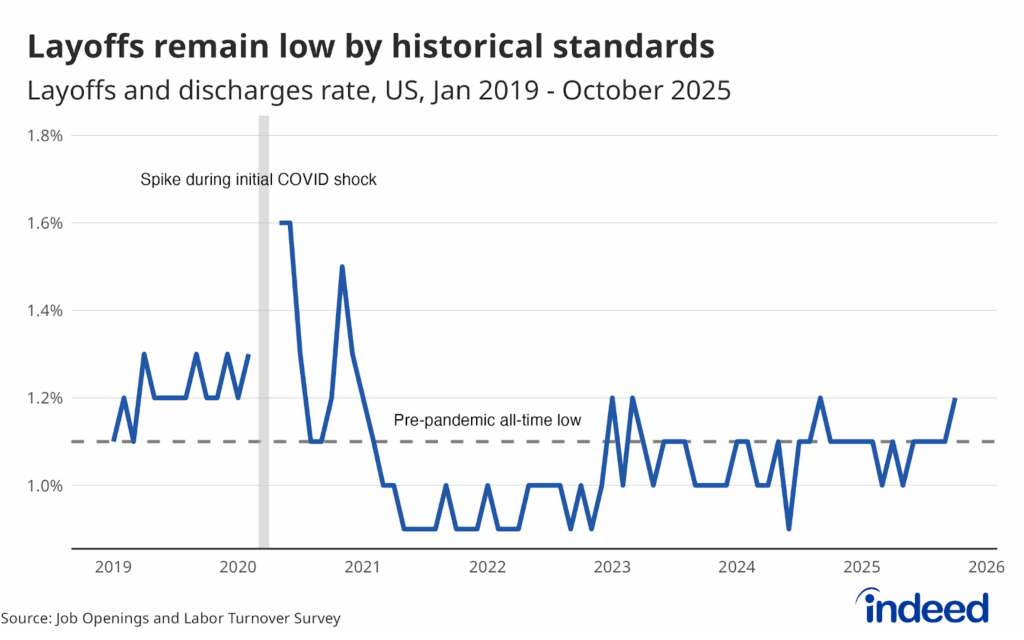
- Total layoffs and discharges edged up slightly to a layoff rate of 1.2%.
Today’s JOLTS data echoes a familiar theme — solid headline numbers masking more troubling data just below the surface. The data show headline demand ticking up, with job openings rising from 7.2 million in August to 7.7 million in both September and October, driven in large part by a pickup in trade, transportation, and utilities jobs. But the uptick in demand should not be mistaken for genuine momentum in the labor market. If the economy really was doing as well as the headline numbers suggest, we would be seeing a lot more churn in the market as workers gained the confidence to move from one job to the next. Instead, the quits rate continues to fall, hitting just 1.8% in October, its lowest level (outside the pandemic) since 2014. And layoffs ticked up — not to any overly concerning level, but definitely moving in the wrong direction.
Despite recent high-profile layoff announcements and a slight uptick in October, layoffs remain near historically low levels. Between 2016 and 2019, around 1.8 million workers were laid off or let go each month, an average layoff rate of 1.2%. October data was in lockstep with those historical averages as employers cut 1.9 million workers, resulting in a 1.2% layoff rate. While job cuts at some notable companies have increased in recent months, the majority of employers are still retaining workers in this “low-fire” environment.
Today’s report is unlikely to move the Federal Reserve’s opinion much. The labor market still appears to be stuck in what Chair Powell has called a “curious kind of balance” — curious simply because these dynamics usually don’t exist together at once, or at least not for very long. For now, things are steady. However, it feels like sooner or later, something will need to break — hiring will need to pick up, or layoffs will continue to rise. Data from JOLTS and the Indeed Job Posting Index show that demand for workers has clearly slowed, but may be leveling off. But labor force supply growth is also slowing amid shifts in immigration policy and a pullback in labor force participation. If demand and supply slow roughly in tandem, the labor market can maintain that balance. If demand pulls back faster than supply, that could lead to higher unemployment and spell trouble for the labor market.