
Key Points:
- U.S. posted wage growth as measured by the Indeed Wage Tracker slowed to an annual pace of 3.1% in March, equal to its pre-pandemic, 2019 average. Wage growth slowed from a year ago across nearly all sectors analyzed.
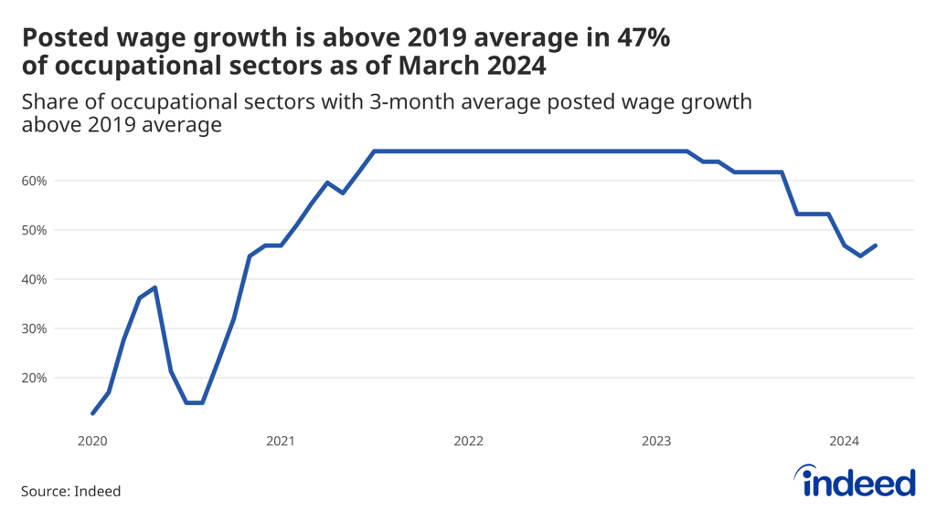
- While down from the past year, posted wage growth remains higher than 2019 levels in almost half (47%) of sectors analyzed, as sector-specific wage growth slows at different paces.
- Childcare continues to be one of the sectors with the fastest-growing posted wages, even as pandemic-era federal emergency funding expires.
Our monthly Labor Market Update looks at an important labor market trend through the lens of Indeed data. A more comprehensive view of the US labor market can be found in our US Labor Market Overview chartbook. Data from our Job Postings Index — which stands 17.5% above its pre-pandemic baseline as of April 5 — and the Indeed Wage Tracker are regularly updated, and can be downloaded on our data portal and GitHub.
Nationwide, posted wage growth as measured by the Indeed Wage Tracker has cooled drastically after reaching a feverish pace in 2022, and is now growing at the same pace as it was prior to the pandemic in 2019. National posted wage growth slowed to 3.1% year-over-year in March, equal to 2019’s average, and down from 3.3% in February and a recent peak of 9.3% in January 2022.
But the national average pace of growth is only part of the story. At the sector level, year-over-year wage growth in March was still higher than the pre-pandemic average in almost half (47%) of the categories analyzed. In other words, wage growth is cooling after reaching a feverish pace in 2022, but hasn’t quite returned to pre-pandemic averages for all sectors.
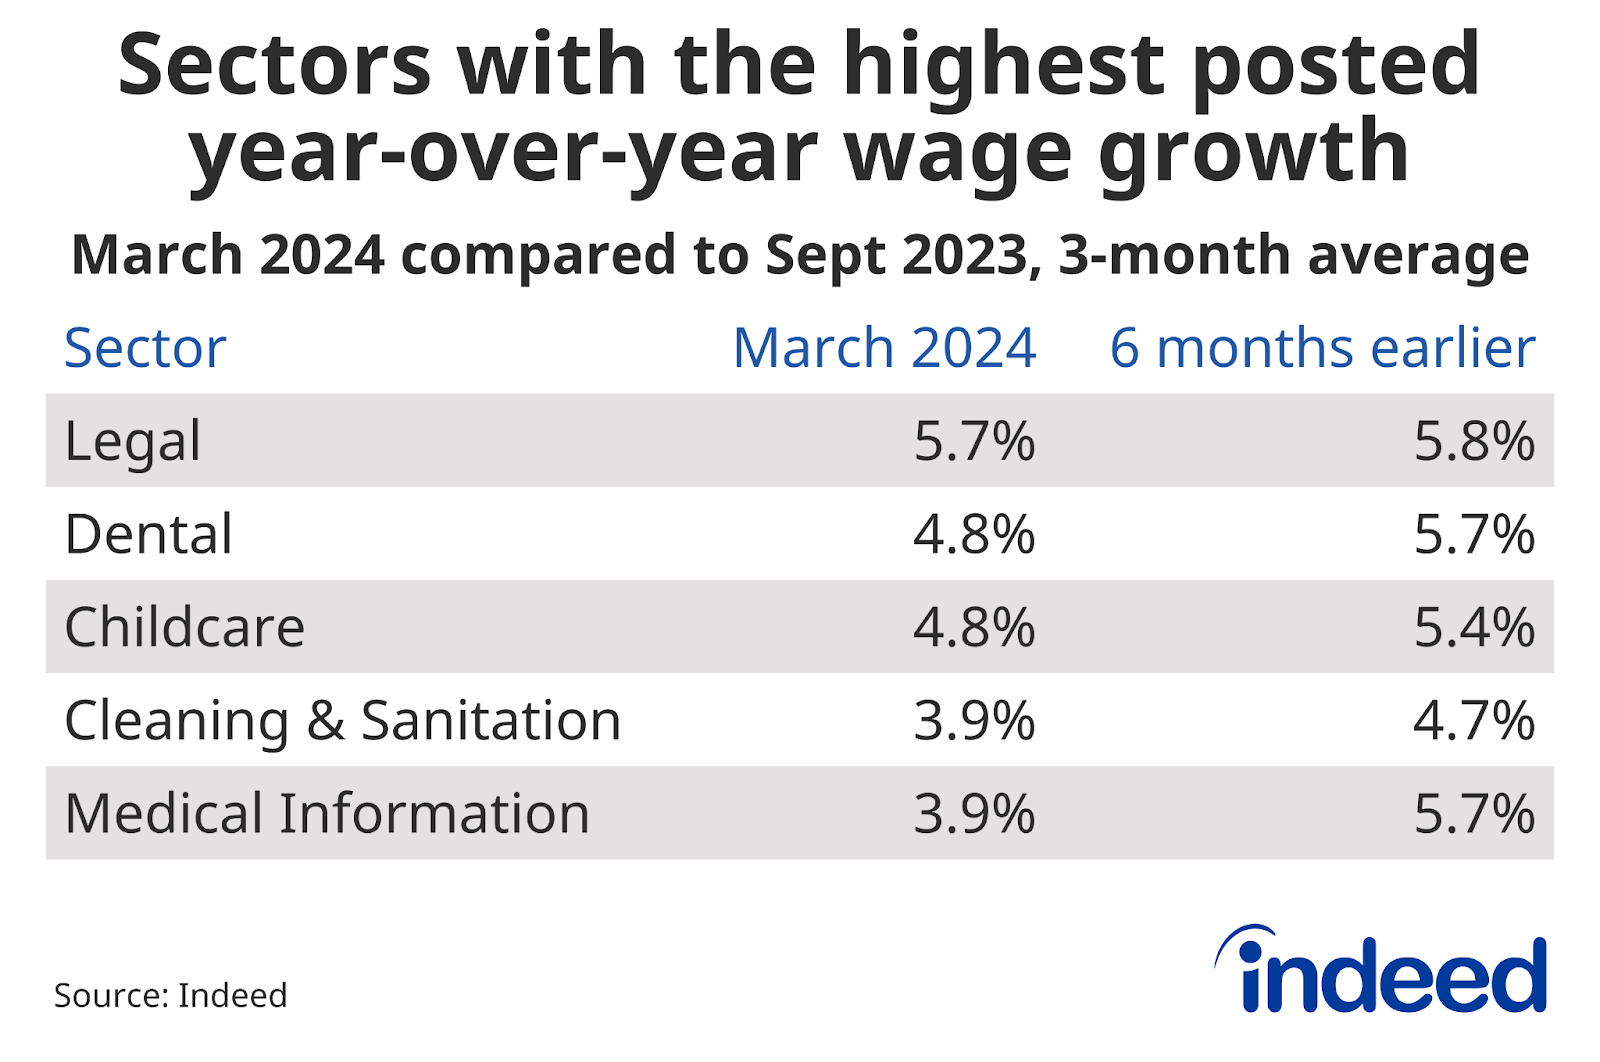
The legal sector, composed largely of attorneys, compliance officers, and legal assistants, had the highest year-over-year posted wage growth in March, at 5.7%, down just 0.1 percentage points from six months prior. Dental had the second-highest year-over-year growth in March, coming in at 4.8%, dropping 0.9 percentage points in the last six months. But while year-over-year wage growth in these sectors is currently the strongest observed among the dozens of sectors analyzed, growth in both has been relatively sedate throughout much of the post-pandemic wage boom — especially compared to a handful of sectors that were growing incredibly fast just a few years ago, but have since rapidly come back to earth.
Year-over-year wage growth in the food prep and service sector peaked at 15.4% in January 2022, the fastest post-pandemic peak pace recorded among sectors analyzed. But by March, year-over-year wage growth in that sector had slowed to just 2.4% — a decline of 13 percentage points from its peak. Other sectors with notable declines in the pace of wage growth over the past few years include retail (from 11.7% in February 2022 to 2.3% currently) and driving (from 11.4% in December 2021 to 2.7% currently). The data highlight the uneven nature of slowing wage growth, with some sectors continuing to chug along and slowing only modestly, while growth in others slows more dramatically.
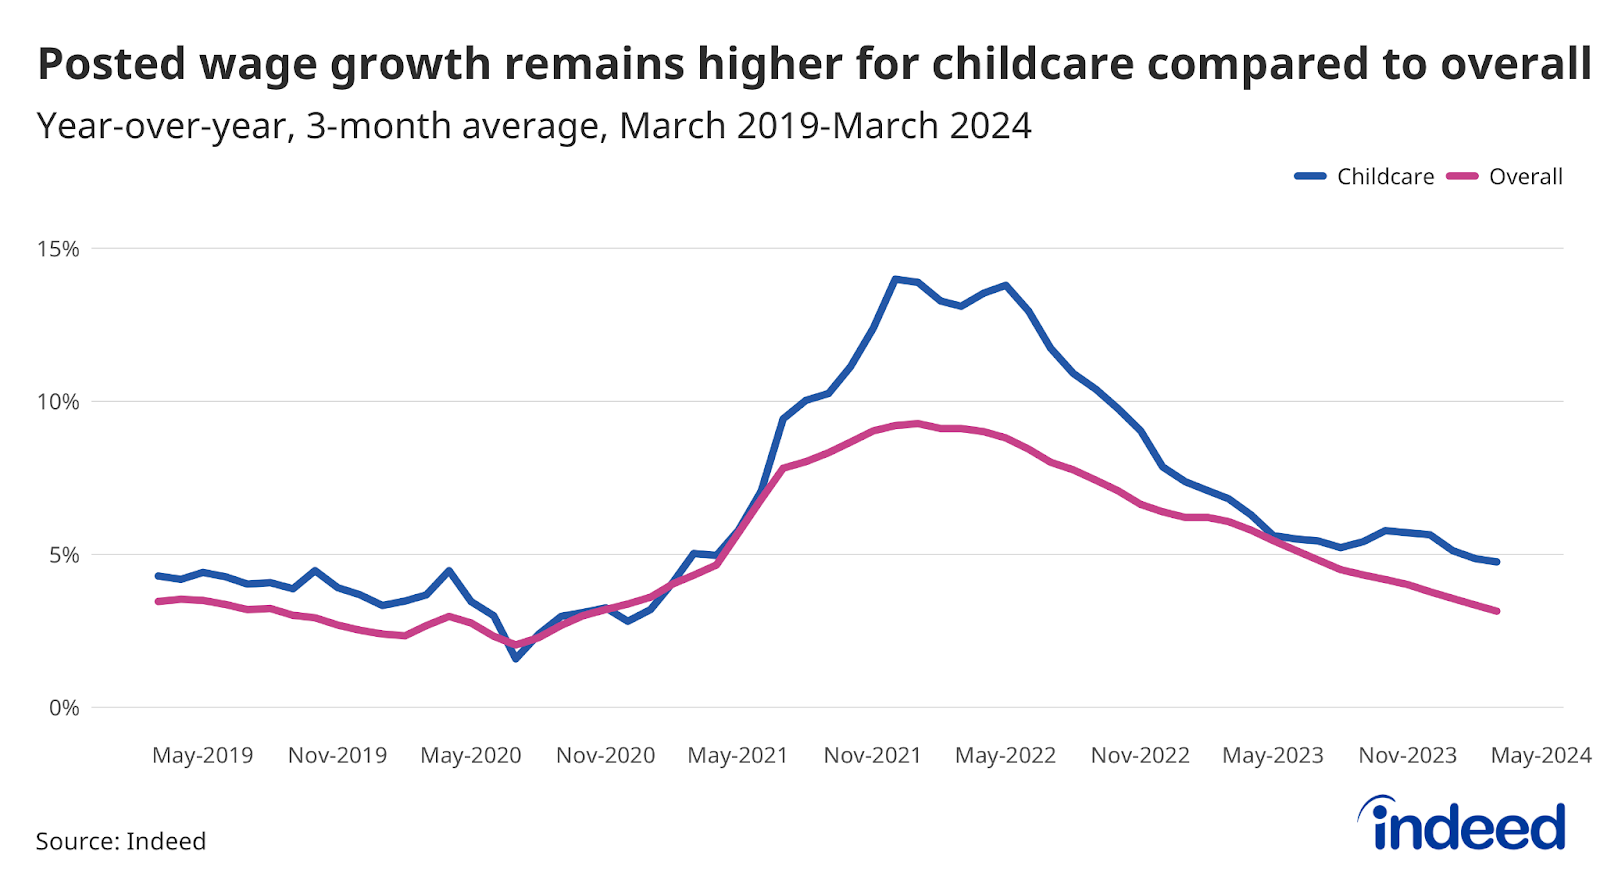
There is at least one notable sector in which wage growth has stayed strong and steady. Year-over-year posted wage growth in the childcare sector is currently third-strongest among sectors analyzed, at 4.8% in March. Additionally, after quickly recovering from what was essentially a shutdown in the early days of the pandemic, the childcare sector has held a spot on the list of the top five sectors with the highest average annual wage growth in every year since 2021. Interestingly, year-year wage growth in the childcare sector also recorded the second-highest peak rate among sectors analyzed, at 14% in December 2021. That it has fallen from a similar level as peak growth in food prep and service, but has stayed more stable at a higher rate more recently, may speak to changing employer demand across some sectors vs others.
Despite consistently above-average posted wage growth for childcare workers, employers are having trouble meeting demand for workers, with job postings for this sector up 45% from pre-pandemic levels as of early April. At a time when demand for workers overall is still pretty strong (total job postings were up 17.5% from pre-pandemic levels as of April 5), care options for families may be particularly top of mind for many workers.
Pandemic-era emergency funding helped bolster wages for childcare workers in hopes of keeping the industry afloat, and to free up more people to join the workforce to meet soaring demand. With these federal funds now expiring, many centers are worried they won’t be able to provide the wages needed to stay staffed. On the flip side, as wage growth slows more dramatically in sectors that typically offer similar pay to childcare (like food prep and service), and as childcare wage growth overall remains above the national average pace, more workers could be attracted to the childcare segment. This could help employers meet the still-high demand for child care, and also help build some resiliency to the segment as uncertainty rises around the expiration of key federal funding.
Methodology
To calculate the average rate of wage growth, we follow an approach similar to the Atlanta Fed US Wage Growth Tracker, but we track jobs, not individuals. We begin by calculating the median posted wage for a given country, month, job title, region, and salary type (hourly, monthly, or annual). Within each country, we then calculate year-on-year wage growth for each job title-region-salary type combination, generating a monthly distribution. Our monthly measure of wage growth for the country is the median of that distribution. Alternative methodologies, such as the regression-based approaches in Marinescu & Wolthoff (2020) and Haefke et al. (2013), produce similar trends.
More information about the data and methodology is available in a research paper by Pawel Adrjan and Reamonn Lydon, What Do Wages in Online Job Postings Tell Us about Wage Growth?, in Research in Labor Economics.