Key Points:
- Job postings containing pay information are less likely to advertise an exact salary or wage than they were a few years ago, with only 22% of postings mentioning precise pay in April 2023.
- Tech hubs and metro areas with new legislation requiring salary disclosure have seen the largest advertised salary ranges increases over the past year.
- Pay ranges are expanding most in higher-paying occupations like pharmacy and medical information, while lower-wage and in-person roles such as driving, childcare, and food preparation & service have tighter ranges than last year.
- Overall pay ranges aren’t widening dramatically because advertisements of narrower salary bands are offsetting postings with recently expanded ranges.
A majority of employers that offer some level of pay transparency in their job postings do so by publishing a proposed salary/wage range — ranges that vary widely by occupation, seniority, and geography, among other factors. An Indeed Hiring Lab analysis of published salary data found that job seekers looking for lower-wage and/or in-person jobs are getting more accurate information in job postings than they were a year ago (I.e., advertised salary ranges are narrower), while high-wage and/or remote workers are receiving less precise salary estimates.
In general, pay transparency can be an effective tool to help level the playing field between employers and employees, with distinct benefits for both. It can be a way for employers to build trust with their employees, and may potentially help close gender and racial pay gaps. Giving job seekers upfront access to pay information in postings can save time and energy in the application process, helping them weed out those jobs which cannot or will not offer them the pay they are seeking, and making for a cleaner matching process from the start.
As of April 2023, roughly 45% of US job postings overall included some salary information, up from less than 20% prior to the pandemic. But among those postings offering some level of pay transparency, only about 1-in-5 (22% as of April 2023) state an exact salary or wage (and just 10% of all job postings note an exact level of pay). The large majority of pay-transparent postings publish a pay range, which can be useful in helping set expectations for how flexible an employer is willing to be when evaluating job applicants with different levels of seniority or skill. However, it’s important to note that published ranges that are overly wide may risk diluting the utility of wage information from the start.
Analysis of US job postings on Indeed suggests that while typical measures of pay range width haven’t shifted much in response to rising transparency, there are pockets of the labor market where pay ranges are widening. But these expanding ranges are not moving the overall needle because they are being offset by narrowing in other areas.
Employer-provided salaries are getting more precise overall, but less so among only those jobs with salary information
In January 2021, prior to the adoption of pay transparency laws in Colorado and other states that broadly helped push overall transparency levels up, about 5.6% of all US job postings on Indeed noted a precise salary or wage. By April 2023, that share had nearly doubled to 10%, with wide differences among occupations. For example, more than half of postings in security & public safety and loading & stocking provided an exact salary last month, compared to only about 7% in software development and mechanical engineering.
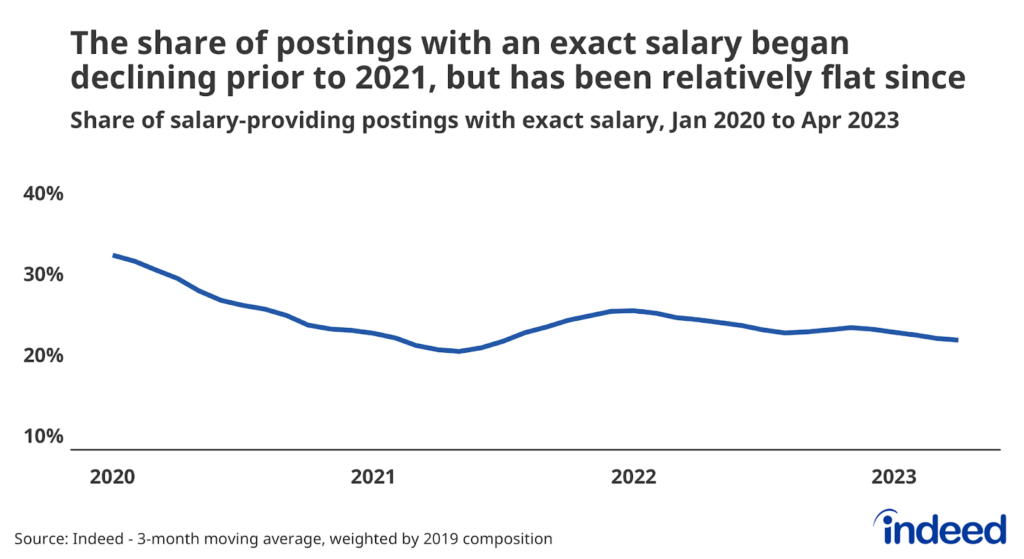
But when considering only jobs that include salary information, the share of postings providing an exact pay amount has been relatively flat since mid-2021. From April 2019 to April 2021, the proportion of salary-providing jobs advertising precise pay fell from 38% to 20%. Since then, the ratio has not moved much and now measures 22%. In other words, greater pay transparency levels are translating into a higher proportion of all jobs (including those without salary information) showing precise salaries, but less accuracy among postings with employer-provided salary information.
Typical pay ranges are largely stable, hiding larger movements at the extremes
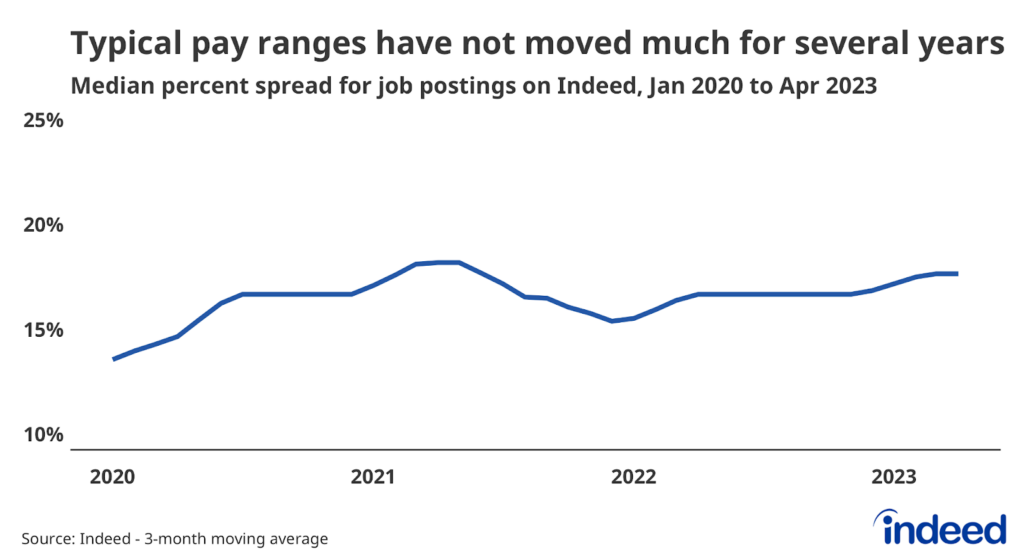
For job postings that provide salary information, the typical spread between the low end of the range and the high end is about 17%. In other words, if you had a job advertising a salary range starting at $50,000, the overall data would suggest that the top end is likely 1.17 times higher, or $58,500. Since 2020, the overall gap between the starting and ending values in salary ranges has widened only modestly, even after adjusting for changes in job mix, though most of that increase occurred prior to the rise in overall pay transparency.
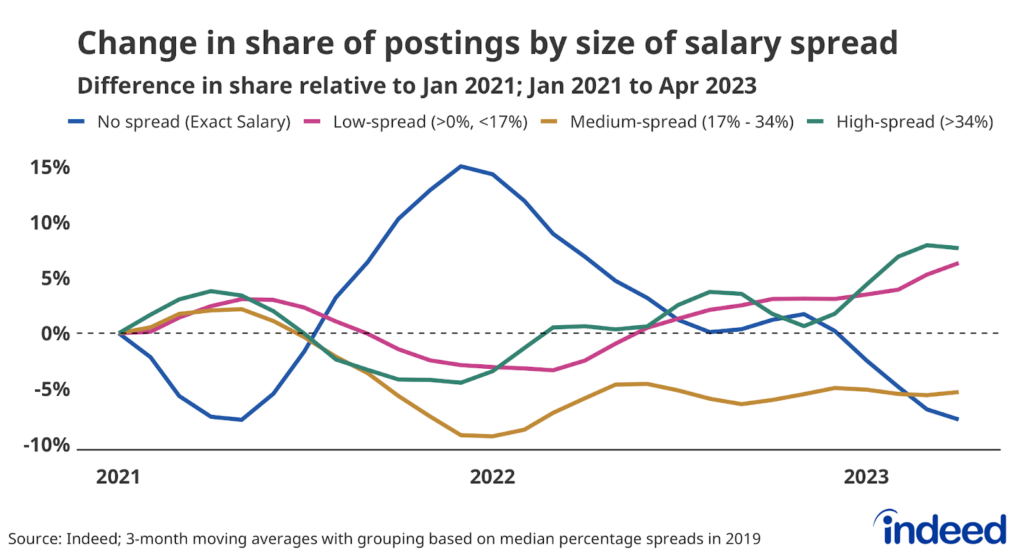
But measuring the typical spread doesn’t do a good job of capturing movements across the scale. There has been a lot of movement in the underlying data since Colorado’s pay transparency law took effect in 2021, despite little change in the overall number. Job postings advertising a medium-sized salary range — those with a top figure that is 17% to 34% above the bottom figure — have lost ground as pay ranges have shifted toward higher or lower spreads. The share of jobs with an exact salary has also moved a lot in the last few years, as employers have opted to publish pay ranges more frequently instead of providing an exact salary. In other words, while the overall spread may not have moved much, employers do seem to be mixing things up behind the scenes.
Salary ranges are widening in tech hubs and areas with transparency requirements
The size of a typically published salary range varies widely across metro areas. As of April 2023, the metro areas with the widest spreads included Lexington, KY (median range of 26%), San Jose, CA (25%), and Baton Rouge, LA (23%). Metro areas with the smallest typical spreads were Syracuse, NY (11%), Worcester, MA-CT (13%), and Buffalo, NY (13%). The presence of local salary transparency laws compelling employers to publish certain information is one possible driver for regional differences in typically published pay ranges.
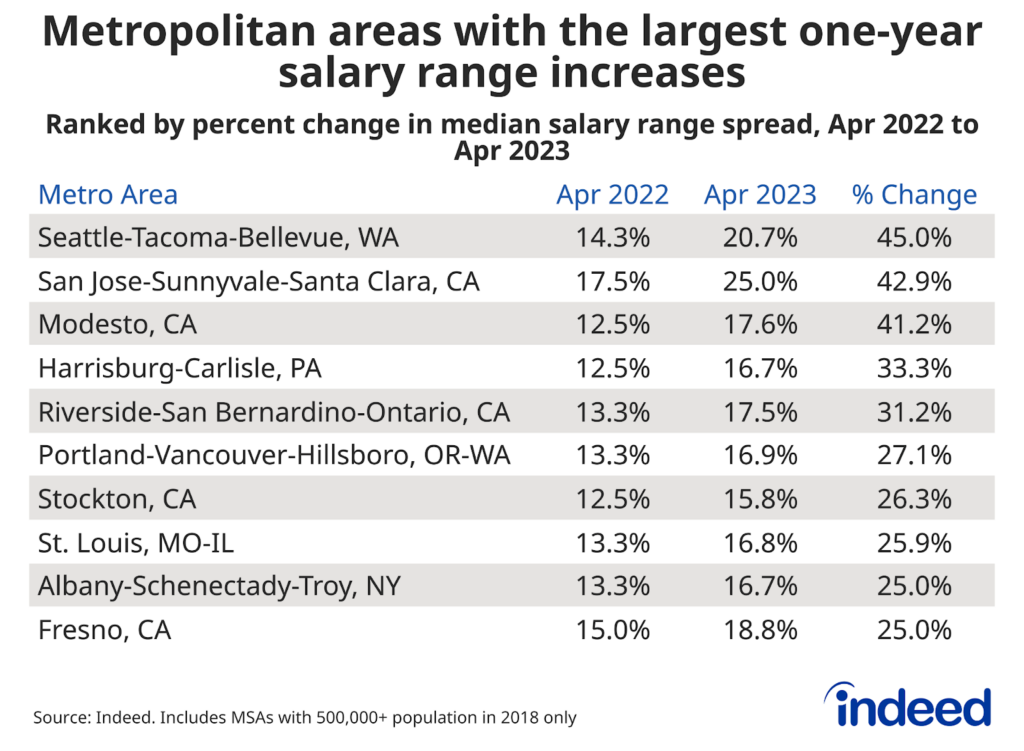
Salary ranges have widened considerably in some metropolitan areas over the last year, especially in areas with a large tech footprint and/or existing pay disclosure requirements. As of April 2023, seven of the 10 areas with the largest one-year increases in typical advertised salary ranges were in California or Washington — states where pay transparency requirements went into force at the beginning of 2023. The largest salary range increase occurred in the Seattle area, where the typically advertised pay range grew from 14% to 21% over the past year.
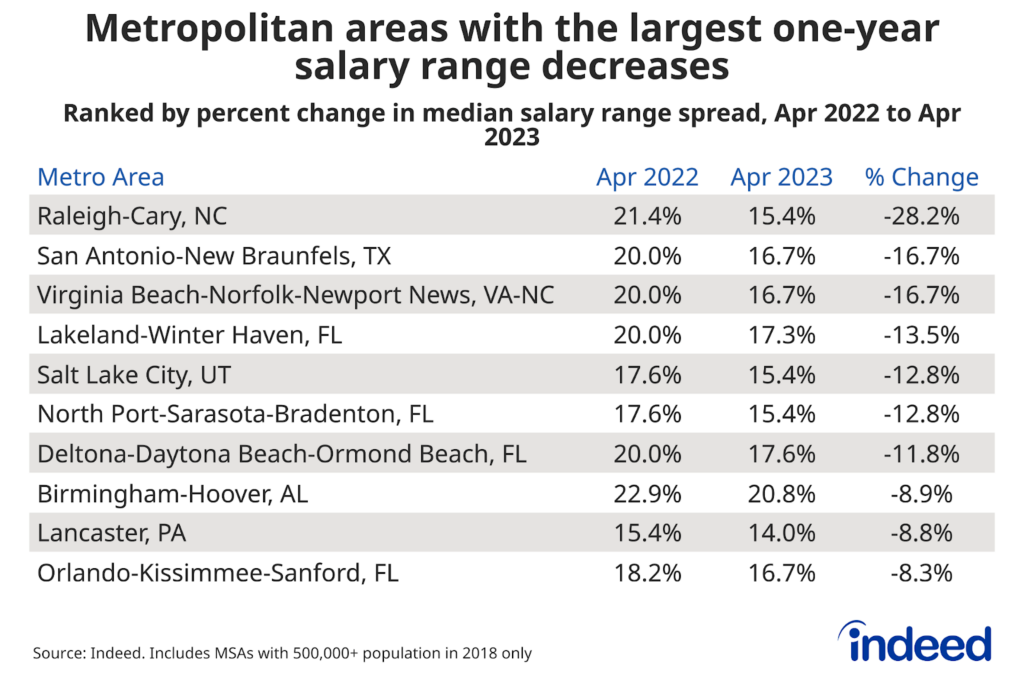
On the flip side, several metros saw their typical salary ranges tighten compared to last year. Of the top 10, eight were located in the South, where pay transparency levels tend to be lower than in other areas of the country. The most notable tightening occurred in Raleigh-Cary, North Carolina, where the standard advertised pay range shrunk from 21% to 15% from April 2022 to April 2023, respectively.
While new legislation surrounding pay requirements is a driver behind geographic shifts in salary ranges, it is also possible that continued strength in the labor market — especially in a few specific occupational sectors — is an additional contributing factor. In general, unemployment rates, one measure of labor market tightness, are higher in the top 10 metropolitan areas with expanding salary ranges, and lower in areas with narrowing pay bands. Over the last year, joblessness rates rose in half of the metro areas with widening salary ranges including large increases of at least one percentage point in Fresno, Modesto, and Stockton, California. In contrast, the unemployment rate rose in four of the top 10 metro areas, but only by a couple of tenths of a percentage point in most cases. This suggests that tight labor market conditions may be playing a role in some areas. Perhaps employers are using more narrow ranges to attract workers in geographies where fewer people are looking for work.
The jobs where salary ranges are widening and narrowing the most
Salary ranges can also vary by occupational sector. In April 2023, the sectors with the widest ranges were beauty & wellness, insurance, and software development, which posted typical ranges of 45.5%, 44.7%, and 35.3%, respectively. In contrast, the sectors with the narrowest spreads included security & public safety and loading & stocking, which publish exact salaries so often that their typical spread was zero. Beyond those, occupations in fields like driving (5.8% typical pay spread), cleaning & sanitation (5.9%), and hospitality & tourism (7.7%) had relatively low spreads. In general, job postings for low-wage jobs tend to have more narrow spreads than those at a higher salary level.
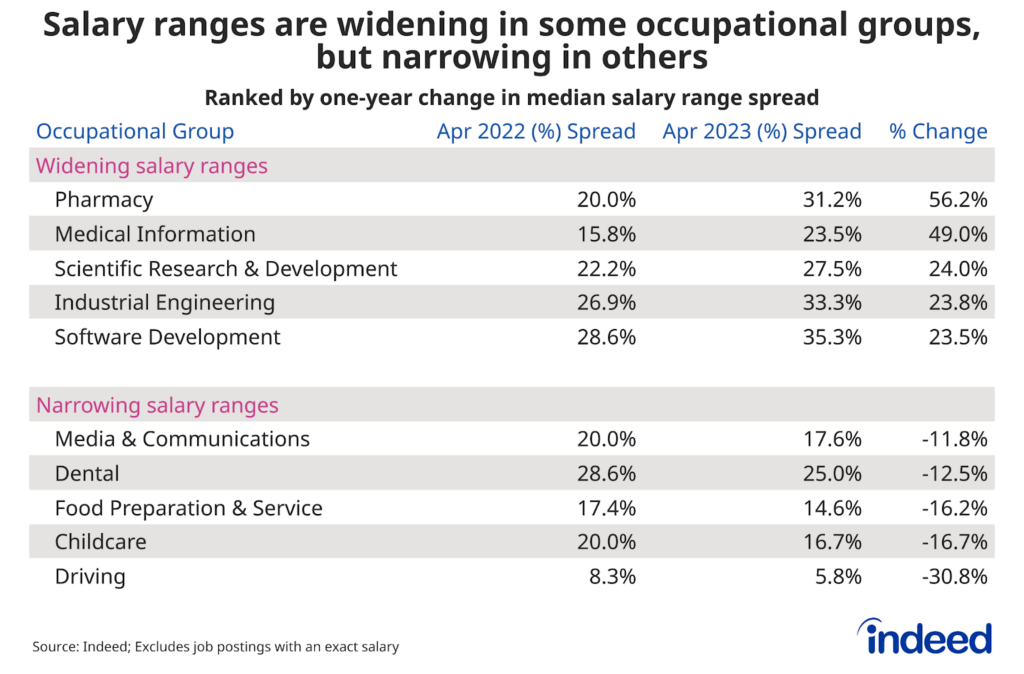
Pay ranges have widened most in fields like pharmacy and medical information, where published salary ranges have expanded by 56% and 49% in the last year, respectively. On the other hand, the size of pay ranges for job postings in the driving (-31%), childcare (-17%), food preparation and service (-16%), and dental (-13%) fields have narrowed the most in the previous year. In general, salary ranges appear to be widening most for remote and high-paying positions with historically low pay transparency, and narrowing most among in-person and low-wage jobs. Having a more precise pay range is beneficial to job seekers because it provides them with better information about the expected salary for a position up-front, and right now it looks like those searching for low-wage and in-person jobs are benefiting most.
But while this greater degree of accuracy can help job seekers in their search, it might not matter much in the end if the offered salary is below a level the worker would be willing to accept. According to recent survey data from the New York Federal Reserve, the minimum salary that workers are willing to accept on average continues to rise, climbing to a series high of nearly $76,000 in March 2023. This is an average, so there are many workers willing to take less, but the important thing here is the direction: Job seekers’ salary expectations and requirements when taking a new job are increasing. Similarly, over the last year, relative job seeker interest on Indeed has shifted toward higher-paying occupational sectors where remote work is more likely and where salary ranges are widening most.
Conclusion
For employers trying to attract the right workers, providing clearer salary information may be a great way to set themselves apart. Recent Hiring Lab research found that occupations including dental and childcare have been including salary and benefit information in postings more frequently, potentially as a way to differentiate themselves and attract workers in a tight labor market.
Taking top-level salary range data at face value conceals changes occurring in salary ranges advertised in US job postings. Tech hubs and areas with recently implemented salary requirements are already starting to see some movement toward higher salary spreads, which is being offset by tighter salary bands in other areas. A similar offsetting effect is also noticeable across various roles, with advertised wage ranges widening among remote and high-wage roles and narrowing for in-person opportunities.
Methodology
Salary ranges are measured by first calculating the percent difference between the lowest and highest wage mentioned in a job posting and then a median is performed to aggregate the data. Pay information is extracted from postings on Indeed. Salaries advertised as being paid daily or weekly are omitted from the analysis. Additionally, salaries with a scaled lower-bound value below $7.25 an hour are removed (including those advertising a salary “up to” an amount where the bottom value is zero). Salary spread groupings are based on the composition of job postings in 2019. Postings with an exact salary were included in their own group, while other groups were derived by splitting the remaining data into three roughly-equal groups based on the number of job postings in each.
Metropolitan area (MSA) data includes only those locations with a population of 500,000 or greater in 2018. MSA data is presented as an unweighted share and may be subject to shifts in occupational composition. We consider an MSA fully covered under the law if it falls into a state or city with an active regulation. Additionally, we consider an MSA covered if it overlaps state lines and falls in a state with pay transparency laws.