
Key Points:
- The share of job seekers who feel optimistic about their ability to find work remains high, but employed seekers are showing signs of weakening confidence, according to the latest data from the Indeed Job Search Survey.
- Despite headwinds including inflation and tight monetary policy, employment overall continues to grow at a brisk pace. Demand for workers remains elevated and joblessness is low, leading to strong nominal wage growth for workers.
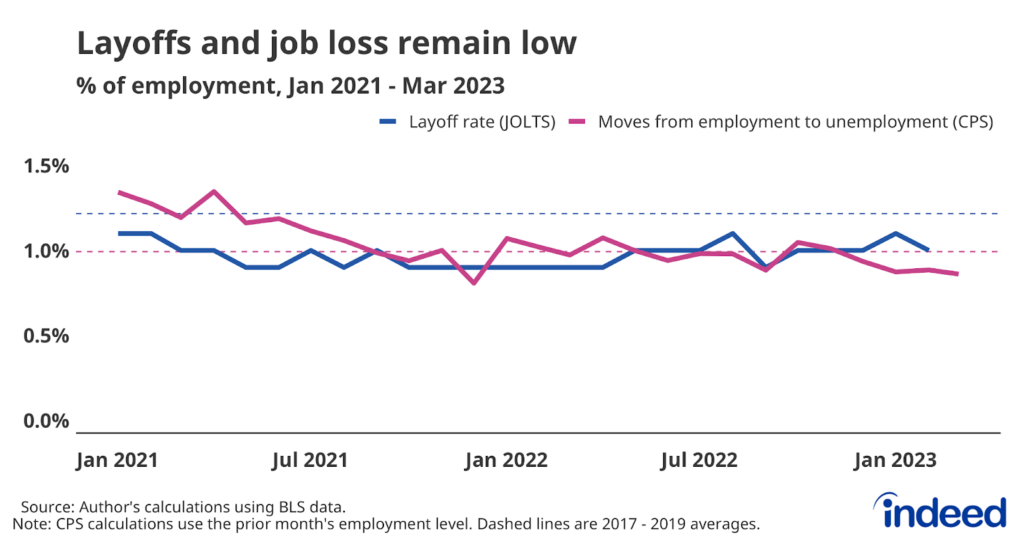
- Announced layoffs in the tech and media industries are grabbing headlines, but layoffs overall remain low. Total monthly layoffs are about 16% below their pre-pandemic average.
- While job postings remain elevated, they are moderating, with both total postings down and new postings down from a month prior as of April 21, 2023.
- While nominal wage gains remain strong, it has started to soften. However, the extent of the descent toward pre-pandemic growth rates is unclear.
The US labor market continues to find balance after years of volatility, with key measures of job postings, wage growth, and labor participation moving towards sustainable levels as the overall economy cools. And while layoffs remain low and opportunities still abound for workers, the burst of jobswitching that characterized the past few years may be fading as more workers lose faith in their ability to easily find a new job if they were to leave their current role.
Spotlight: Job seekers remain confident in the labor market, but some unease is starting to appear
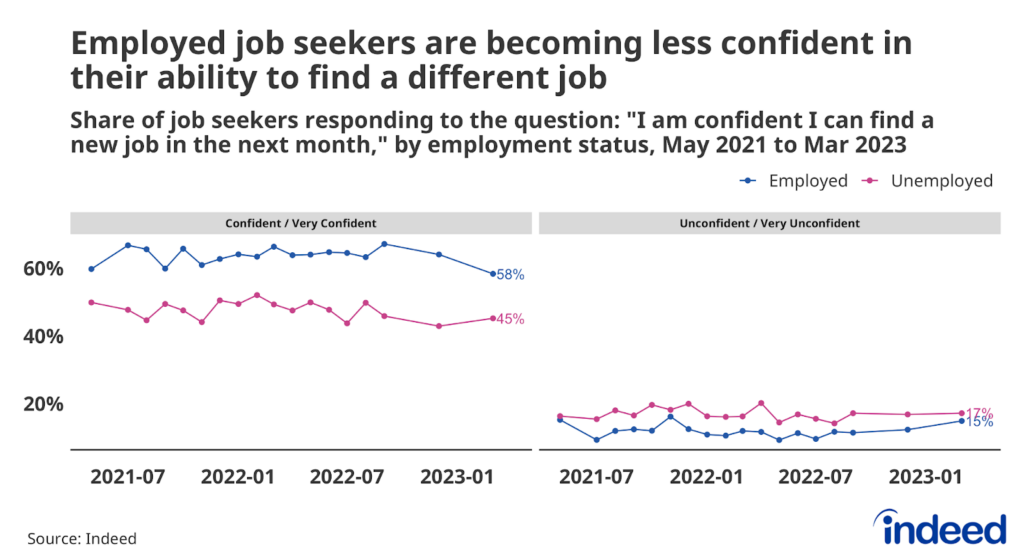
New data from Indeed’s Job Search Survey suggest that a majority of job seekers are confident in their ability to find a job in the next month. But that confidence appears to be fading, especially for those who are currently employed. Over the past three months, the overall share of job seekers expressing confidence in their search fell from 57% to 54%, with the share of employed job seekers expressing confidence falling from 64% to 58% over the same period. Employed job seekers do remain more confident than those who aren’t currently working, but the gap between the two has narrowed considerably in recent months.
Much of the pullback in employed job seeker confidence has occurred among workers with the highest levels of educational attainment. At the end of 2022, some 73% of graduate degree holders and 66% of those with bachelor’s degrees expressed confidence in their ability to find a new job in the coming month. However, by the end of March 2023, those figures had fallen to 64% and 57%, respectively. In contrast, confidence levels among employed job seekers with a high school degree, or only some college but no degree, remained unchanged.
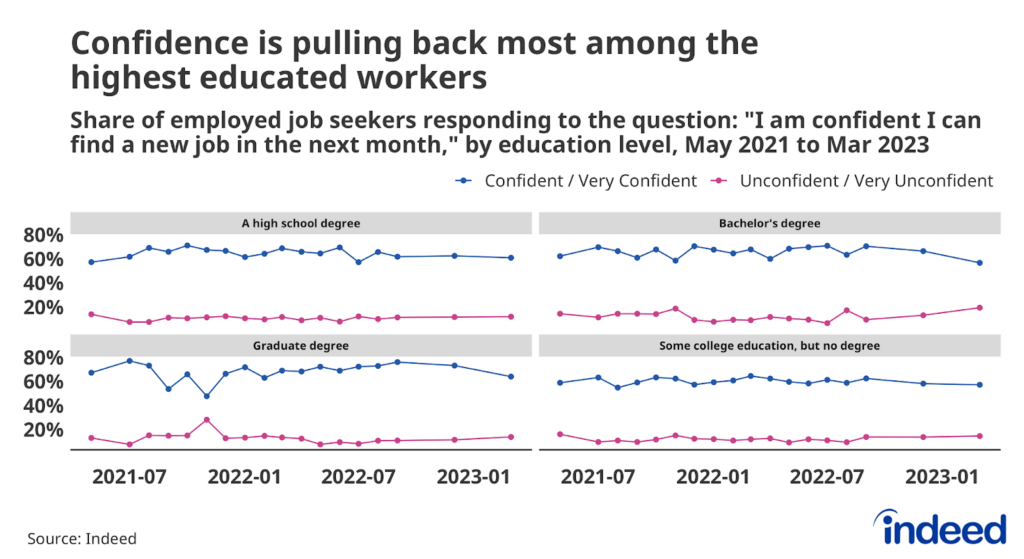
The most likely driver of this declining confidence is a slowdown in job postings in occupations that typically employ highly-educated workers. Postings in these sectors have been slowing for more than a year, and are below pre-pandemic levels in several areas, including mathematics, software development, and marketing. Given this decline in job postings, it stands to reason that workers in these fields would feel less optimistic about their prospects.
Beyond the decline in job postings, it is also possible that some loss of confidence is related to headline-making layoff announcements for white-collar positions. Although these layoffs only account for a small fraction of total U.S. employment and have not translated into significant movements in the layoff rate at large, the reports may be enough to create unease about the future for job seekers.
Labor Market Overview
The US labor market remains strong. Overall employment continues to grow at a brisk pace and joblessness is low despite still-high inflation, large and rapid rises in key benchmark interest rates, and slowing economic growth. Job postings on Indeed have declined for most of this year, down 14.3% as of April 21 compared to the same period a year ago. Wage growth has cooled recently and some sectors — notably tech and media —are laying off workers at elevated rates. But wage growth is still high by historical standards, as demand to hire new workers is elevated and layoffs remain low. In short, the labor market is resilient. However, this resilience may waver if economic growth stumbles in the face of ongoing tight monetary policy and stress in the US banking system.
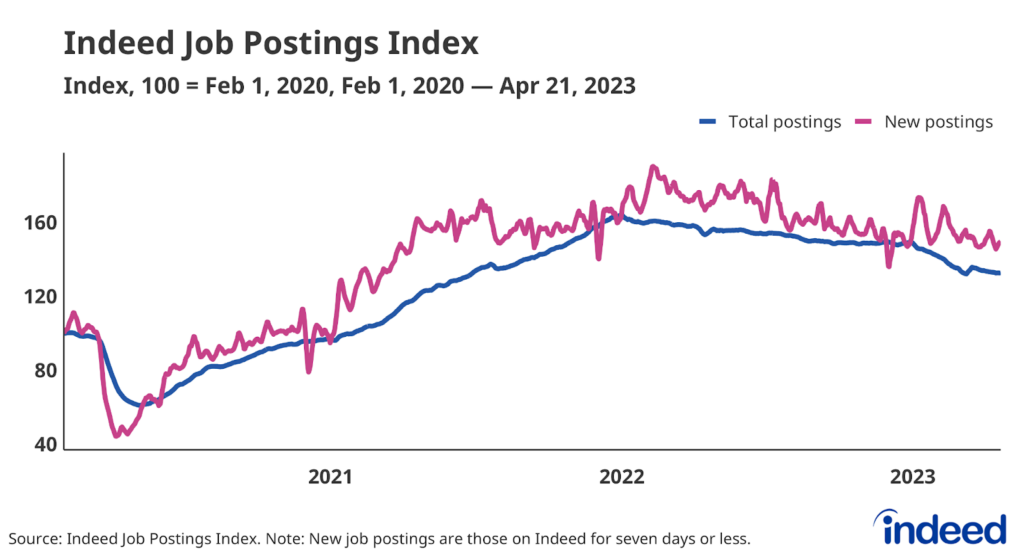
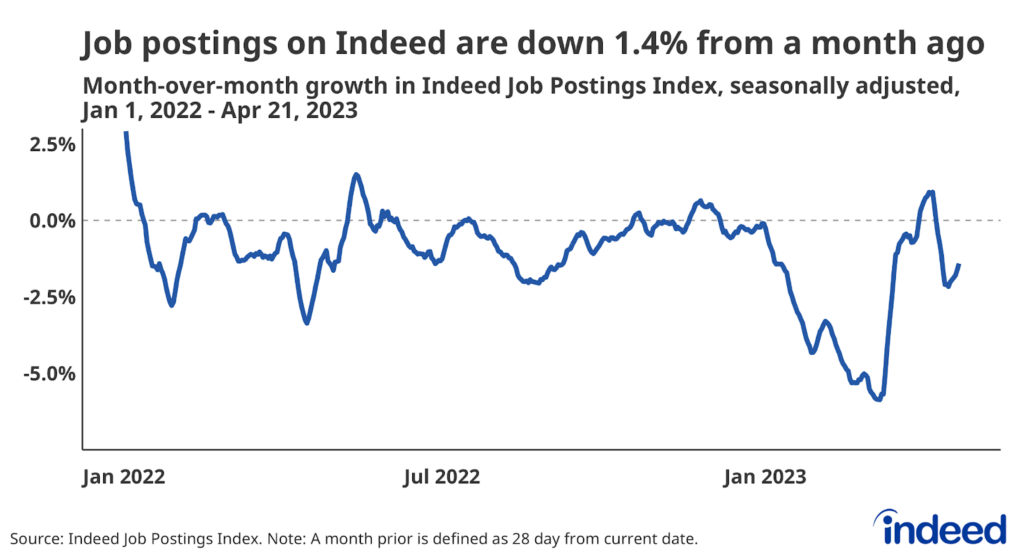
Employer demand for workers remains strong, even if it is fading. Despite falling from their March 2022 peak, there were still more open jobs nationwide at the end of February than there were unemployed workers. Indeed’s more timely Job Postings Index indicates that employers’ hiring appetites have faded so far in 2023. Total job postings rose sharply in mid-March but began falling again more recently, and as of April 21 were down 1.4% from a month prior. New postings, defined as those on Indeed for seven days or less, were up slightly over the past month. However, this series is volatile and has been declining for much of 2023.
People have returned to work
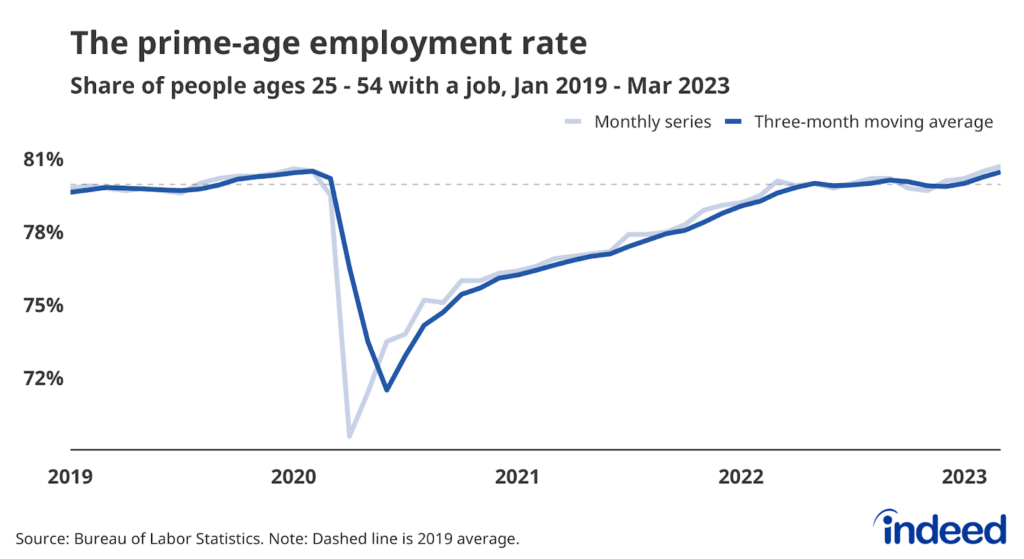
Strong demand has led to robust hiring and more workers finding jobs. The employment-to-population ratio for workers ages 25 to 54, a good measure of the health of the labor market, stood at 80.7% in March. In other words, more than 80% of people in this age group had a job in March; above pre-pandemic levels but still below the ratio average of 81.5% in 2000.
Still, the employment rate for all working-age adults was just 60.4% in February, less than the pre-pandemic rate of 61.1%, largely attributable to an aging population. Many people continue to “unretire,” but the recent decline in this trend, a rise in workers entering retirement, and the continued aging of the population, suggest we shouldn’t expect older Americans to be a significant source of employment moving forward.
Quitting is still elevated, as layoffs remain low
While cooling somewhat last year to a rate of 2.6% as of this February, the job quitting rate is still above the 2019 average of 2.3% as employed workers continue to find new work at elevated rates. And while quitting overall may be cooling, the decline in quitting in high-churn sectors, especially retail trade and leisure and hospitality, has petered out. Workers quitting their old jobs and finding new ones is typically a major driver of overall wage gains, and continued elevated rates of quitting in these sectors would support continued wage growth.
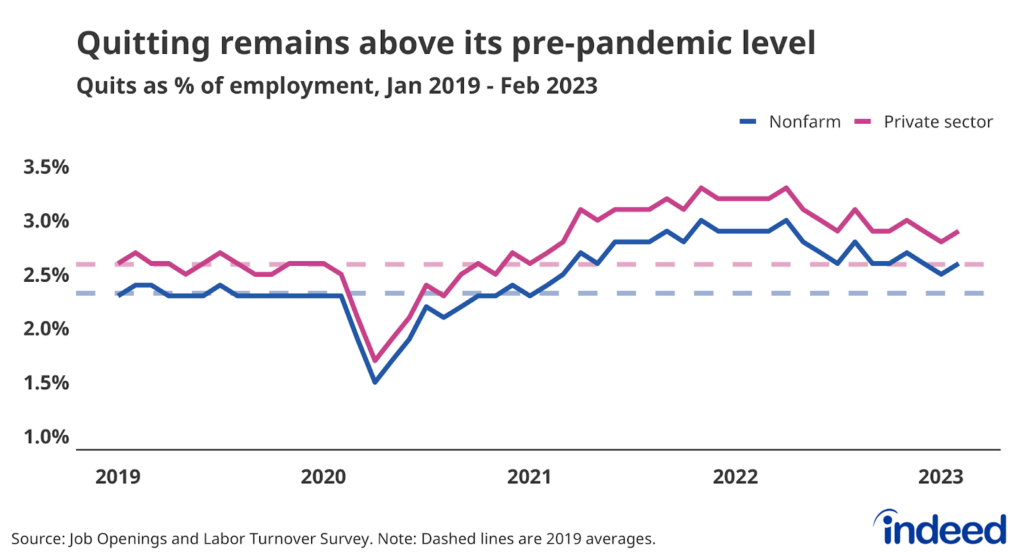
And while workers are voluntarily leaving their jobs at higher rates than during pre-pandemic days, employers are also reluctant to lay them off. The recent wave of announced layoffs in the tech and media industries signals a painful recalibration in those sectors, but what’s happening in those areas isn’t necessarily reflective of the overall labor market. Technology companies, for example, have a much bigger footprint in stock indexes than they do in the labor market, in which they employ less than 2% of workers nationwide. Layoffs overall remain at a very low level, averaging about 1.6 million a month from December 2022 through February 2023. They would need to rise about 16% in order to return to their 2017-2019 monthly average of 1.8 million.
Wage growth remains strong
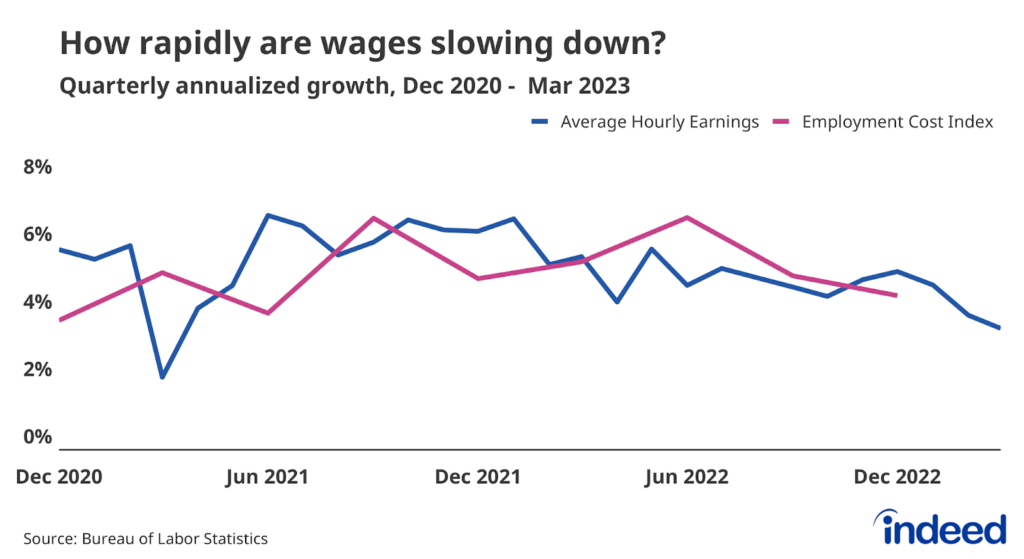
Strong competition for new hires across multiple sectors pushed annual wage growth up between 5% and 6% for much of the past few years, a faster growth rate than at any point over the past 20 years. But these data are measuring so-called nominal wage growth — pay gains measured before taking inflation into account. When inflation rises at a faster rate than nominal wage growth, as it currently is, rising prices eat away at those gains and cause many employees to lose ground when it comes to actual purchasing power.
Several measures of wage growth show that growth has started to slow down, even if the exact rate of this deceleration is unclear. The widely-cited Average Hourly Earnings data from the US Bureau of Labor Statistics indicate wage growth has dropped back to immediate pre-pandemic levels. However, those data can be misleading due to the shifting composition of employment. The Bureau of Labor Statistics will release numbers for the first quarter from the more reliable Employment Cost Index later this week, providing a clearer picture of the state of wage growth.
The US labor market has plenty of opportunities for workers, while also presenting challenges to employers. However, the current situation will surely change. We will continue to monitor these trends and track others as the labor market evolves.
Methodology
Data on seasonally adjusted Indeed job postings are an index of the number of seasonally adjusted job postings on a given day, using a seven-day trailing average. February 1, 2020, is our pre-pandemic baseline, so the index is set to 100 on that day. We seasonally adjust each series based on historical patterns in 2017, 2018, and 2019. We adopted this methodology in January 2021. Data for several dates in 2021 and 2022 are missing and were interpolated. Non-seasonally adjusted data are calculated in a similar manner except that the data are not adjusted to historical patterns.
The number of job postings on Indeed.com, whether related to paid or unpaid job solicitations, is not indicative of potential revenue or earnings of Indeed, which comprises a significant percentage of the HR Technology segment of its parent company, Recruit Holdings Co., Ltd. Job posting numbers are provided for information purposes only and should not be viewed as an indicator of performance of Indeed or Recruit. Please refer to the Recruit Holdings investor relations website and regulatory filings in Japan for more detailed information on revenue generation by Recruit’s HR Technology segment.
The Job Search Survey is a quarterly online survey of 15,000 US adults ages 18-64. The survey was monthly from June 2021 to September 2022 and surveyed 5,000 respondents each month. We made the shift to a quarterly survey starting in December 2022. Weights were applied to each survey to match respondent distributions across age, educational attainment, race/ethnicity, and sex with the 2020 Current Population Survey’s Annual Social and Economic Supplement. Observed differences in surveyed confidence percentages were tested for significance using a series of two sample z-tests for proportions. The decline in confidence among employed job seekers – and decline for graduate and bachelor’s holding respondents – were significant at a 95% confidence level.