Key Points:
- The latest data from the Indeed Wage Tracker shows that US posted wages grew 6.3% year-over-year in December 2022, up from 3% in December 2019.
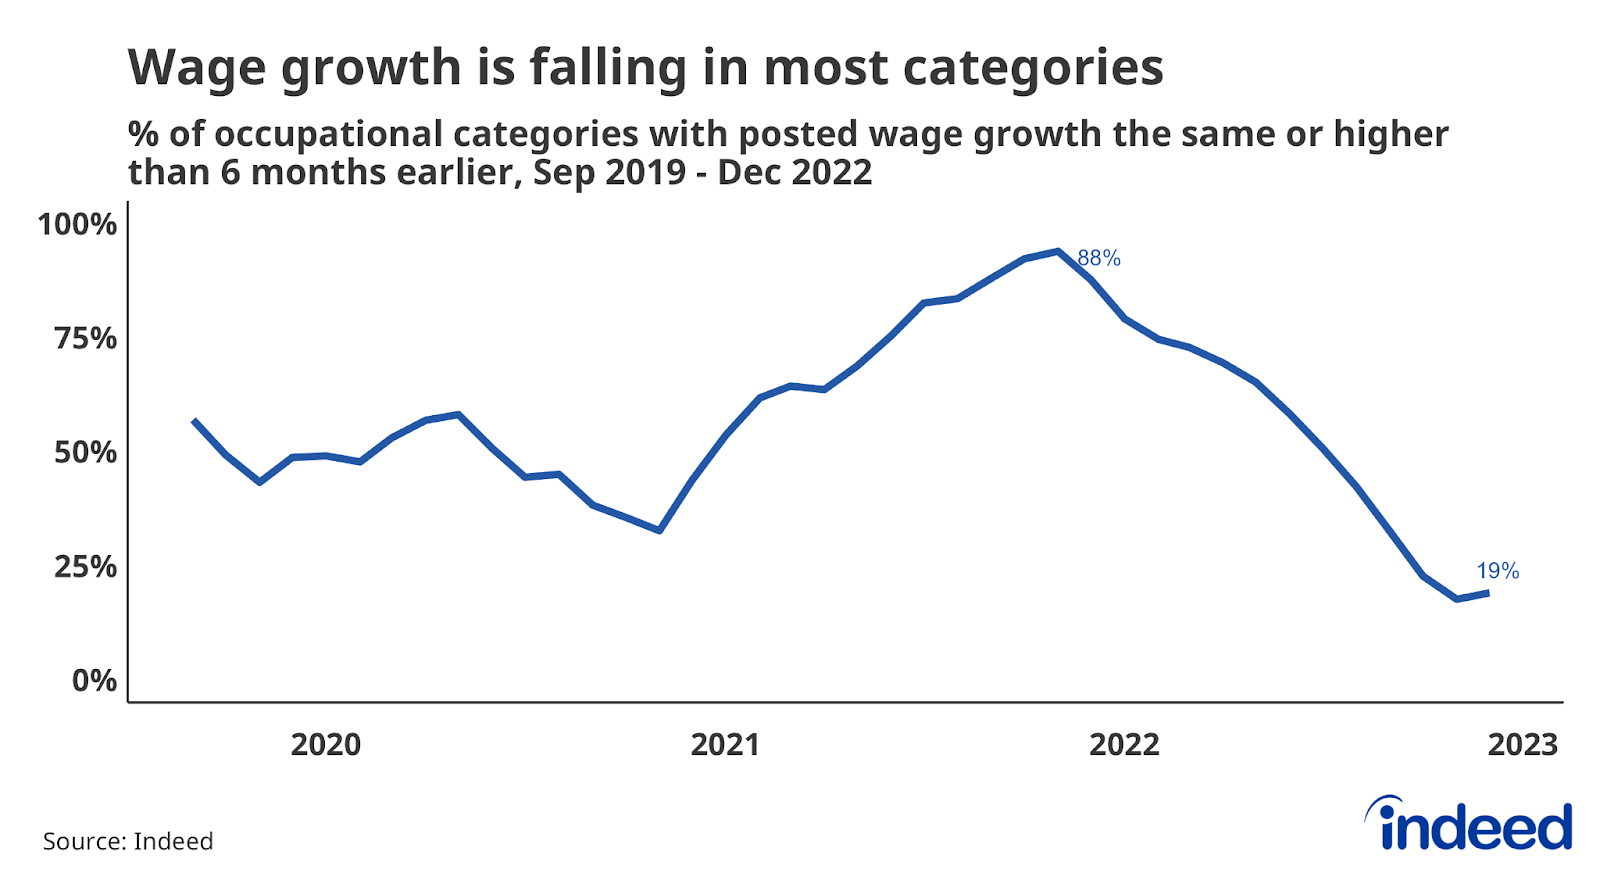
- While wages are still growing quickly year-over-year, they nevertheless continue to decelerate from previous heights, as posted wage growth declined for the ninth straight month. The deceleration continues to be broad-based, with wages advertised in job postings wages slowing in over 80% of all occupational categories.
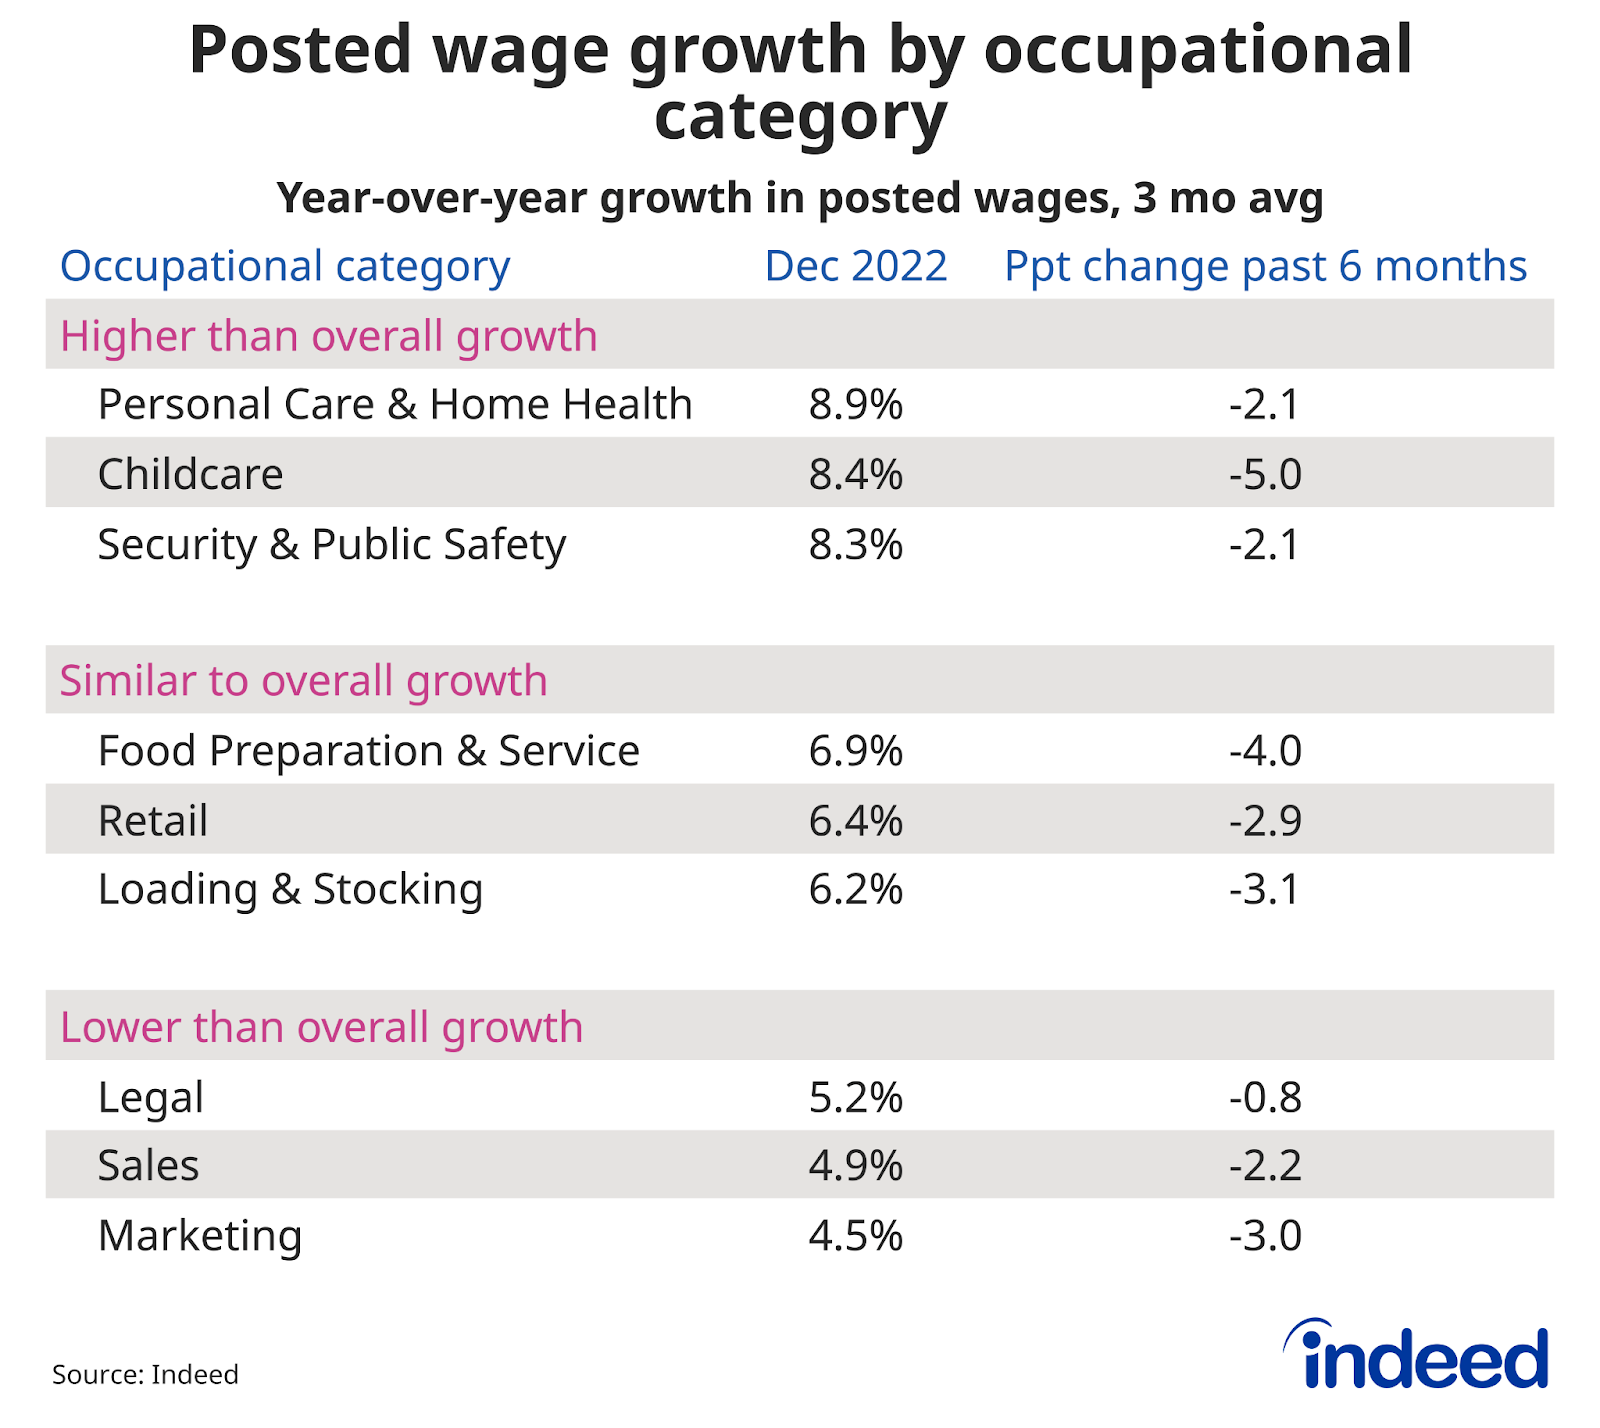
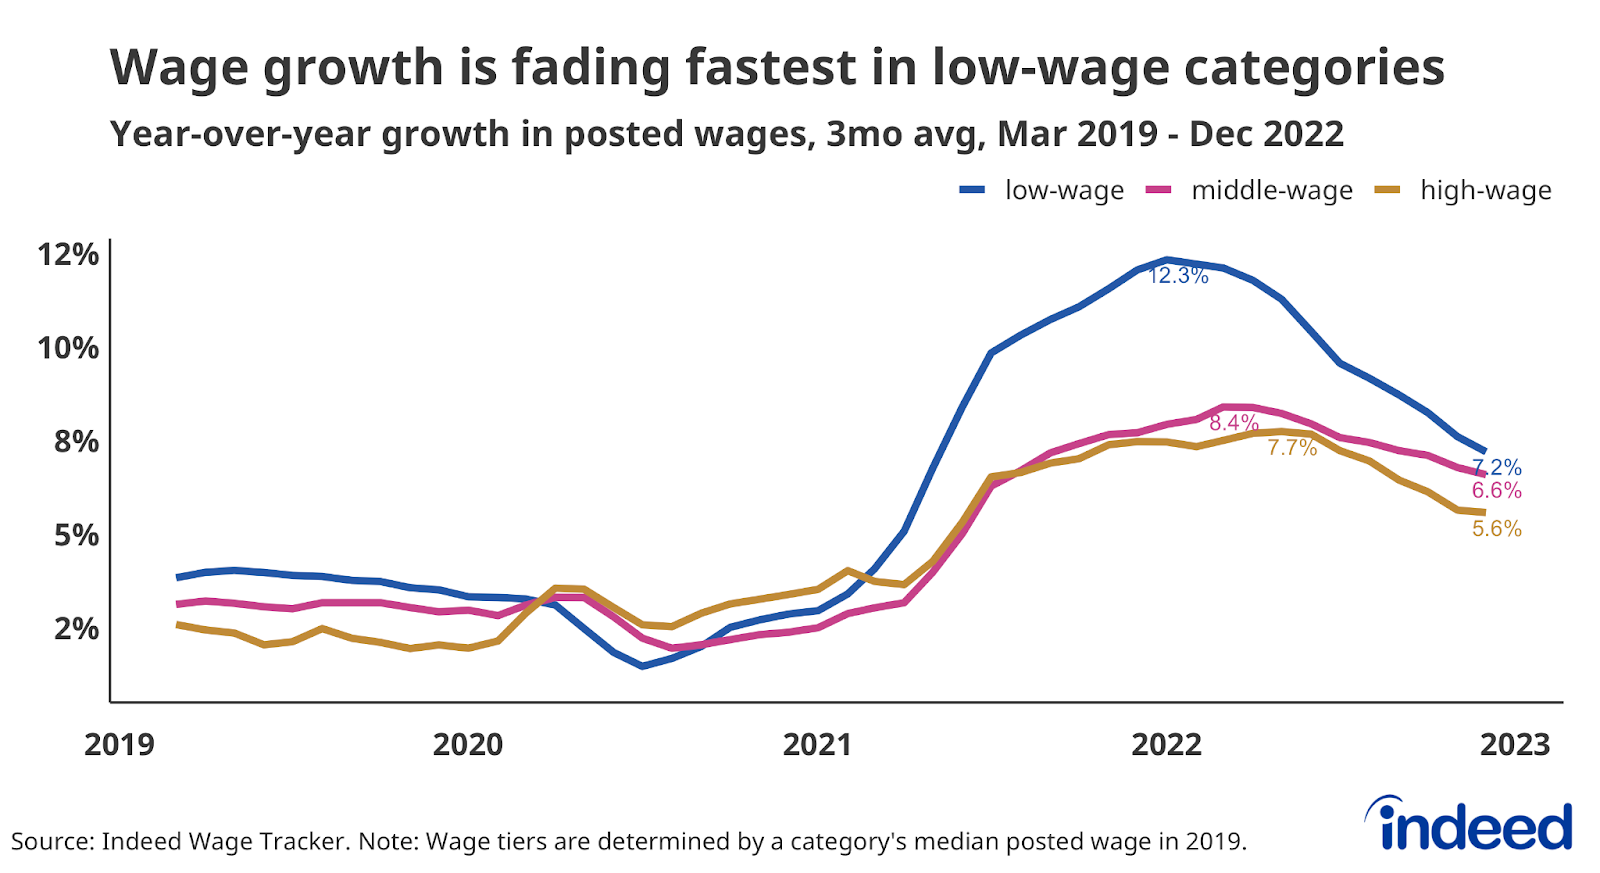
- Low-wage sectors such as Childcare and Food Preparation continue to see the largest declines in posted wage growth, with average growth declining 5 percentage points since January 2022.
The latest data from the Indeed Wage Tracker shows that wages and salaries advertised in Indeed job postings continue to grow quickly, but the slowdown that started last spring continues. Posted wages grew 6.3% year-over-year in December 2022, a pace more than twice December 2019’s measurement of 3%. Gains in posted wages remain strong but continued to decline coming in below November’s 6.5% rate, and substantially below March 2022’s 9% pace.
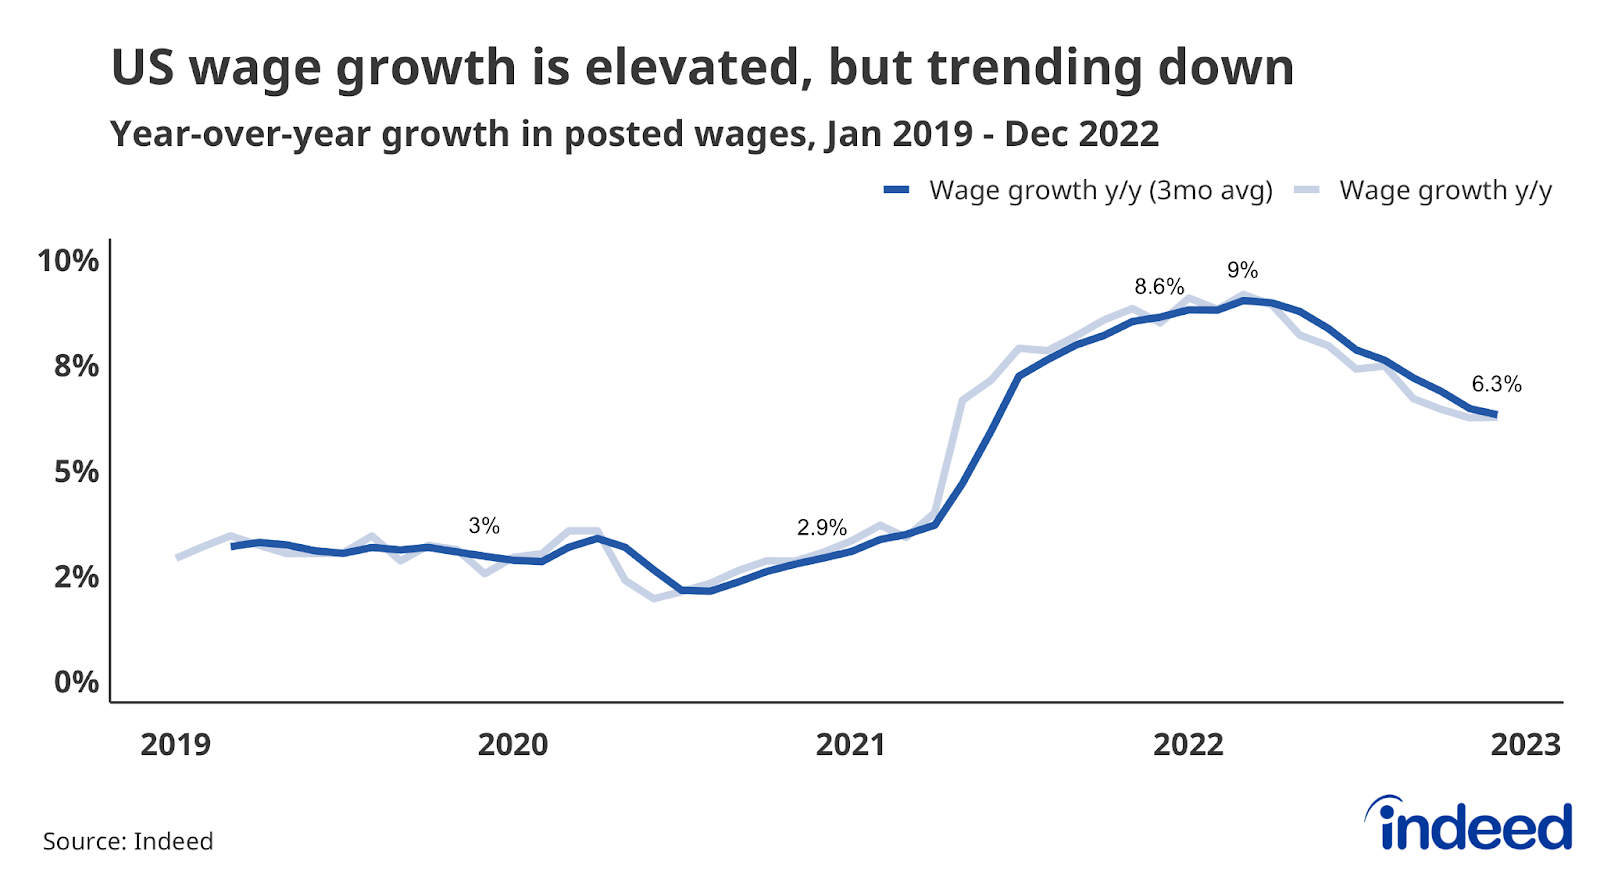
An important note: the unsmoothed growth rate for December of 6.3% was the same as the raw number for November. This result raises the possibility that posted wage growth may, in fact, be leveling off. However, we’ll need to see more data before we can determine that a new trend has started.
Whether or not the deceleration continues, it remains extensive. Fewer than one in five occupational categories had faster posted wage growth in December than six months prior. That represents a tremendous decline from December 2021, when advertised wages were accelerating in almost nine out of every 10 categories.
Wage growth varied considerably across occupational categories in December, ranging from 8.9% for Personal Care & Home Health jobs to 4.5% for Marketing roles. But even the categories with relatively low growth last month are still seeing gains above their pre-pandemic level. For example, posted wage growth for Legal jobs last month was more than double its average growth rate of 2.6% in 2019.
Lower-wage sectors continue to show a sharper wage growth decline than other sectors. Overall posted wage growth declined by 0.2 percentage points from November to December, but fell by 0.4 for lower-wage categories. Compare that to a 0.2 point decline for middle-wage categories and a flatlining for the high-wage group.
One of the big questions for the US labor market is how much will wage growth decrease this year. The Indeed Wage Tracker shows posted wages and salaries were slowing at the end of 2022, but the outlook for 2023 is still unclear. We will continue to highlight these trends in more depth in our monthly updates of this data.
Methodology
To calculate the average rate of wage growth, we follow an approach similar to the Atlanta Fed US Wage Growth Tracker, but we track jobs, not individuals. We begin by calculating the median posted wage for a given country, month, job title, region and salary type (hourly, monthly or annual). Within each country, we then calculate year-on-year wage growth for each job title-region-salary type combination, generating a monthly distribution. Our monthly measure of wage growth for the country is the median of that distribution. Alternative methodologies, such as the regression-based approaches in Marinescu & Wolthoff (2020) and Haefke et al. (2013),produce similar trends.
More information about the data and methodology is available in a research paper by Pawel Adrjan and Reamonn Lydon, Wage growth in Europe: evidence from job ads, published in the Central Bank of Ireland’s Economic Letter series.
The wage tiers of occupational categories are determined by ranking categories by the median wage advertised in the sector in 2019. The categories are then split into three tiers so each tier contains categories that covered one-third of job postings on Indeed on an average day in 2019. The average posted wage growth for each tier is a weighted mean of each category in the tier in which the weight is the number of salary or wage observations in the category that month.