
Key Points:
- When thinking about the outlook for wages and compensation, keep an eye on wage growth for job switchers, wage-related queries from job seekers, and benefit advertisements in low-wage sectors.
- The US labor market remains strong with elevated demand for workers and relatively low levels of joblessness, leading to strong nominal wage gains for workers.
- Layoffs in the tech sector are grabbing headlines, but layoffs are still low. Total monthly layoffs would have to rise by about 29% to return to their pre-pandemic average.
- Job postings on Indeed were 48.7% above their pre-pandemic baseline as of November 18, signaling vigorous hiring intentions. New job postings, those that have been on Indeed for seven days or less, also reflect a healthy appetite for new hires, coming in at 51.2% above their Feb 1, 2020 level.
- Nominal wage gains remain strong, but growth has started to level off recently. However, any descent toward pre-pandemic levels may take some time.
Spotlight: Three Graphs to Track When Thinking about Wages and Compensation
In an era of high inflation and vigorous competition for new hires, whether or not wages and compensation slow down and the extent to which they do is a critical concern for job seekers, employers, and policymakers. After accelerating since spring 2021, wages appear to be slowing down. A further reduction in wage growth would be a relief for policymakers concerned about high inflation and employers with quickly rising costs. For workers, however, slower-growing compensation could put a crimp on their balance sheets and spending if inflation doesn’t slow even more than it already has. The outlook for wage and compensation growth is still blurry. The following metrics may provide some clarity in 2023: wage growth for job switchers, job seeker wage-related queries, and benefit advertisements.
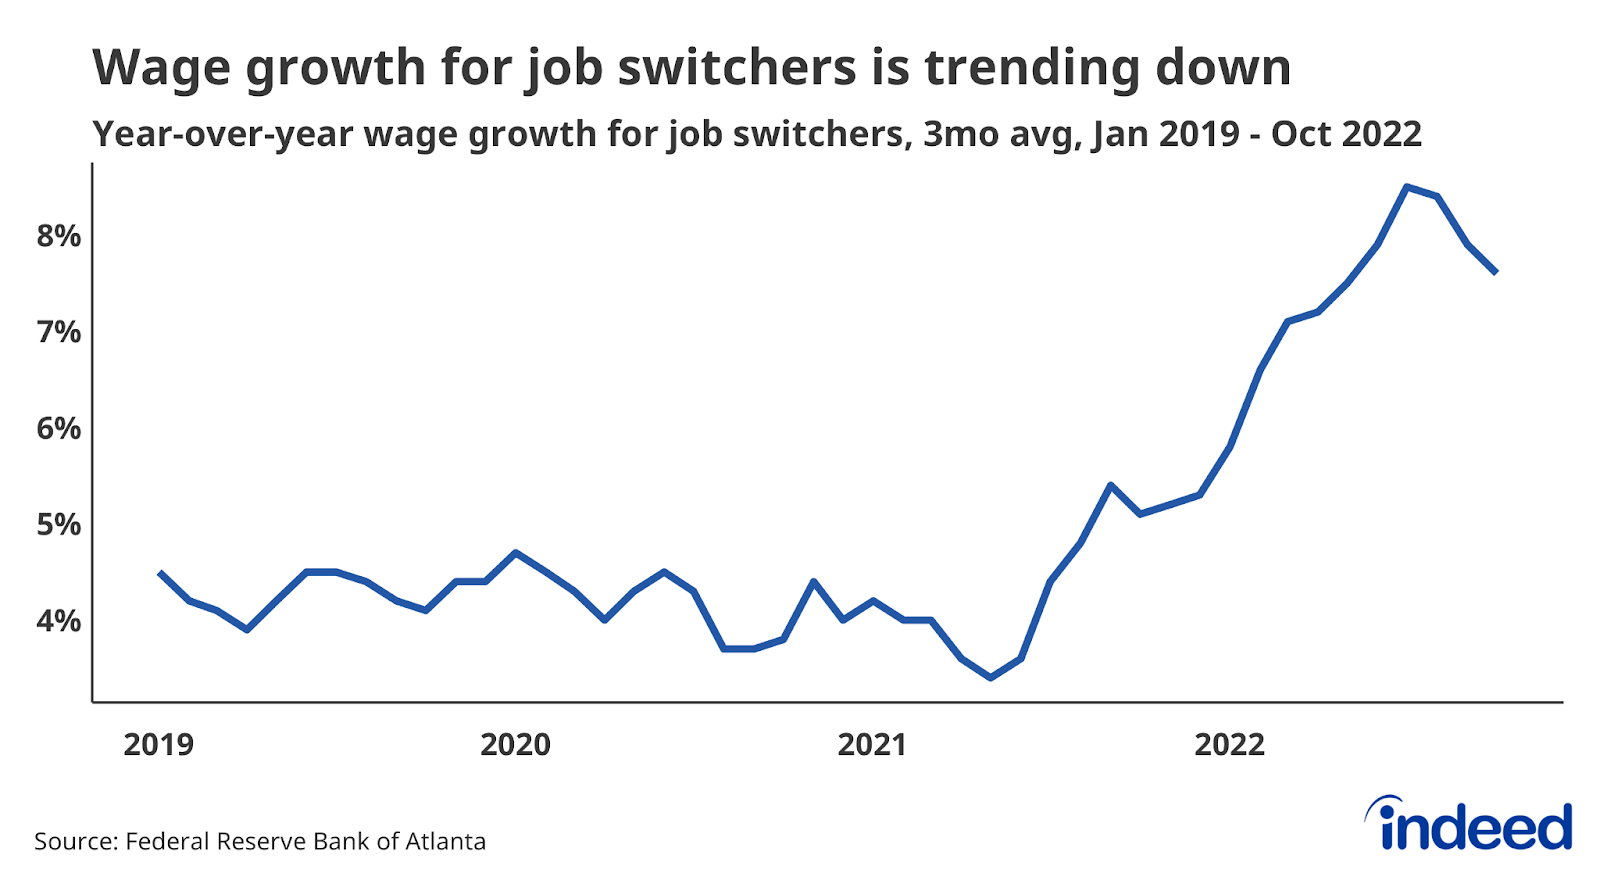
The great acceleration of wages over the past 18 months has been due in large part to the jump in workers quitting their old jobs and starting new ones. Job switchers have seen their average year-over-year wage growth rise from 4.3% in 2019 to 7.6% over the past three months, according to the Atlanta Fed’s Wage Growth Tracker. However, wage gains for this group seem to have peaked having declined over the past three months. A sustained deceleration in this metric would signal that the market for new hires, the most cyclically sensitive part of the labor market, is starting to cool down.
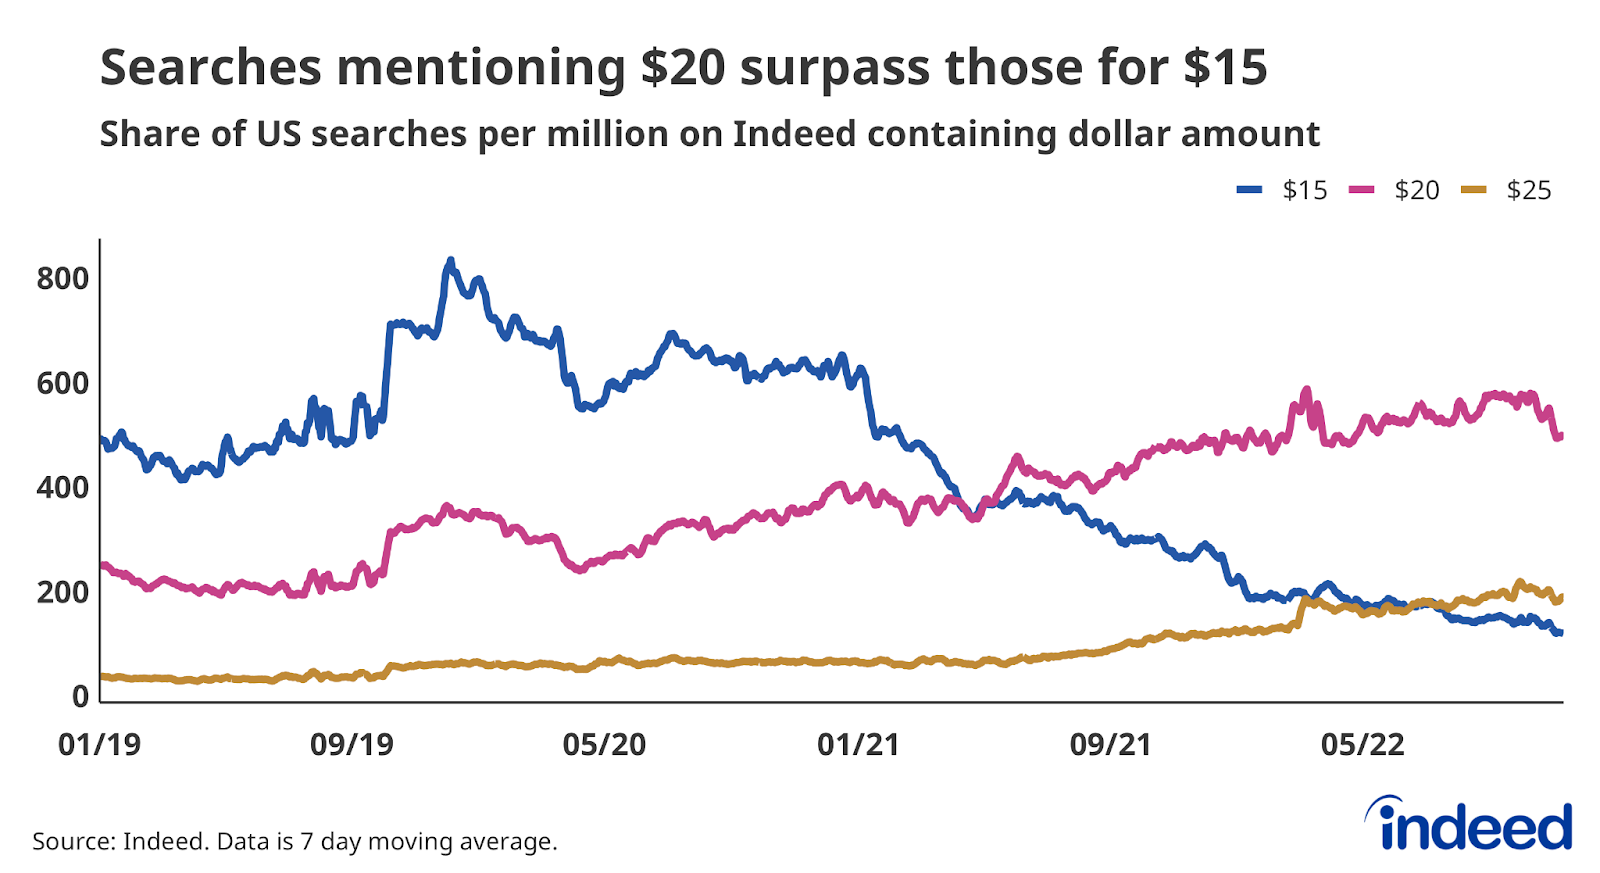
Another way to get a sense of the prospects for wage growth is to look at what job seekers are looking for. Job seeker queries on Indeed reveal a clear upshift in queries related to hourly wages as “$20 is the new $15.” This trend, along with other data on “reservation wages,” indicate job seekers’ desired wages have increased since before the pandemic. However, more recent data show searches for “$20” have recently declined as a share of all searches on Indeed. The same is true for searches for “$25,” suggesting that wage queries haven’t further shifted up. If growth in job seekers’ desired or expected wages is settling down, then wage growth will likely do the same soon after.
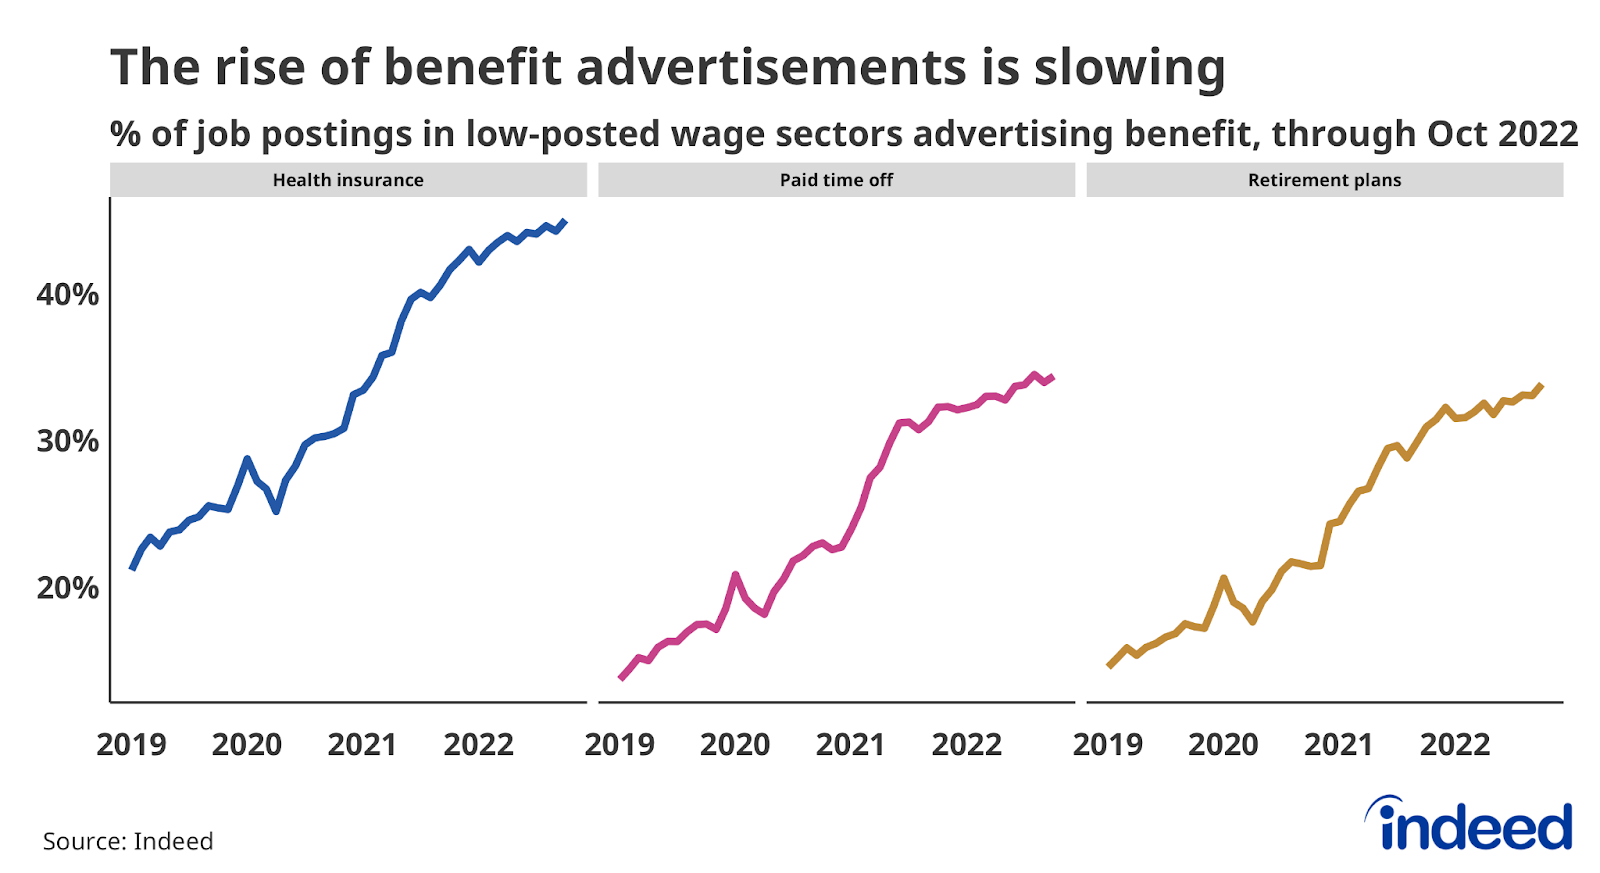
Employers compete not on wages, but rather on total compensation. Benefits are an important margin of competition and employers have increased their advertisement of many benefits in order to attract workers in a hot labor market, a trend recently highlighted in Indeed and Glassdoor’s Hiring and Workplace Trends Report. This increase has been particularly pronounced for job sectors with low posted wages such as Food Preparation & Service, Retail, and Childcare. However, the rise in the share of these postings that are advertising key benefits is starting to taper off, potentially signaling a tapering off in the competition for new hires. Keeping an eye on advertising rates of benefits will complement data on wage growth and deepen our understanding of compensation trends.
Labor Market Overview
The US labor market remains hot. As the US economy bounces back from the initial COVID-19 shock, demand for labor has grown much more quickly than supply. Employment has rebounded, wages are growing quickly, and joblessness is approaching pre-pandemic levels. The labor market is now showing signs of normalizing, particularly as demand for workers cools. The Federal Reserve’s aggressive tightening of monetary policy risks turning this normalization into a sustained downturn.
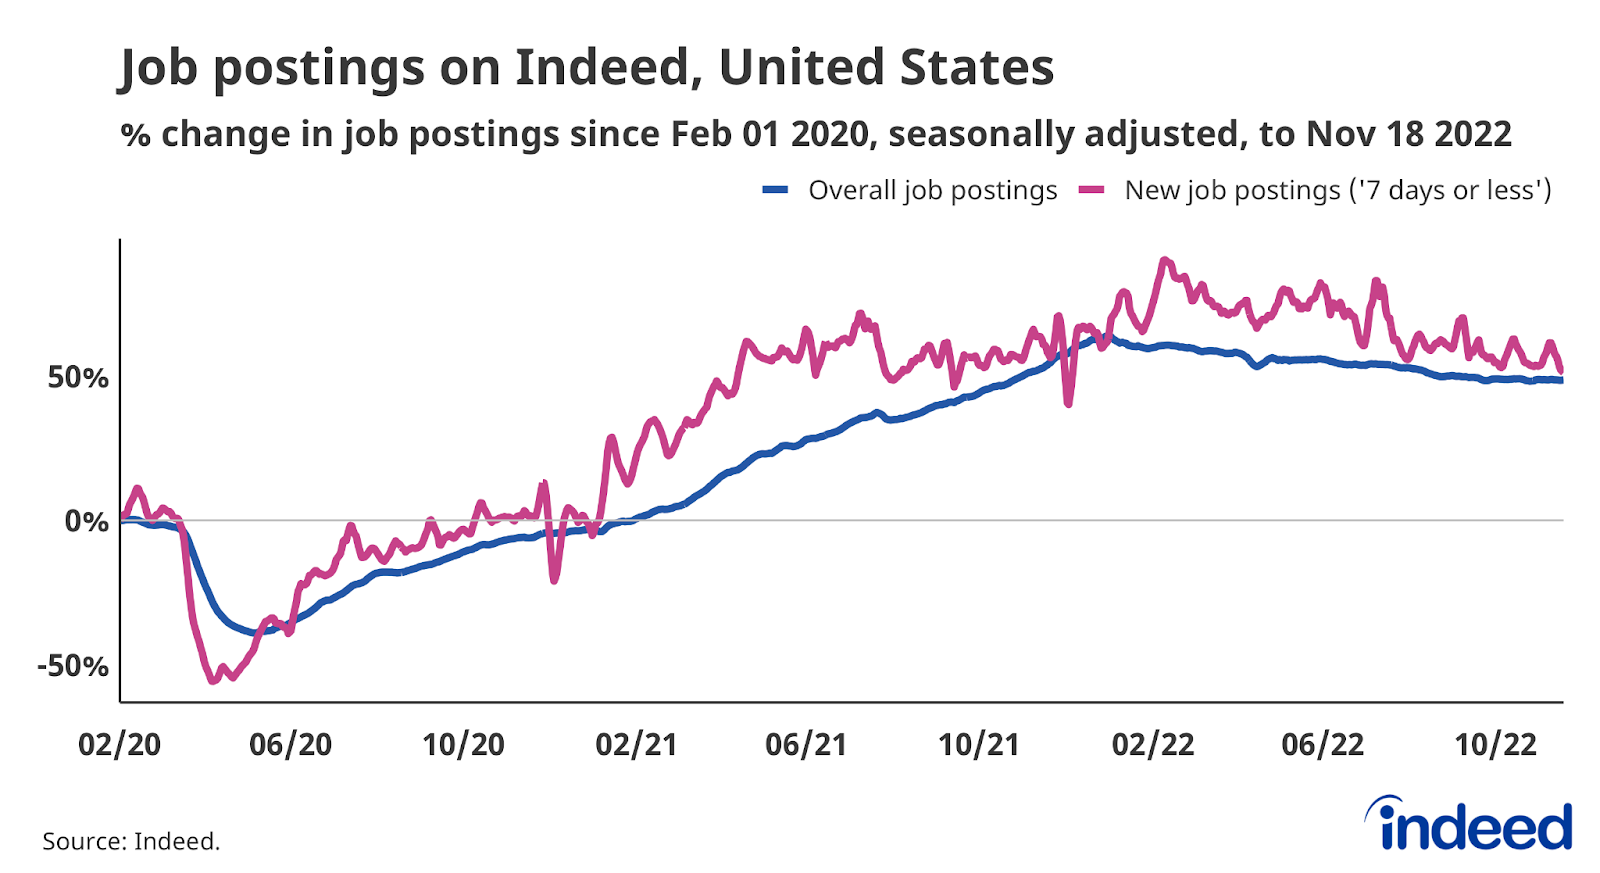
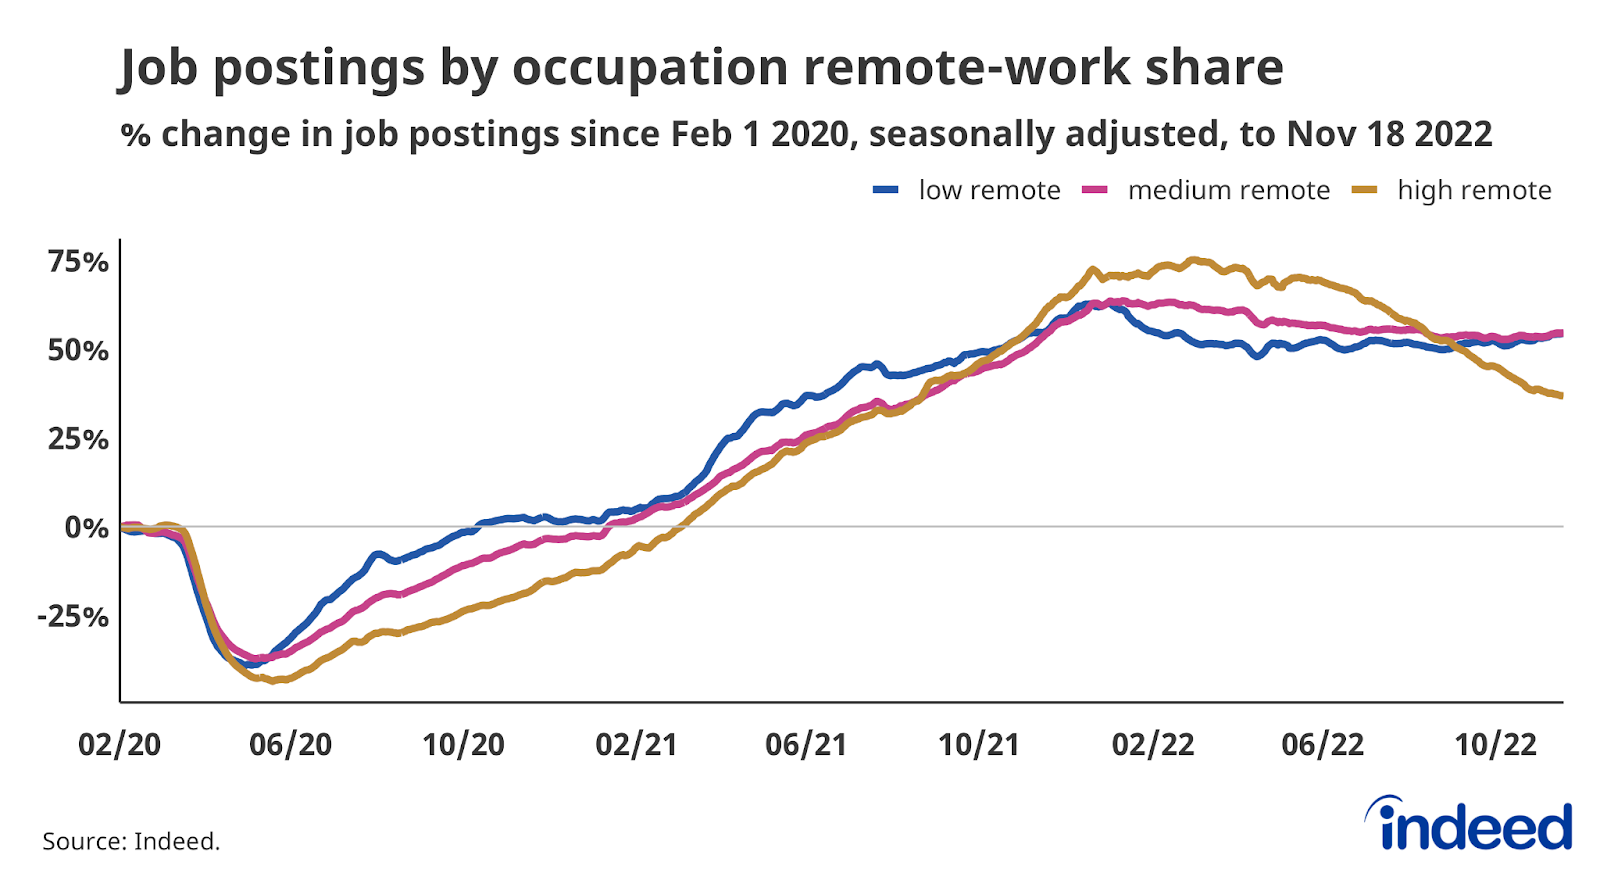
Employer demand for workers remains strong. As of November 18, 2022, job postings on Indeed were 48.7% above their pre-pandemic baseline. New job postings, defined as those on Indeed for seven days or less, are also well above their pre-pandemic baseline, up 51.2%. While job posting growth has slowed, the leveling out has been relatively moderate. The recent decline in postings has been led by job sectors in which remote work is more frequently advertised, such as Software Development and Marketing.
Wage growth remains strong, but there are signs of a slowdown
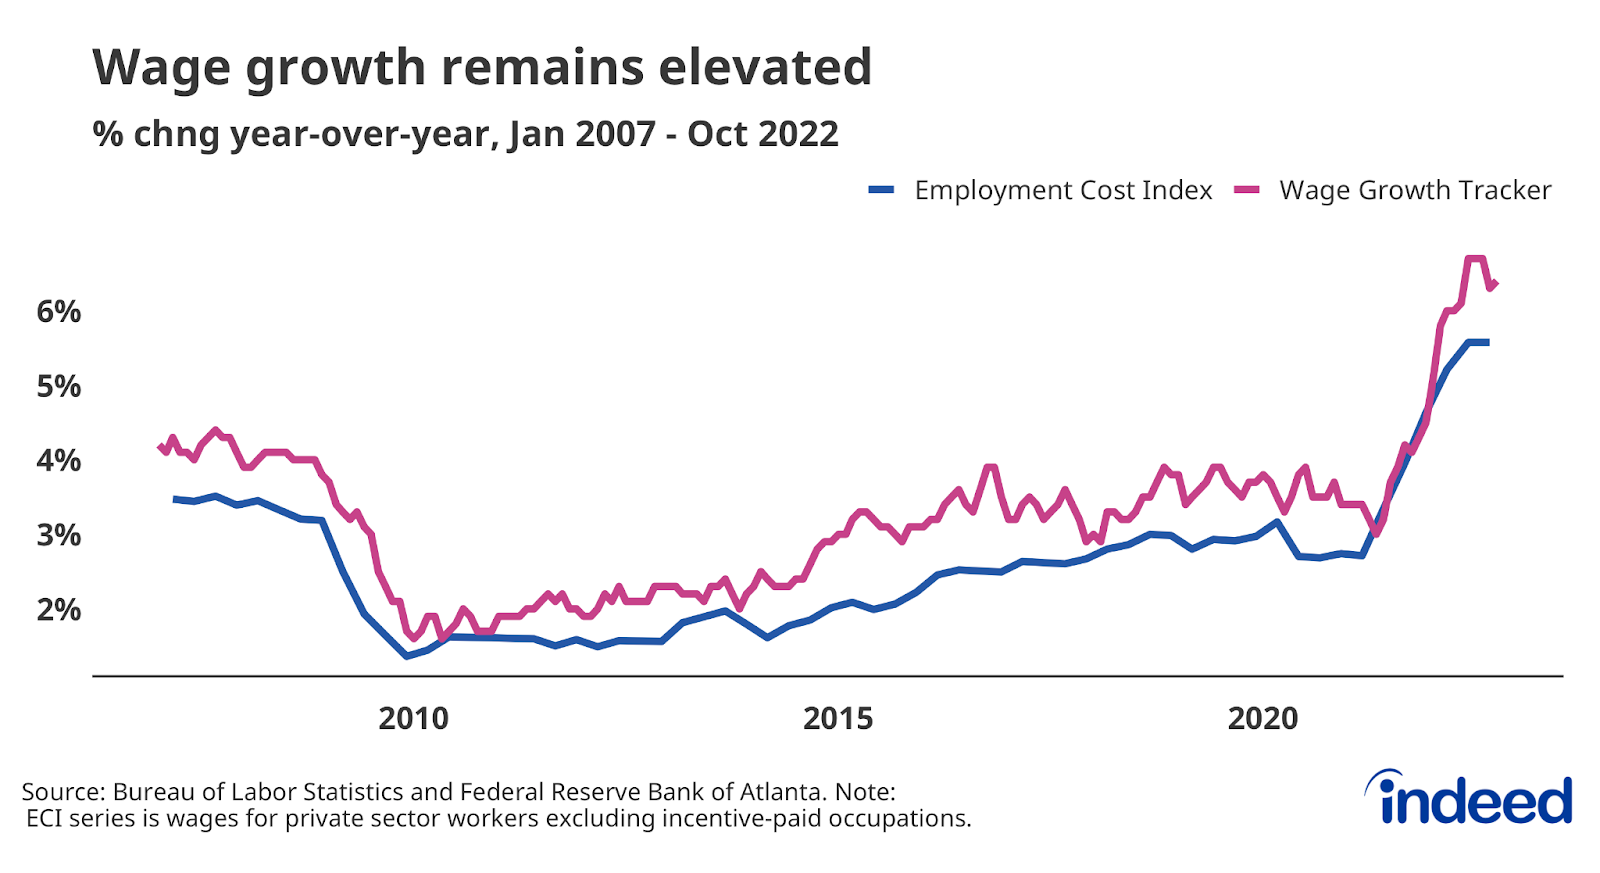
Strong demand for workers across multiple sectors has pushed wage growth up a range of 5% to 6% on an annual basis, a faster growth rate than at any point over the past 20 years. This is what economists call nominal wage growth — that is, pay gains before taking inflation into account. However, rising prices are eating away at those gains and causing many employees to lose ground when it comes to actual purchasing power.
One of the biggest questions for the US economy is the future path of nominal wage growth. The most recent data from high-quality measures of wage growth, such as the Employment Cost Index, show continued high levels of competition for hires. However, there are indications wages have lost momentum. But even as wages slow down, they have a ways to go before they return to their slower pace circa 2019.
People are returning to work
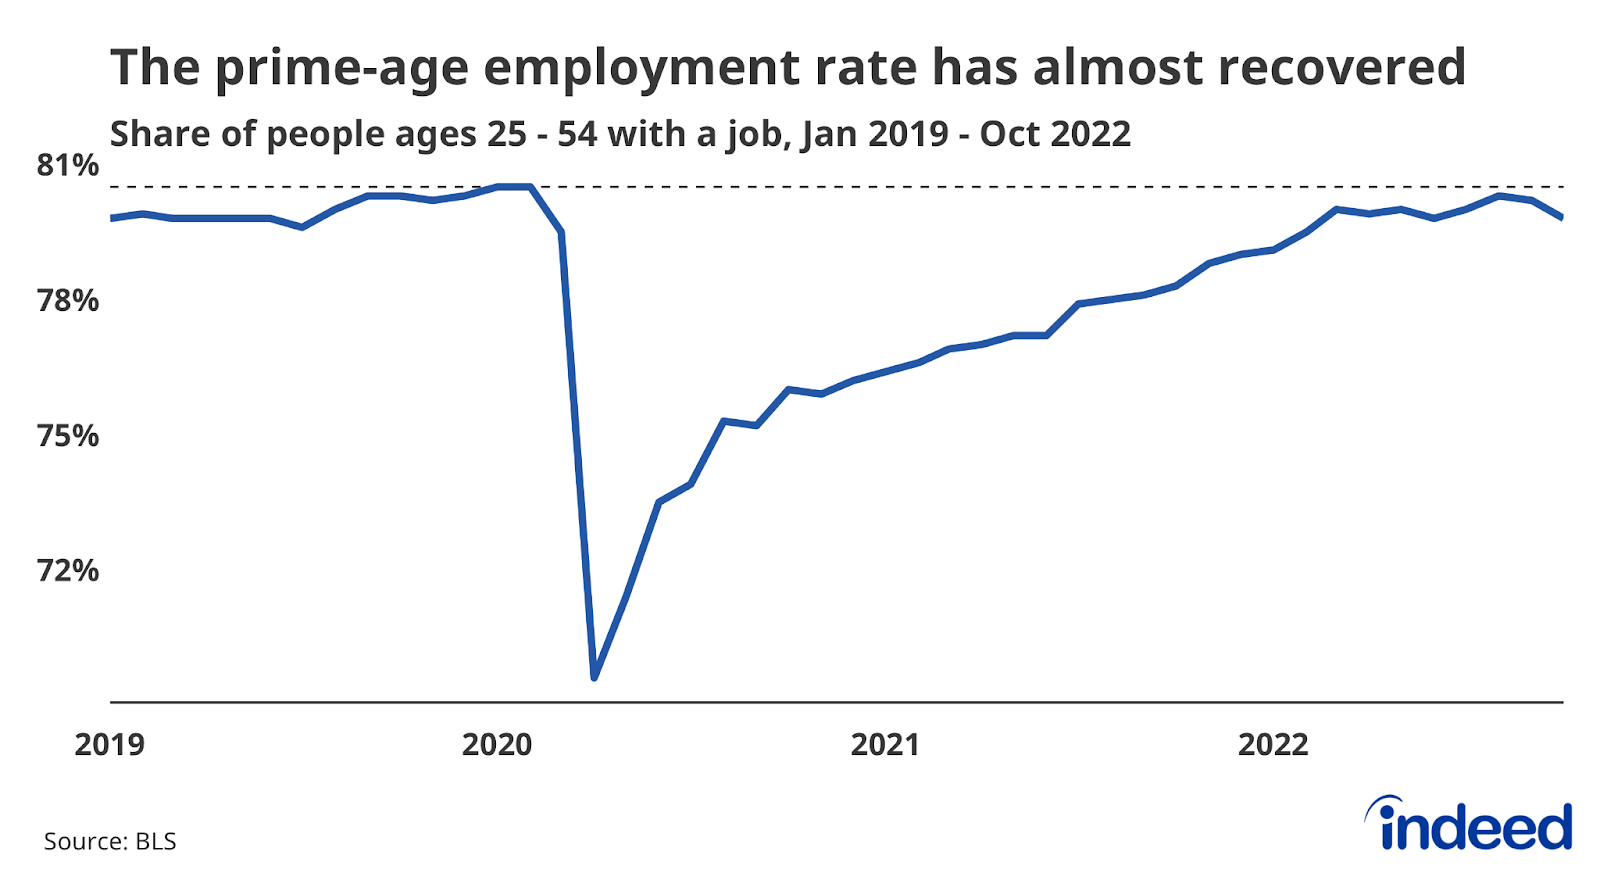
Labor supply has not grown as swiftly as demand, but people are returning to work. The growth in the labor force participation rate and the employment-to-population ratio has declined in 2022, but significant progress has been made. Consider the employment-to-population ratio for workers ages 25 to 54, a good measure of the health of the labor market. This ratio has fallen the past three months but is still above its average level in 2019 when the labor market was healthy. This is in addition to total payroll jobs which have already returned to pre-pandemic levels.
The employment rate for all workers is further from its pre-pandemic rate, due in large part to a lagging recovery for older workers. Many people continue to ‘unretire,’ but the recent stagnation in this trend and rise in workers entering retirement suggests we shouldn’t expect older Americans to be a significant source of employment moving forward.
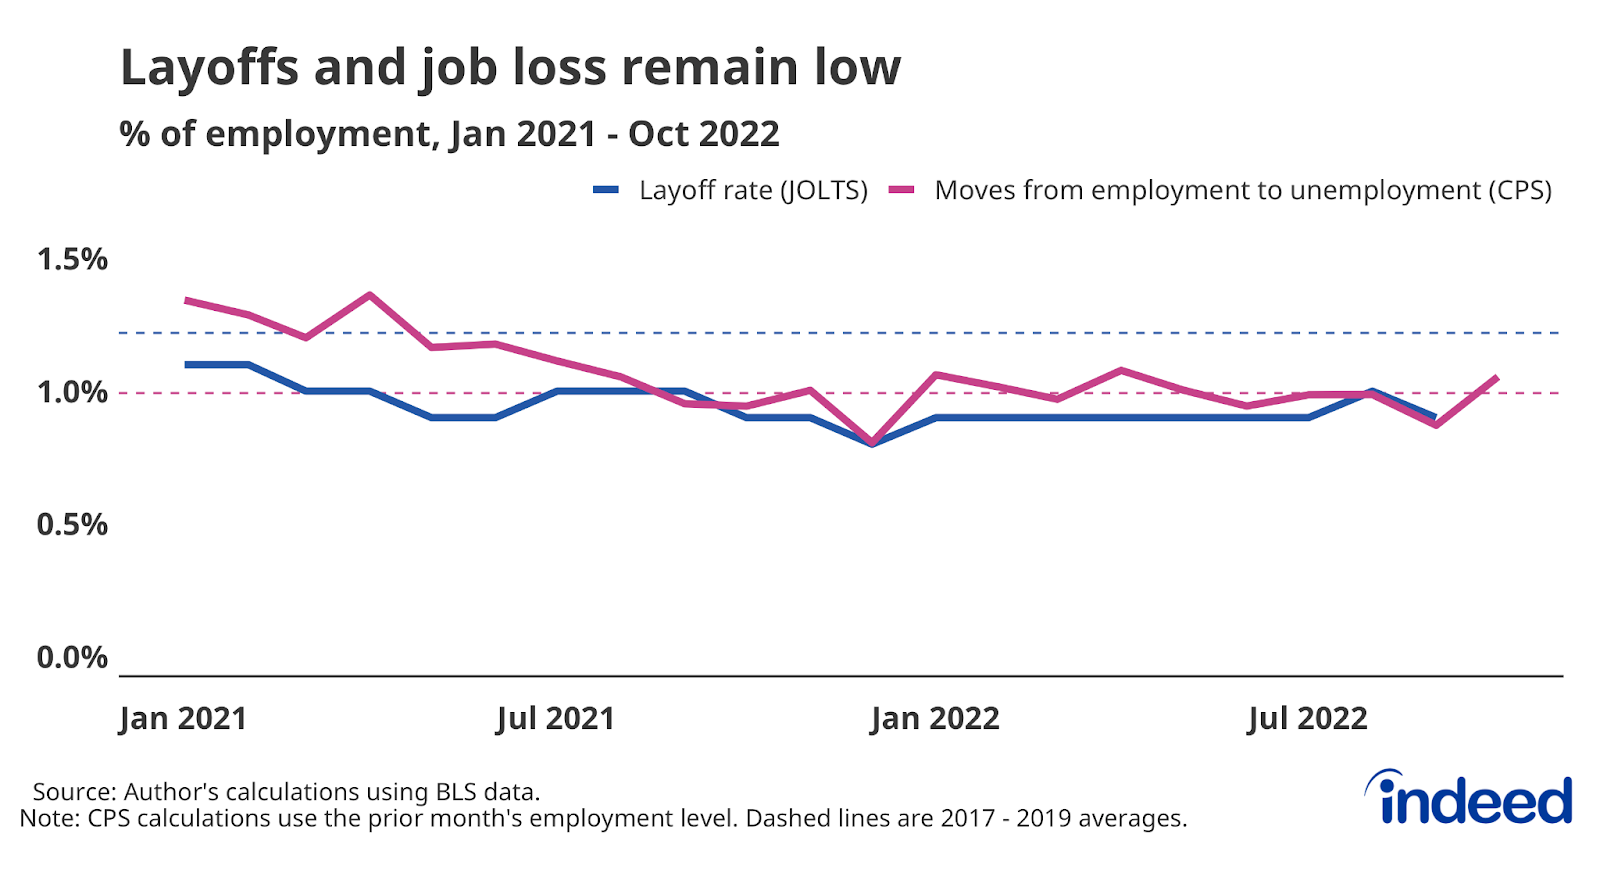
Quitting is still elevated, but fading as layoffs remain low
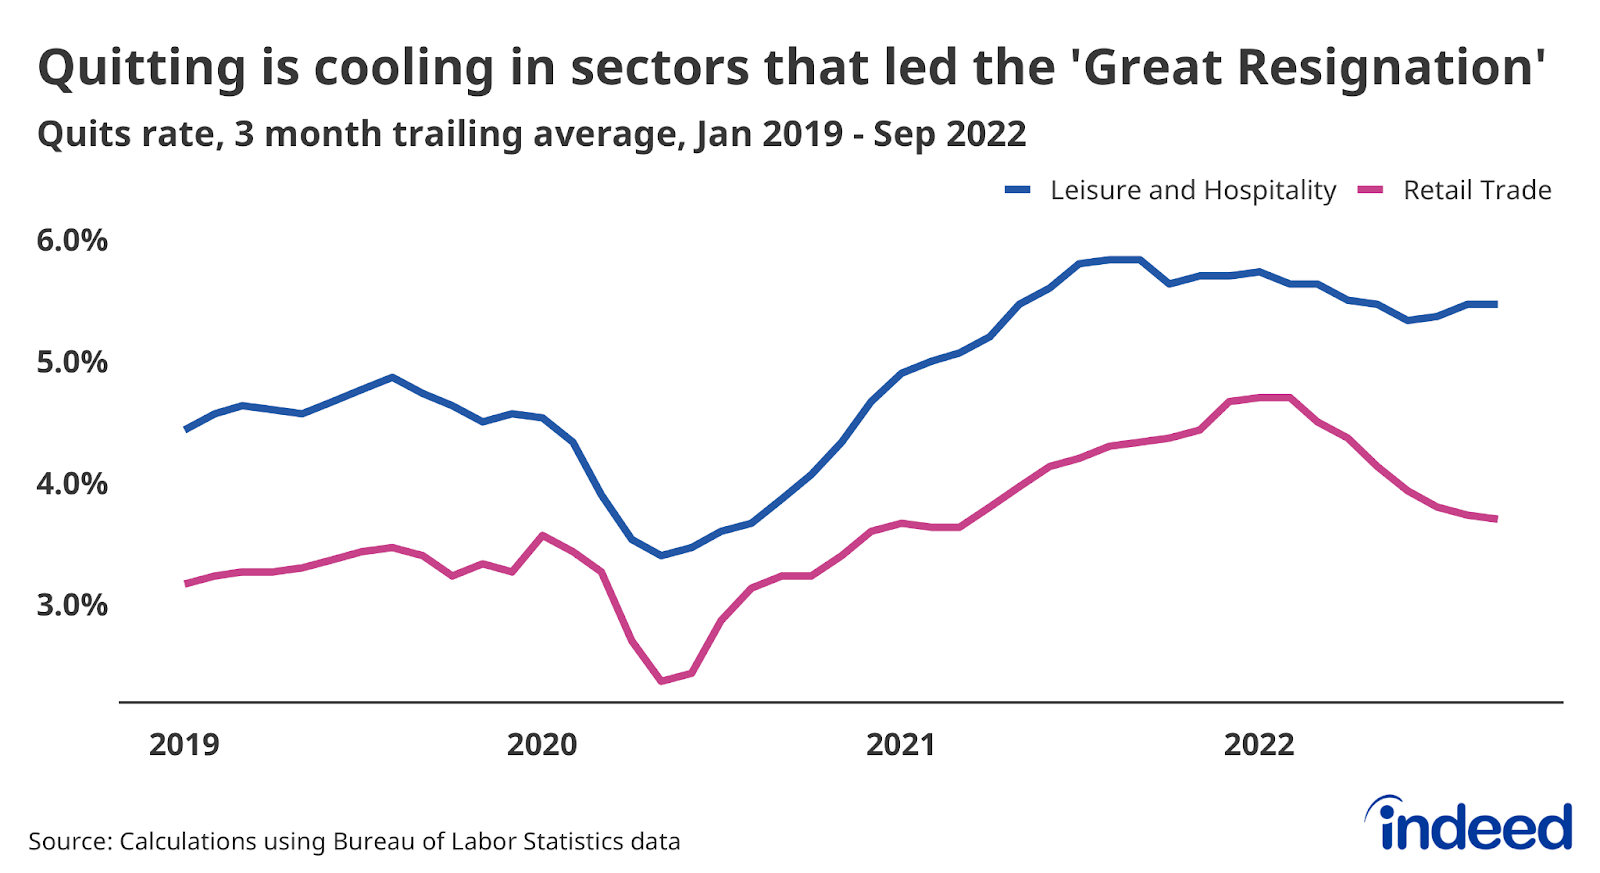
While cooling somewhat in recent months, the job quitting rate is still 16% above the pre-pandemic norm as employed workers continue to find new work at elevated rates. Notably, quitting has fallen in sectors that saw elevated quitting in 2021, namely Leisure and Hospitality and Retail Trade. A continued cooldown in quitting would lead to slower wage growth as workers quitting their old jobs and finding new ones is a major source of wage gains.
Workers are leaving their jobs voluntarily at high rates, but employers seem loath to let go of their employees. The recent wave of announced layoffs in the tech sector signals a painful recalibration in that sector, but overall layoffs are starting from a very low level. Layoffs have averaged about 1.4 million a month from July through September. Layoffs would have to rise about 29% in order to return to their monthly average of 1.8 million in 2017 through 2019.
Furthermore, what’s happening in the tech sector isn’t necessarily a portent of the overall labor market’s future. Technology companies have a much bigger footprint in stock indexes than they do in the labor market.
The US labor market has plenty of opportunities for workers while presenting some challenges to employers. However, the current situation undoubtedly will change. We will continue to monitor these trends and track others as the labor market evolves.
Methodology
Data on seasonally adjusted Indeed job postings are the percentage change in seasonally adjusted job postings since February 1, 2020, using a seven-day trailing average. February 1, 2020, is our pre-pandemic baseline. We seasonally adjust each series based on historical patterns in 2017, 2018, and 2019. We adopted this methodology in January 2021. Data for several dates in 2021 and 2022 are missing and were interpolated. Non-seasonally adjusted data are calculated in a similar manner except that the data are not adjusted to historical patterns.
The number of job postings on Indeed.com, whether related to paid or unpaid job solicitations, is not indicative of potential revenue or earnings of Indeed, which comprises a significant percentage of the HR Technology segment of its parent company, Recruit Holdings Co., Ltd. Job posting numbers are provided for information purposes only and should not be viewed as an indicator of performance of Indeed or Recruit. Please refer to the Recruit Holdings investor relations website and regulatory filings in Japan for more detailed information on revenue generation by Recruit’s HR Technology segment.