
Key Points:
- The share of searches for $20 wages has grown 35.5% year over year, and illustrates a shift in job seekers’ search behavior.
- Wage gains and inflation are likely influencing job seekers’ expectations toward higher dollar amounts as that share of searches for $20 wages overtake those for $15.
- Despite some cooling, the US labor market remains hot as demand is still elevated and joblessness is low.
- Job postings on Indeed were 50.5% above their pre-pandemic baseline as of August 19, signaling robust hiring intentions.
- However postings are gradually pulling back, with job postings slowing more in remote sectors than in-person ones.
Spotlight: Among jobseeker searches, $20 is the new $15
The growth of job search terms can be a window into how the labor market has changed over time. Searches on Indeed often focus on an occupation or preferred location, but jobseekers also search for specific dollar amounts. In other words, jobseekers look for a particular wage and in aggregate, these searches provide insight into wage expectations.
Throughout 2019 and much of 2020, the share of searches on Indeed mentioning “$15” was greater than those mentioning “$20”. But that trend reversed in April 2021. Since then, the share of $20-related searches has outpaced searches mentioning $15. Moveover, as of August 14, the share of $20 related searches has grown 35.5% year over year. By contrast, searches related to $15 have declined 57.3% over the same time period.
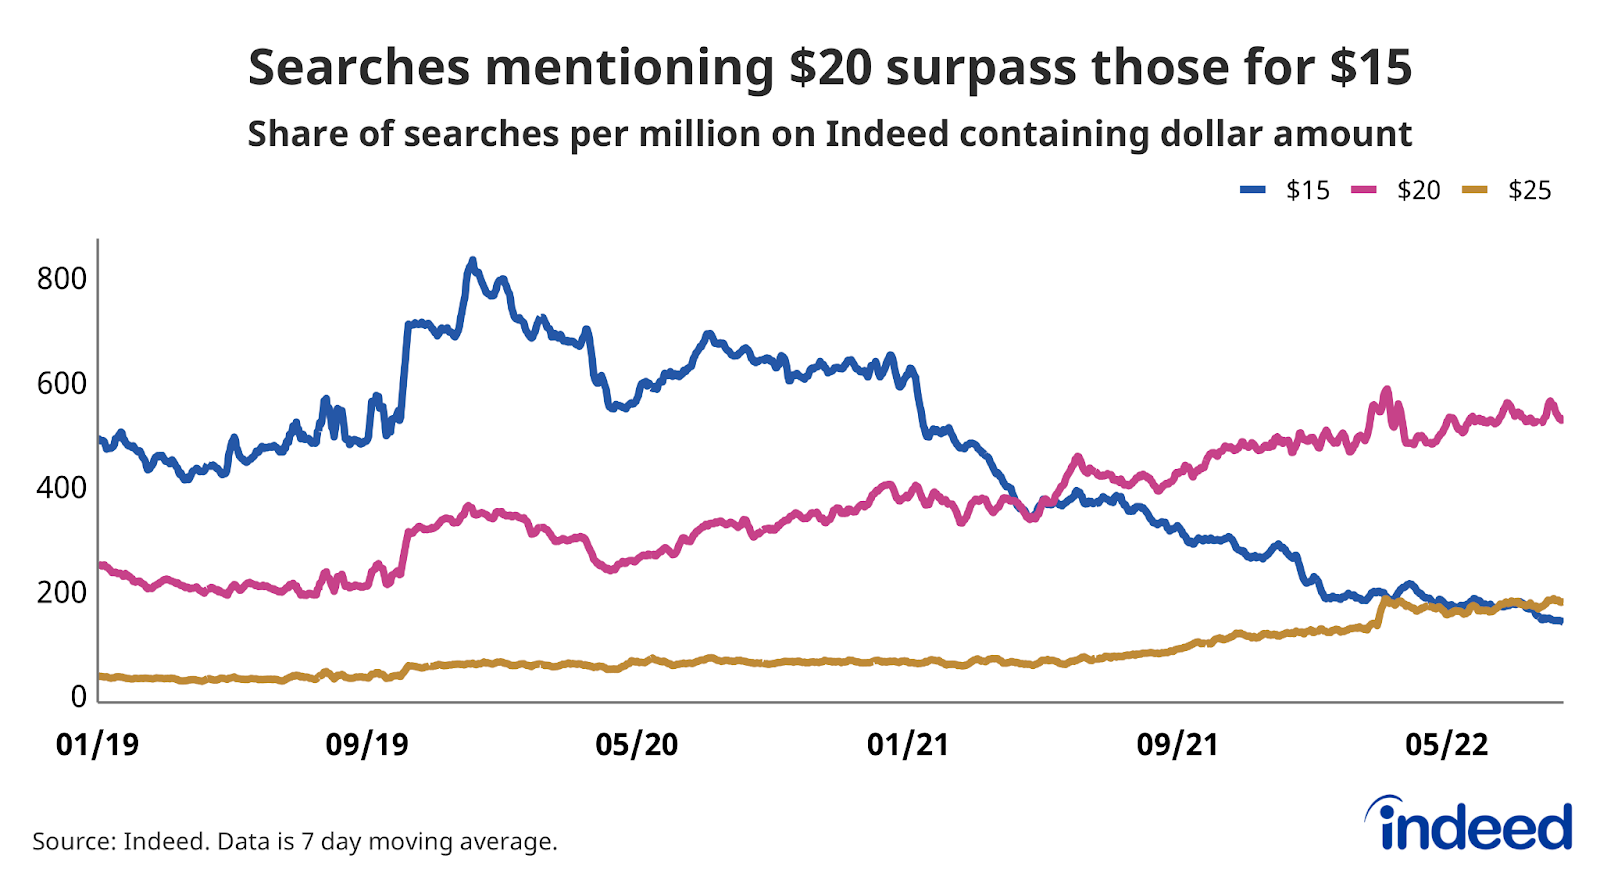
Job seeker searches for “$25” have risen as well. While still smaller than those for $20, the share of $25-related searches has increased 122% year-over-year as of August 14. Additionally, the share of searches for $25 has outstripped the share of $15-related searches as of mid-June 2022.
Two factors, nominal wage gains and inflation, are likely influencing job seekers to search for higher dollar amounts. In the last twelve months ending July 2022, wage growth for hourly workers clocked in at 5.9%, outpacing the strong wage growth of 5.1% seen by non-hourly workers. Once job seekers know it’s possible to attain a higher wage, their expectations may shift and act as a pull factor in searching for a higher dollar amount. In this case, the shift in jobseeker expectations from searching for $15 to instead $20 is clear.
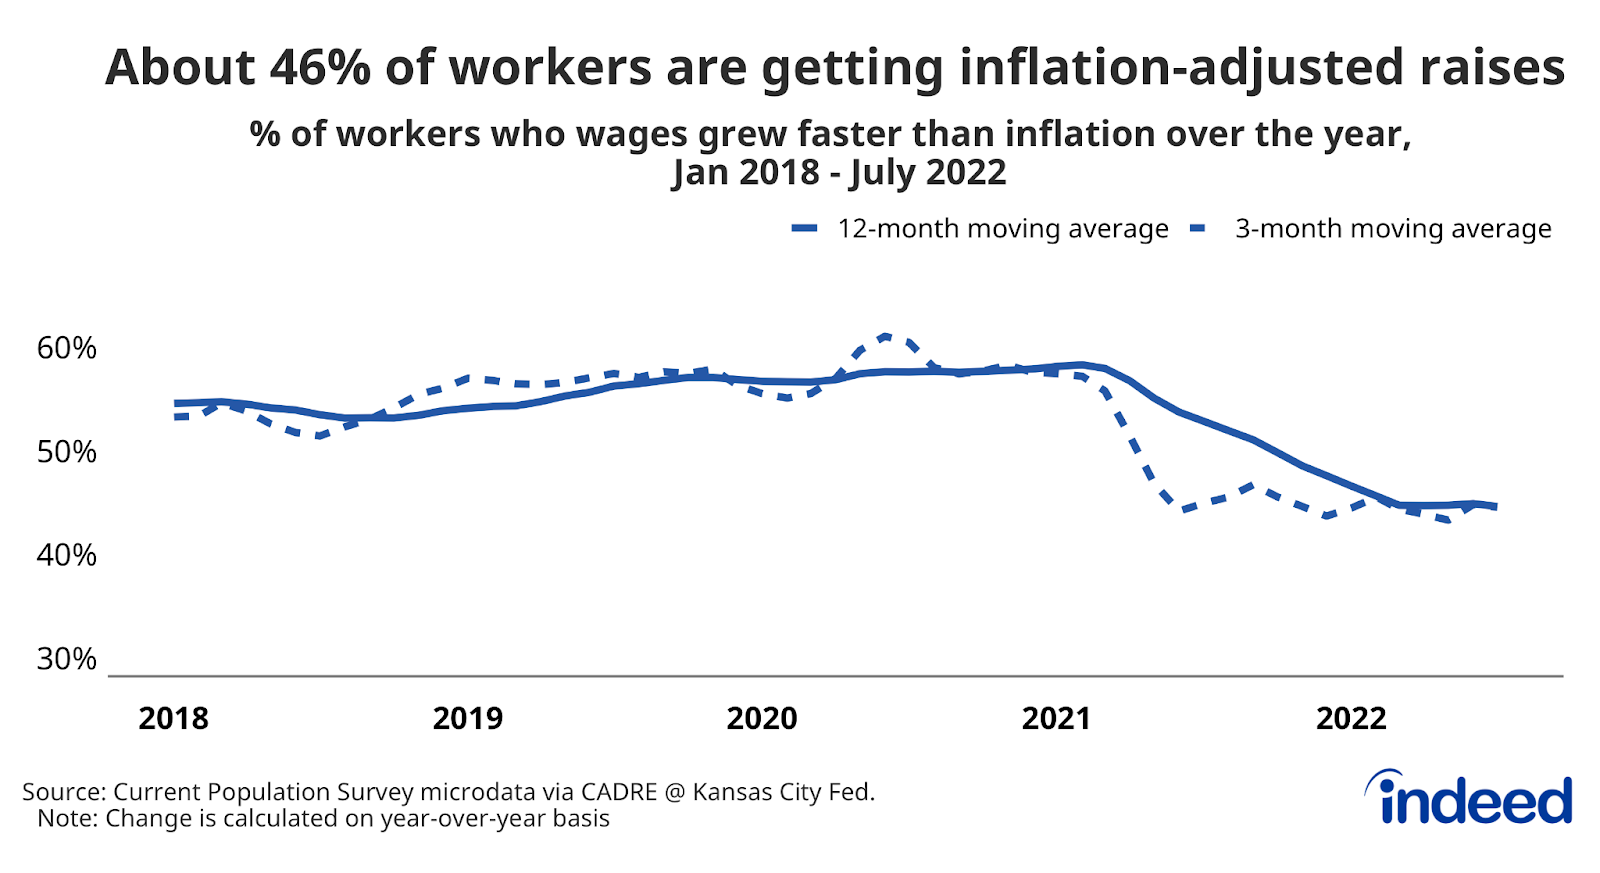
On the flip side, inflation continues to take a bite out of workers’ paychecks. In July, 46% of workers saw wage gains that outpaced inflation. While July’s cooler Consumer Price Index report was welcome news, prices remain higher than they were a year ago. At the same time, 40% of adults in households said it has been somewhat or very difficult to cover usual household expenses. This may be a push factor for jobseekers to increase their wage expectations while job searching.
Labor Market Overview
The US labor market remains hot and the July employment situation tamped down recession chatter. The unemployment rate sits at a 50-year low while demand for labor remains strong. There are signs of normalization, with job openings ticking down from historic highs and some patches of cooling like tech job postings. Potential headwinds for this normalization include aggressively tightening monetary policy, geopolitical instability, and the evolution of the COVID-19 pandemic.
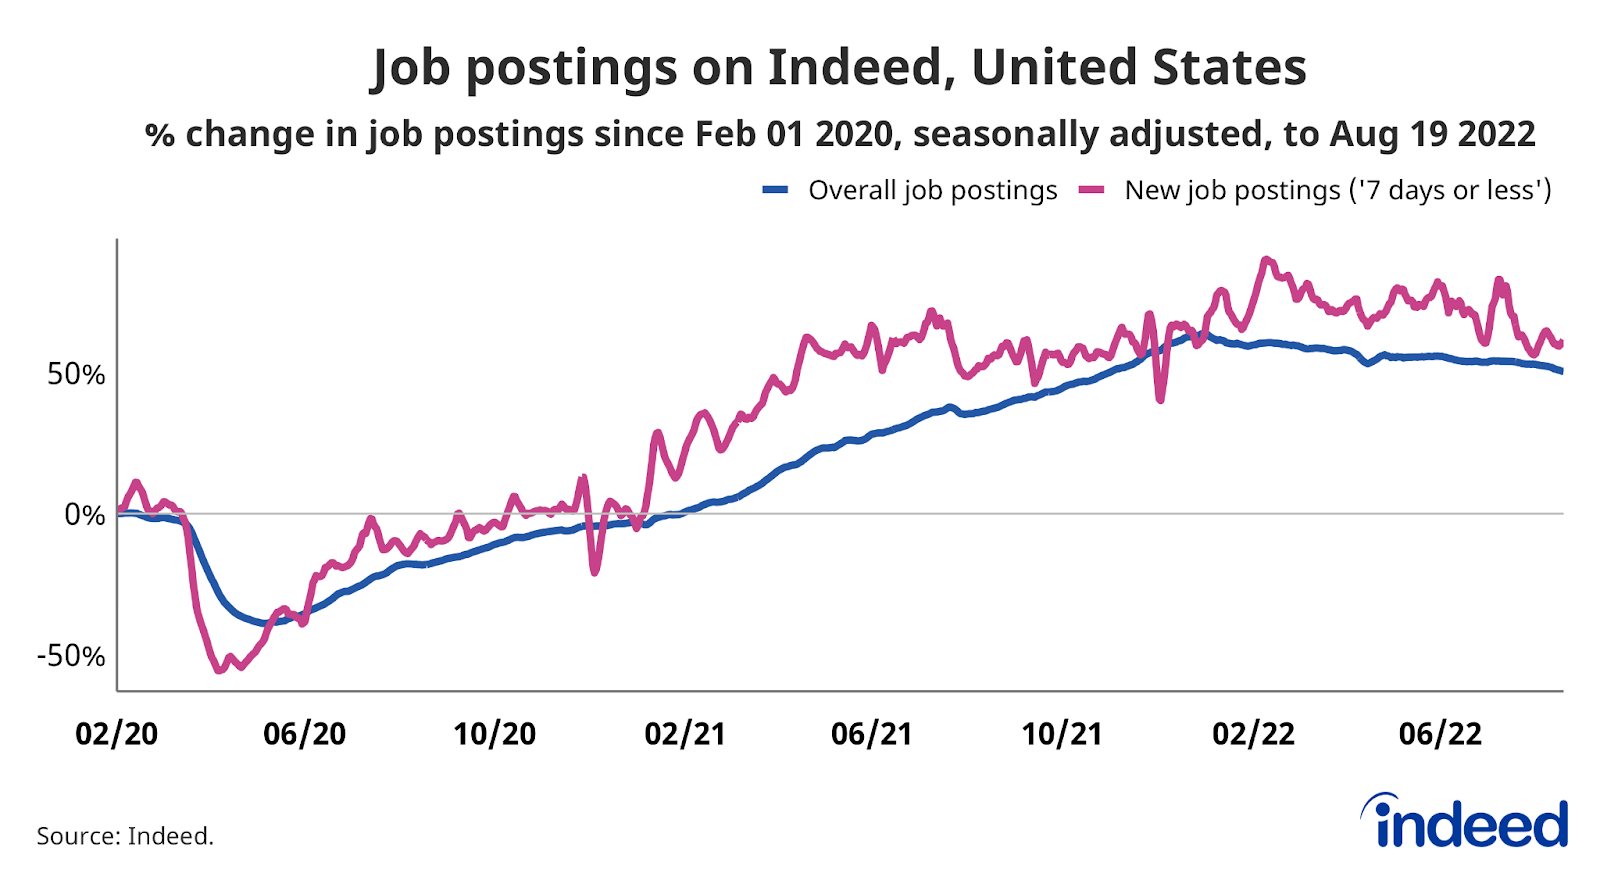
Employer demand for workers remains strong, with Indeed job postings as of August 19, 2022 50.5% above their pre-pandemic baseline. New job postings, defined as those on Indeed for seven days or less, are also well above their pre-pandemic baseline, up 61.6%. While job postings growth has slowed, the leveling out has been moderate.
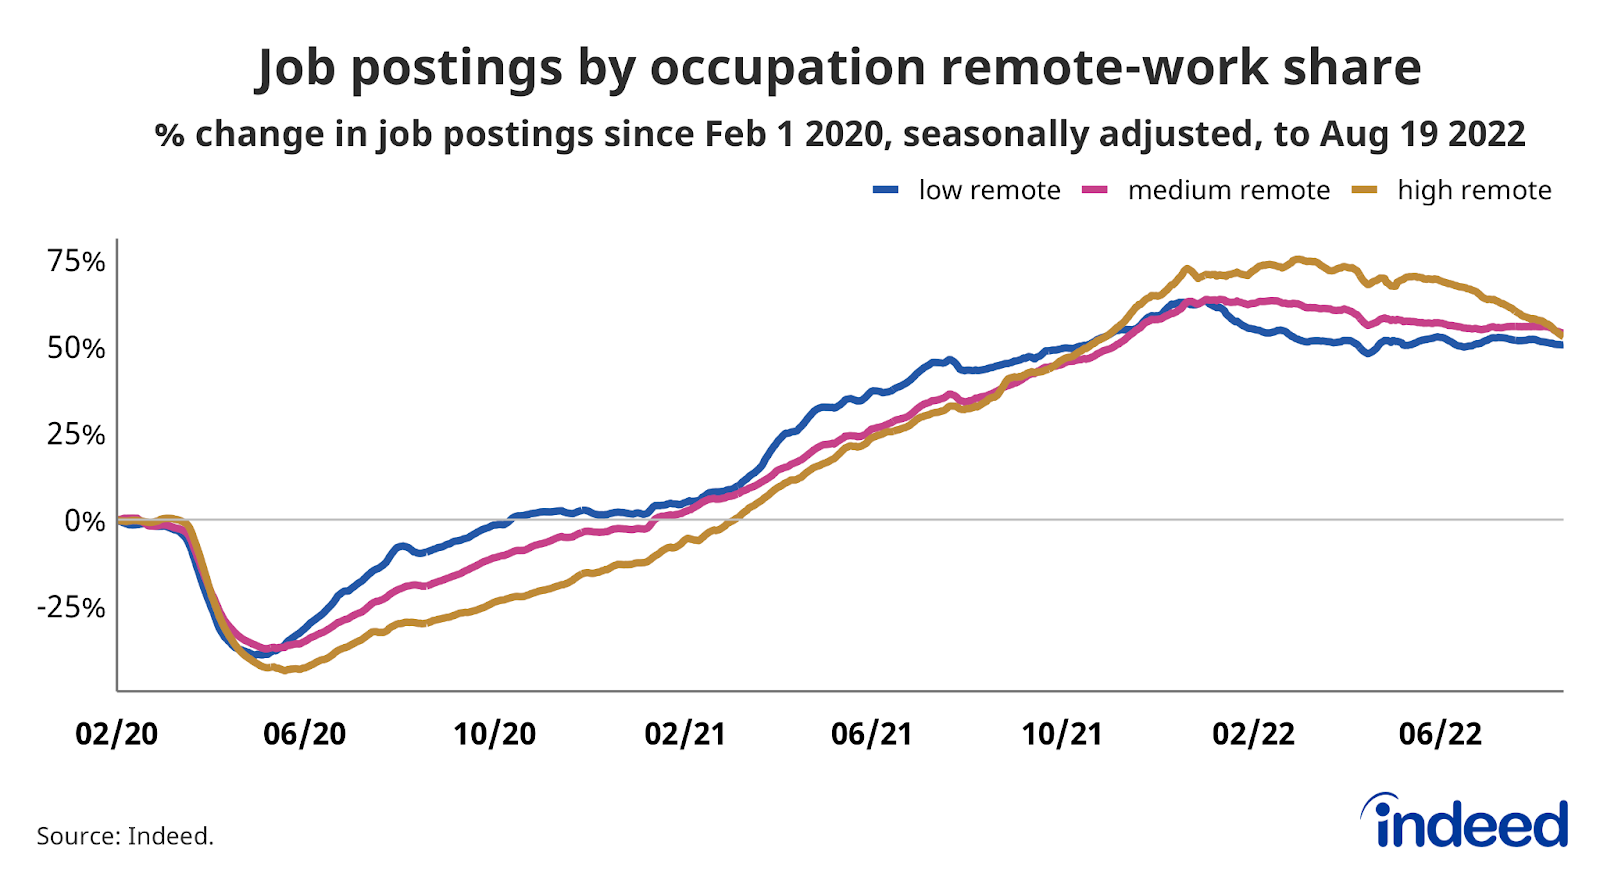
At the same time, job postings in remote sectors are cooling more than in-person ones. Over the last 4 weeks, job postings in high remote sectors dropped 6.5 percentage points. But job postings in low remote sectors have been flat, declining just 1.2 percentage points. Tech, a remote friendly sector, is one area where cooling is particularly noticeable. But at the same time, employer demand for tech workers remains well above its pre-pandemic levels and layoffs in the information sectors remain low.
Job openings
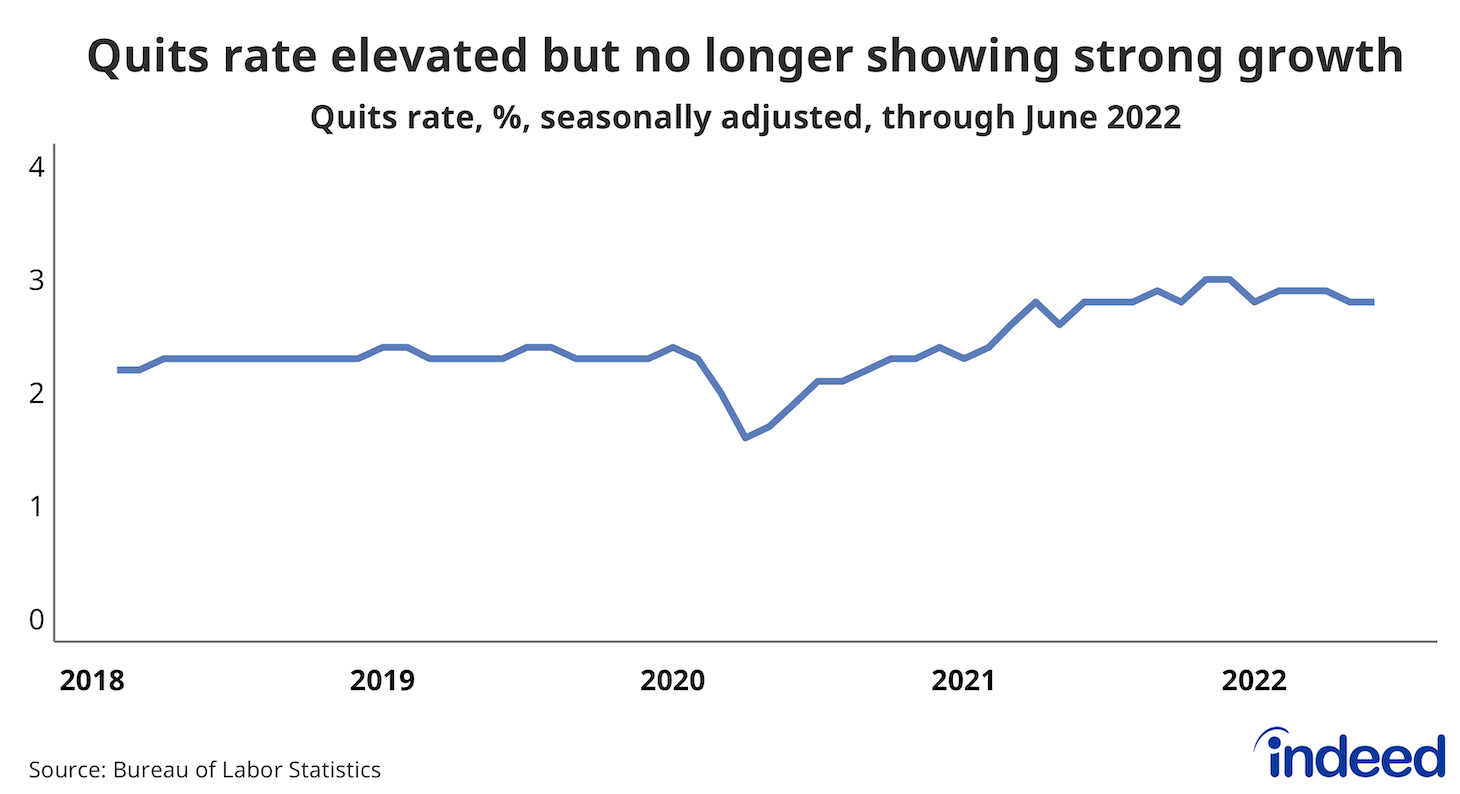
Further evidence of a strong labor market can be found in the Bureau of Labor Statistics Job Openings and Labor Turnover Survey (JOLTS) report. Despite edging down for three consecutive months, job openings remain above their level from the same time last year and near its historic high. Moreover, the JOLTS report shows that workers remain confident. The quits rate also remains close to its historic high, further highlighting the importance of job seeker’s pay expectations, as they remain more likely to leave a role in search of the wage they want.
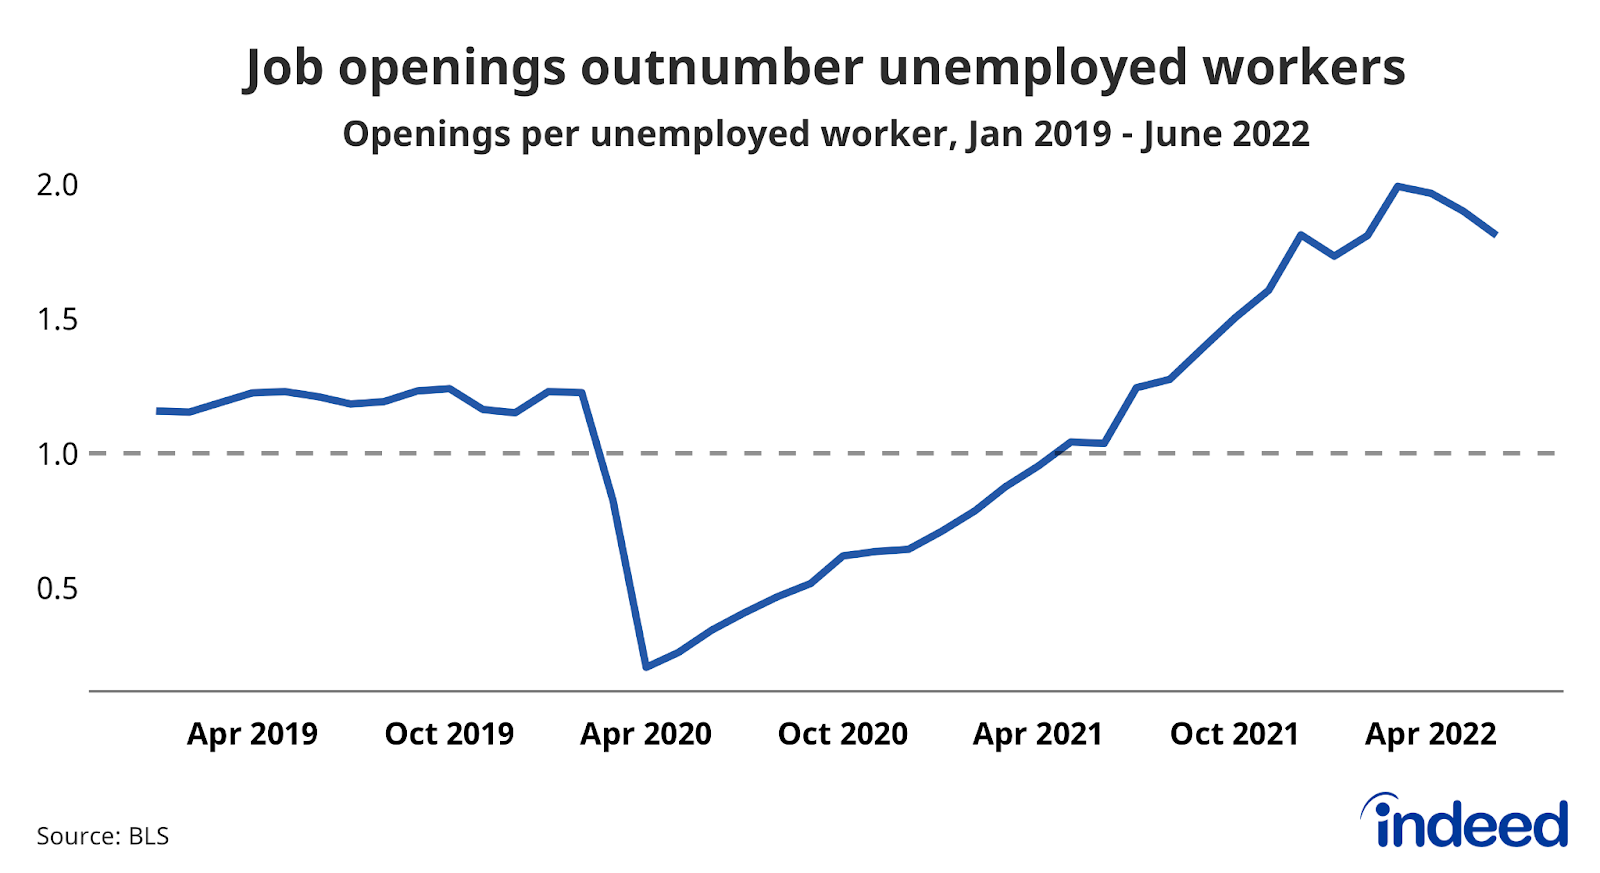
Job openings outnumber unemployed workers
Despite recent declines, job openings still outnumber unemployed workers by a sizable margin, illustrating just how tight the labor market remains. The ratio of openings per unemployed worker has dropped for three straight months, but at a June reading of 1.8 remains well above the Federal Reserve’s goal of getting this number closer to one. It seems possible that employer demand would need to cool significantly more before recruiters start to notice an easing in recruiting conditions.
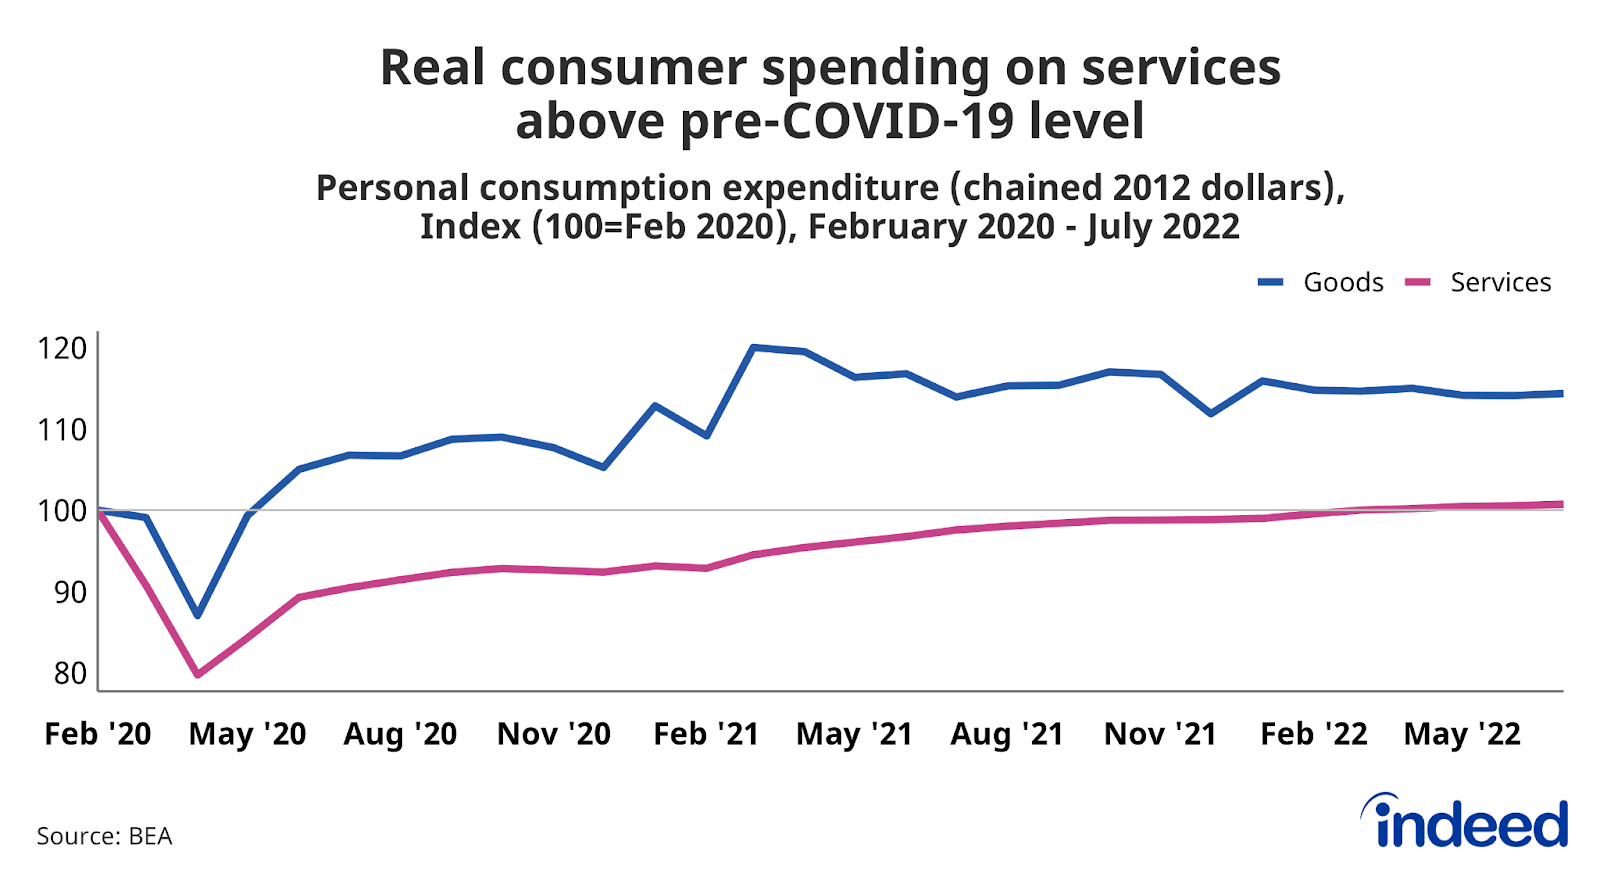
A slow shift back to services
July’s consumer spending data from the Bureau of Economic Analysis shows that real spending on goods remains elevated while services spending slowly edges past pre-pandemic levels. Despite strong demand – job postings on Indeed for Hospitality & Tourism, Retail, and Food Preparation & Service are all well above their pre-pandemic baseline – the service-related labor market has been slower to rebound. This shift in spending bodes well for leisure & hospitality payrolls which remain about 7% below their February 2020 level.
Businesses ultimately want to match consumer demand and how spending shapes up in the second half of this year will be key to watch. As consumers’ dollars flow into businesses, this impacts businesses’ future hiring plans as they want to ensure there are enough workers on hand.
Currently, the US labor market continues to provide opportunities for workers while presenting some hiring challenges to employers. However, the present situation undoubtedly will change. We will continue to monitor these trends and track others as the labor market evolves.
Methodology
Data on seasonally adjusted Indeed job postings are the percentage change in seasonally adjusted job postings since February 1, 2020, using a seven-day trailing average. February 1, 2020, is our pre-pandemic baseline. We seasonally adjust each series based on historical patterns in 2017, 2018, and 2019. We adopted this methodology in January 2021. Data for several dates in 2021 and 2022 are missing and were interpolated. Non-seasonally adjusted data are calculated in a similar manner except that the data are not adjusted to historical patterns.
Searches for specific dollar amounts are defined as any search query containing “$15,”, “$20,” and “$25”. Data for a few dates in 2022 are missing and were interpolated. Queries include those made with autocomplete.
The number of job postings on Indeed.com, whether related to paid or unpaid job solicitations, is not indicative of potential revenue or earnings of Indeed, which comprises a significant percentage of the HR Technology segment of its parent company, Recruit Holdings Co., Ltd. Job posting numbers are provided for information purposes only and should not be viewed as an indicator of performance of Indeed or Recruit. Please refer to the Recruit Holdings investor relations website and regulatory filings in Japan for more detailed information on revenue generation by Recruit’s HR Technology segment.