
Introduction
By most measures, this is a boom time for jobs in the U.S. The unemployment rate — the most widely watched barometer of the job market’s health — stands at 3.5%, its lowest level since the 1960s. The share of workers leaving jobs voluntarily is rising, a sign people are confident they’ll be able to find employment elsewhere. For their part, employers complain they can’t find the workers they need. To staff up, they have begun raising wages more aggressively and recruiting among previously marginalized groups, such as people with criminal records.
Yet, despite this strength, the job market still isn’t firing on all cylinders. One of the strongest signals that the market has room for improvement is a stubbornly high rate of long-term unemployment.
The Labor Department defines the long-term unemployed as people who have been out of work for 27 weeks or more, but are still actively seeking a job by applying online, visiting job sites, or taking other steps to get hired. Because they are looking for work, they are considered part of the labor force. Their efforts to find employment distinguish them from jobless people who want to work but have given up searching and are not counted as part of the labor force.
Currently, long-term unemployment is 0.67%, roughly where it was before the Great Recession, but significantly higher than the 0.45% rate in 2000. In fact, long-term unemployment rates are higher today than in 2000 for the vast majority of categories of workers — men and women, and across almost all age groups, races, ethnicities, and education levels.
This report takes a close look at long-term unemployment in the U.S., examining the characteristics of people likely to be jobless for more than six months. Government data show:
- Racial and ethnic minority groups and less educated workers have the highest long-term unemployment rates.
- Younger and less educated people have registered the biggest increases in long-term unemployment rates since 2000.
The report also presents the results of an Indeed survey conducted in December 2019 of 1,280 people who were out of work for more than six months and actively seeking a job to learn more about who the long-term unemployed are and the barriers that keep them from finding employment.
The most important insight of this research is that the long-term unemployed represent an opportunity for employers — a largely untapped resource that can be drawn on at a time when traditional job candidates are scarce. Developing ways to locate, hire, and train these workers makes a world of sense in today’s tight job market.
Who the long-term unemployed are: A demographic deep dive
Like the overall unemployment rate, long-term unemployment levels vary significantly according to age, race, gender, and education. Not surprisingly, minorities and people with a high school education or less are more likely to find themselves in the ranks of the long-term jobless. At the same time though, long-term unemployment patterns have changed over the past two decades, with some groups posting bigger increases in long-term joblessness than others.
Age
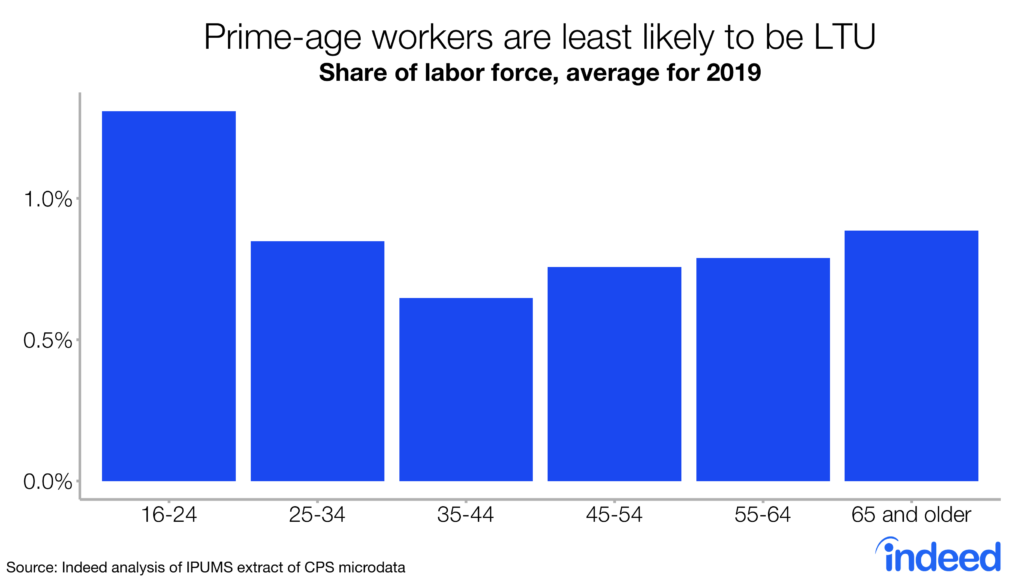
Long-term unemployment is greatest among the youngest and oldest workers in the labor force. Young people between 16 and 24, who are just getting a foothold in the job world, have the highest rate. People 65 or older, nearing the end of their working lives, have the second-highest. Employers may view both groups as unsuitable — younger workers because they haven’t had time to develop needed skills and older workers because their skills may be out of date.
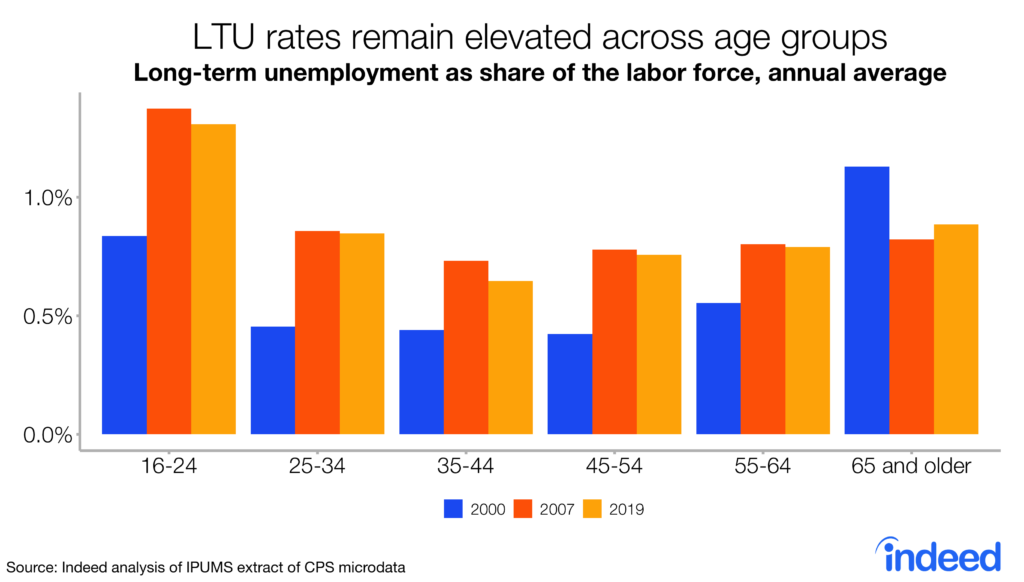
In 2000, it was a different story. Back then, older workers had the highest long-term unemployment rate. However, youth long-term unemployment rates jumped during the 2001 dot-com recession and have never recovered. By contrast, older workers are the only age group with lower long-term unemployment rates now than two decades ago.
Race
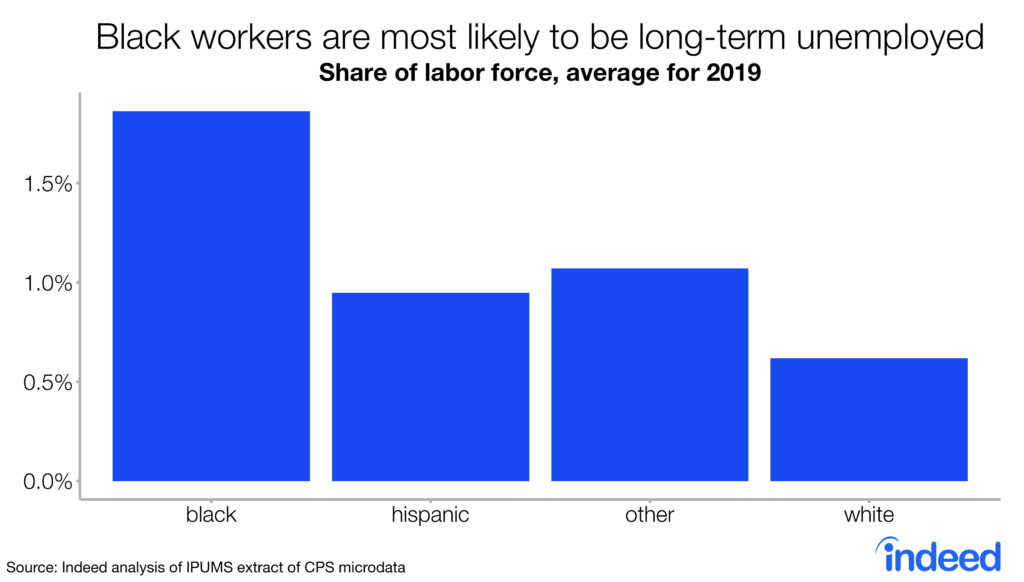
Long-term unemployment is particularly high for black and Hispanic workers, with the black worker rate almost double that for white workers.
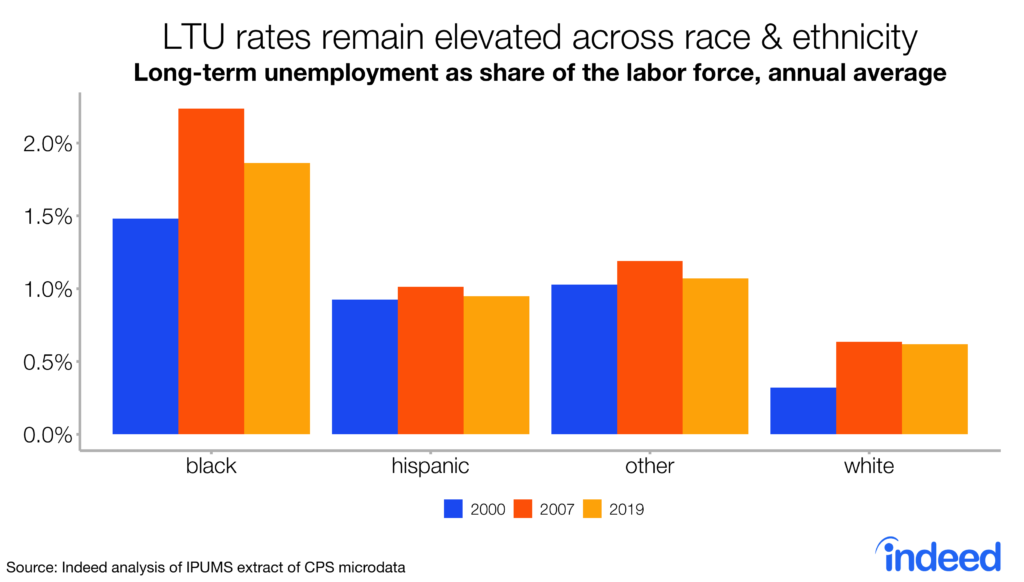
The gap between black workers and white worker rates has narrowed since 2000, but not because long-term joblessness has declined for African-Americans. Rather, the smaller gap reflects higher long-term unemployment rates for whites. Meanwhile, the rate for Hispanic workers is roughly the same as in 2000.
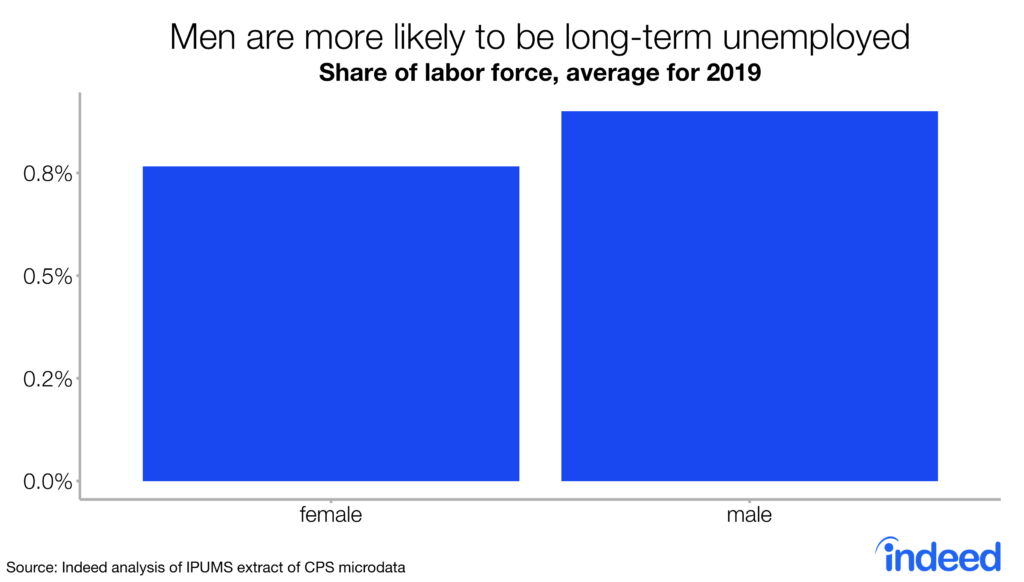
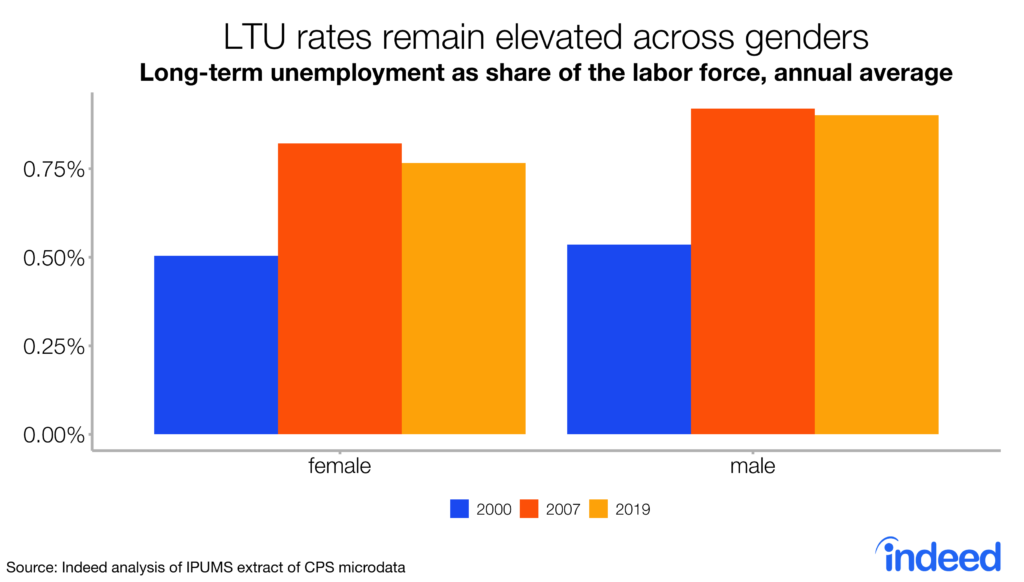
Gender
Long-term unemployment is slightly higher among men than women, probably because men are more likely to work in sectors with falling employment, such as manufacturing, while women are overrepresented in fast-growing sectors such as health care and education. Long-term unemployment rates have risen for both men and women since 2000.
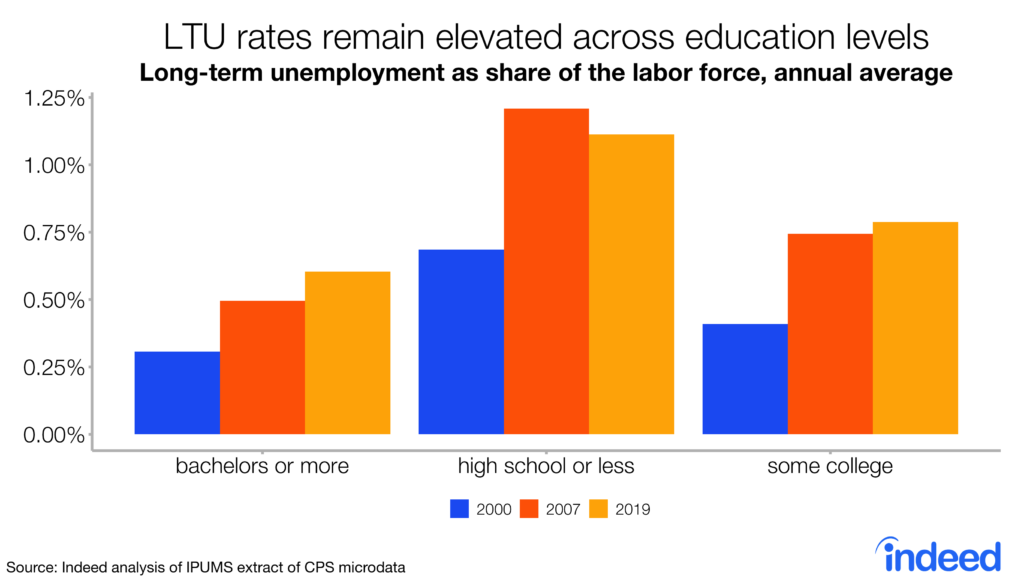
Education
Workers with less education often struggle in the job market and that is reflected in long-term unemployment rates. People with a high school education or less are 84% more likely to be unemployed long-term than those with at least a bachelor’s degree.
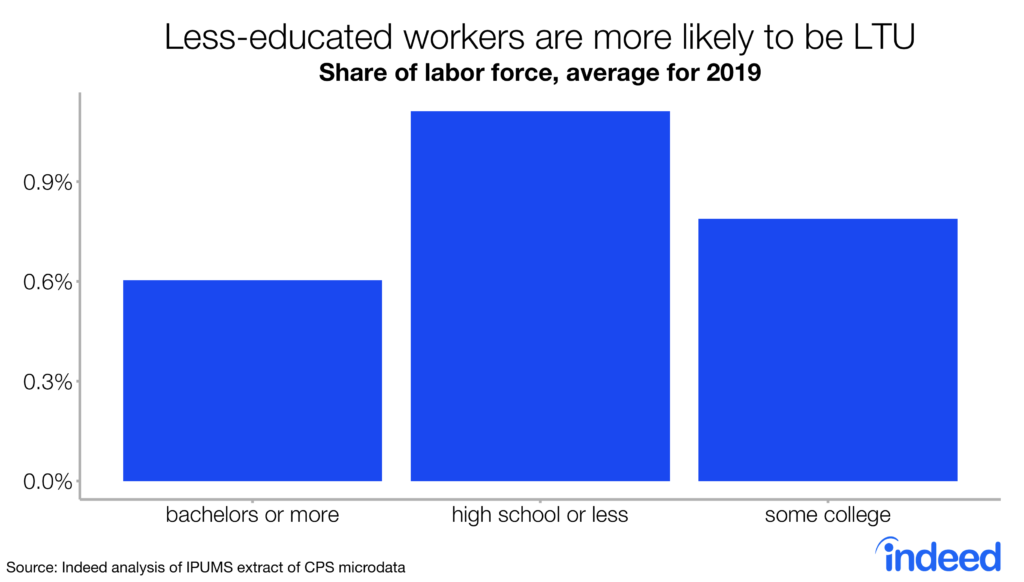
However, rates have risen for all educational levels since 2000, with that of college graduates climbing from 0.3% to 0.6% in 2019, evidence that the increase can’t be explained by employer preference for workers with more education.
Disadvantages of age, race, ethnicity, gender, and education are often mutually reinforcing. Younger and older black and Hispanic workers have the highest long-term unemployment rates of any demographic groups. And the rise in long-term joblessness has been especially steep for less-educated black and Hispanic workers. Among white workers, those with less education have posted the biggest increases in long-term unemployment rates.
Why did long-term unemployment increase while the job market strengthened?
The rise in long-term unemployment is a puzzle. Since the Great Recession of 2007-09, the job market has come roaring back, but long-term joblessness hasn’t budged much and remains substantially higher than two decades ago. Some economists believe the economy has experienced a long-term term decline in demand for workers, which may reflect the combined effects of two recessions and weak recoveries since 2000. Or it may stem from structural changes in the economy caused by technology and increased international trade.
Economists have offered these additional explanations for high long-term joblessness:
- Some workers may have suffered lingering effects from unemployment, a phenomenon economists call hysteresis. They may have lost skills or failed to keep up with changing work methods. Their skill sets may no longer be in demand or they may simply have lost good work habits.
- The tough time the long-term jobless have getting hired could be a matter of perception rather than a genuine lack of qualifications. Employers may view them differently now than in the past. With the rapid pace of technological change, employers may believe those who have been out of work a long time don’t have today’s essential skills. Or they may think extended unemployment is a red flag signaling a problem that isn’t evident in a resume. Research has found that employers are less likely to call back applicants with long periods of unemployment than candidates with otherwise similar resumes.
- The job market recovery may simply not have been as strong as today’s low unemployment rate suggests. A number of measures indicate the market is only now returning to the level of health that prevailed before the Great Recession. For example, like the long-term unemployment rate, the share of people of prime working age holding a job has just recently gotten back to pre-recession levels and is still below where it was in 2000.
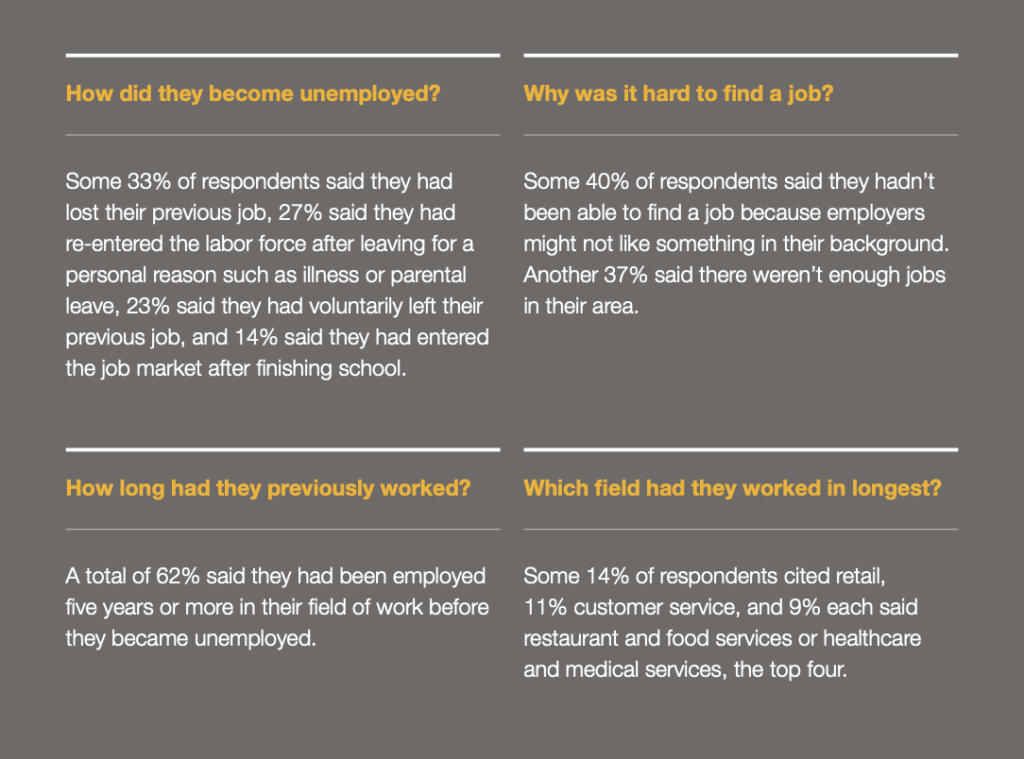
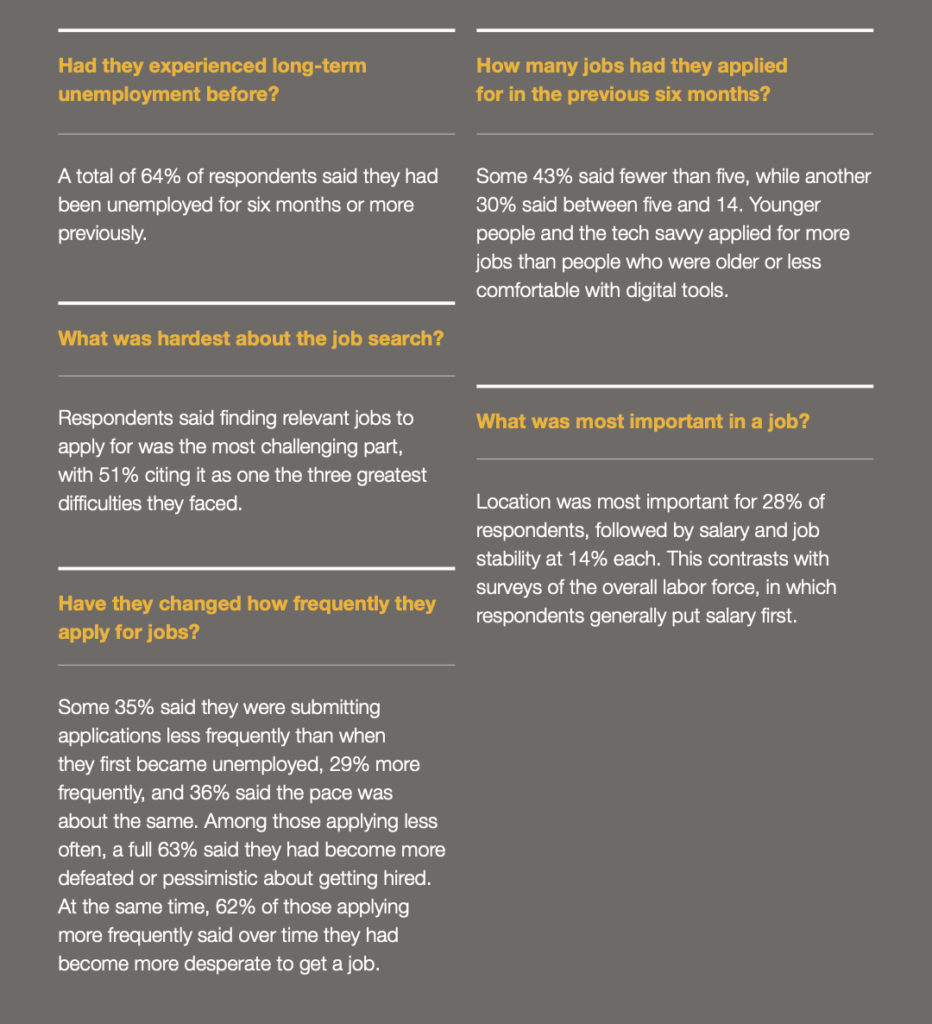
What the long-term unemployed say: An Indeed survey
To better understand long-term unemployment, Indeed surveyed 1,280 people across the country who were out of work for more than six months and actively looking for a job. We collected basic demographic data on age, ethnicity, gender, and education, as well as work histories, job search techniques, tech-savviness, and other revealing information. We also probed their attitudes about trying to get hired. The result is a unique picture of life on the fringes of the job market and insights into why some people remain jobless for so long.
What the survey reveals about barriers to work
Indeed asked survey participants about the personal circumstances, experiences, or characteristics that kept them unemployed. Some 55% said they faced a barrier that made it hard to get a job. But when we showed them a list of possible barriers to employment, 91% said at least one applied to them, 74% stated they faced two or more barriers, while nearly half indicated three or more.
Indeed list of traits and experiences that may be barriers to employment
- I have been unemployed for 6+ months at a previous point in my life/career
- I have little or no professional experience
- I don’t have reliable transportation
- I have a physical or mental disability
- I have a nontraditional experience or background
- I have changed jobs frequently in the past
- I belong to a minority group in terms of my race, religion, color, or national origin
- I have a criminal record
- I am a parent without a support network (i.e., single parent, no access to childcare, etc.)
- I am a veteran
- English is not my first language
- I am currently pregnant
- None of these
The most common barriers to employment were age, cited by 40% of respondents, previous periods of unemployment, mentioned by 38%, and lack of professional experience, named by 25%, followed by lack of reliable transportation, and education level. Asked which was the most important barrier, 22% pointed to age and 15% each to lack of professional experience or previous periods of unemployment. In addition, 7% said a criminal record made it hard to get work.
Conclusion
It sometimes happens that long-term unemployment becomes habitual, eroding skills and familiarity with the world of work. Nonetheless, the ranks of the long-term unemployed include hundreds of thousands who are eager to jump back into the workforce, people with the potential to be hard-working, dedicated employees. Because of irrational prejudices, they are often overlooked. It is time for employers to make sure they are not passing over potential workers just because of long jobless spells. To do so is an opportunity lost. Applicants should be evaluated based on their individual merits and not be penalized for a run of hard luck.