
The strengthening US labor market certainly has not left the summer worker behind. This year the labor market has seen a steady stream of job creation and unemployment is at its lowest rate in nearly two decades. With all of this, one may expect that employers are finding themselves in need of summer help—and lots of it.
Using Indeed job search and postings data, we can measure employer and job seeker demand for summer jobs. We found demand for summer workers has risen sharply, and that increase has been met with enthusiasm from job seekers. The most common summer listings are for jobs that are synonymous with summer, such as camp counselor and pool manager. But we found that the metro areas with the highest percentage of summer job listings are in places normally associated with colder weather, such as Minneapolis, Grand Rapids and Boston.
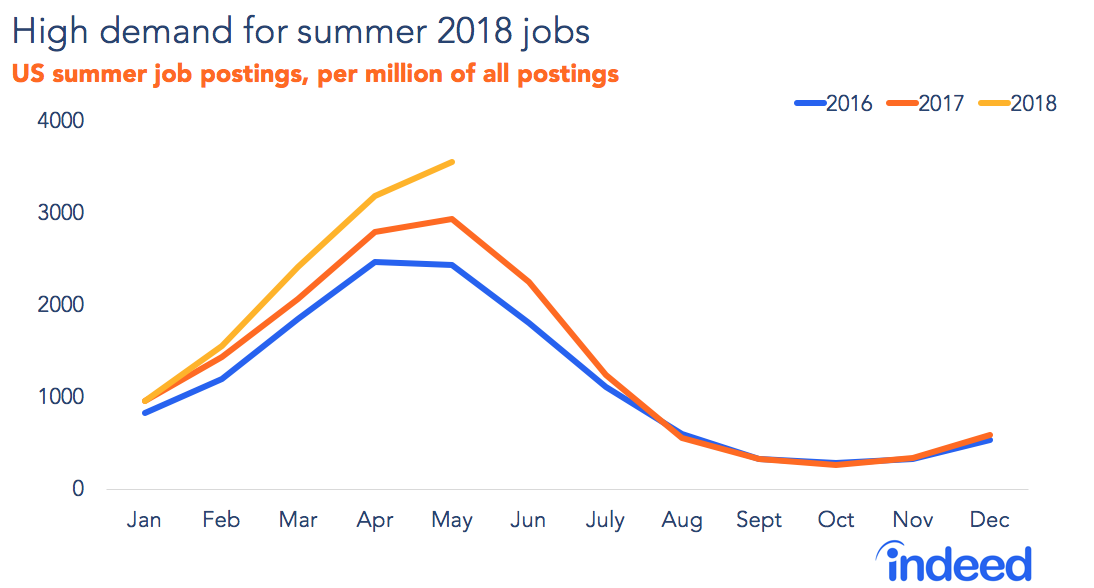
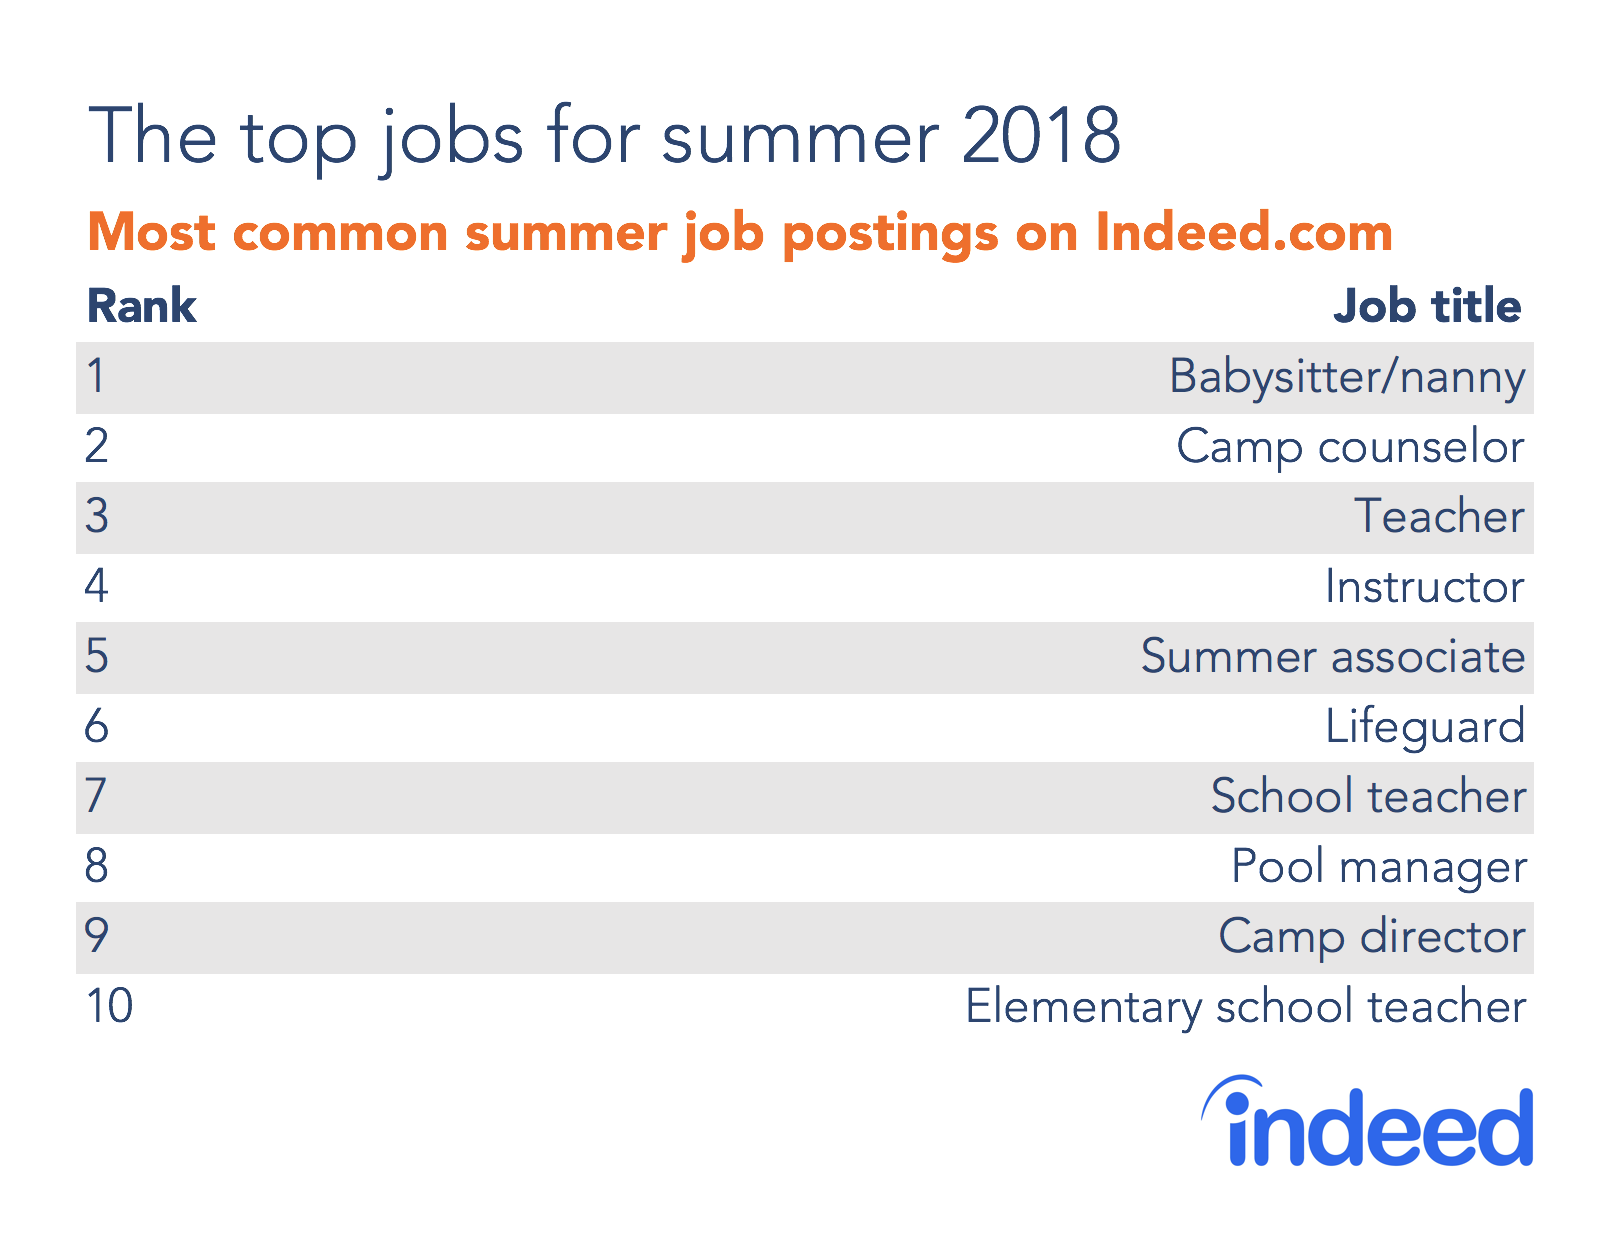
In May, summer job postings, measured as a share of all job postings on Indeed, were 17% higher than the peak of the previous year. The most common summer job postings are the classic summer jobs that one would expect, such as babysitters, camp counselors, and lifeguards. Whether May will again be the peak month for summer job postings remains to be seen, but the previous trends point to the summer job postings level dipping in June.
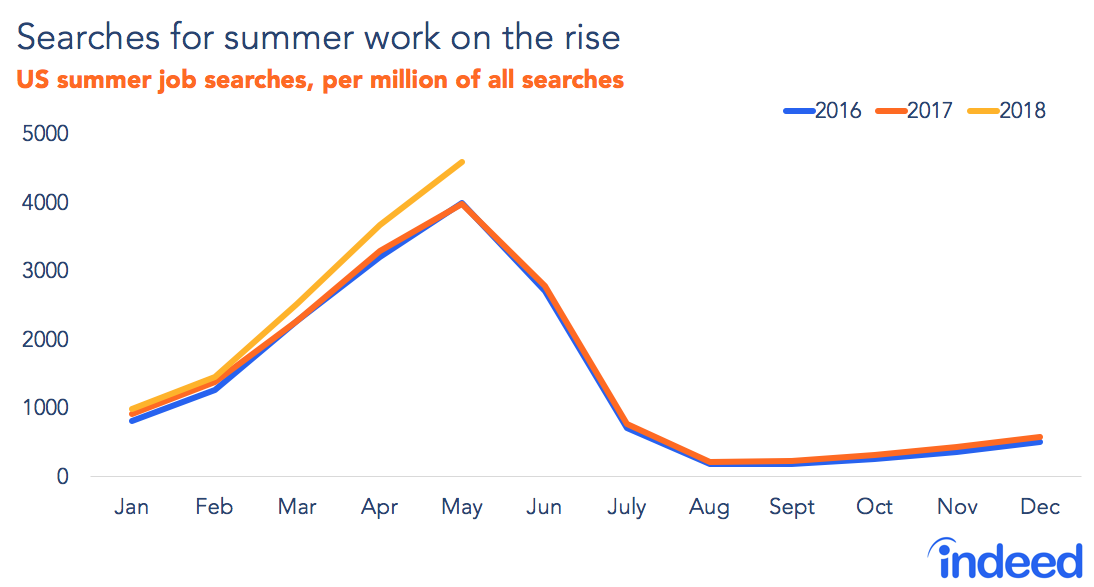
Searches for summer jobs heating up
On the job seeker side, we are seeing strong demand for summer employment, as well, Searches for summer jobs, measured as a share of all searches on Indeed, registered at 14% higher than the peak in May of last year. However, recent years have shown that job seekers quickly lose interest in summer work once summer officially begins. The May peak in searches is much more pronounced than that of postings, with a sharp run-up in the spring and a precipitous drop in June.
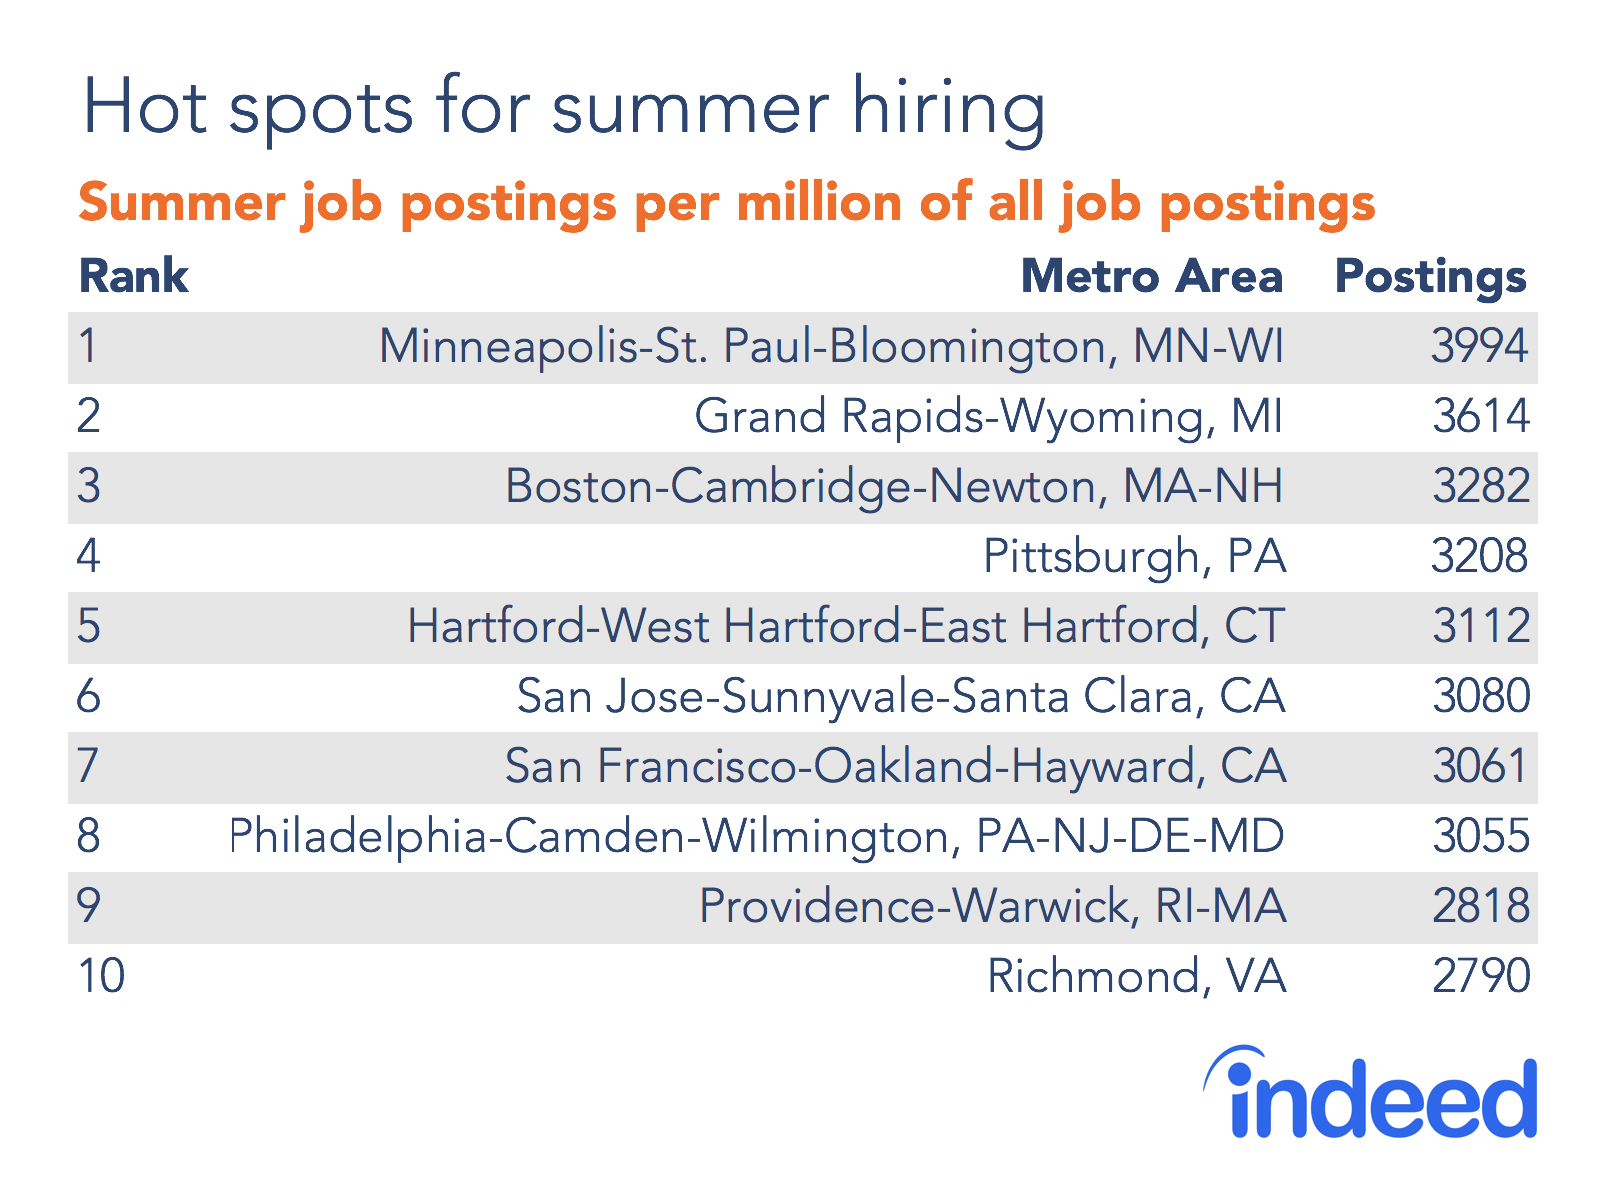
Hot spots for summer hiring
Summer hiring is particularly hot in places with big seasonal changes. In fact, the top three metros with the highest share of summer job postings are in places normally associated with colder weather, including the Minneapolis- St. Paul metro area, Grand Rapids, Michigan and the Boston metro. Many of the metro areas on our top 10 list have large student populations—and employers in those regions likely hope they will stick around for summer employment.
Methodology
For this analysis, we categorized a job posting or search as pertaining to summer jobs if it contained the word “summer” in the job title or search. We excluded summer internships from our postings data because of notable differences in what types of work they were for, when and where they were posted, and when people searched for them. We believed combining the two types of summer work would muddle the results. Searches and postings data for May of 2018 runs only through mid-month, but remains comparable to data from the previous year as these are measured as shares. Only the 50 metro areas with most total job postings are included in the metro area analysis.