In recent years, the short-term view of the labor market has looked rosier than the longer-term prognosis. With more than seven years of payroll expansion and falling unemployment, the immediate future looks bright, while automation and the demographic slowdown are somewhat more distant worries.
However, President Trump’s proposal to impose tariffs on steel and aluminum imports has injected some uncertainty into the short-term view of the labor market. What could happen? Import tariffs help domestic producers of steel and aluminum, who would face less competition from foreign producers and might therefore boost output and hire more workers. But industries that use steel or aluminum—like manufacturers of machinery, cars, and electrical equipment—would pay more for those inputs and could cut production and jobs. In short: employment could rise in metal-producing sectors and fall in metal-consuming sectors—and the metal-consuming sectors employ more than ten times as many workers as metal-producing sectors.
Recent trends in metals-industries employment
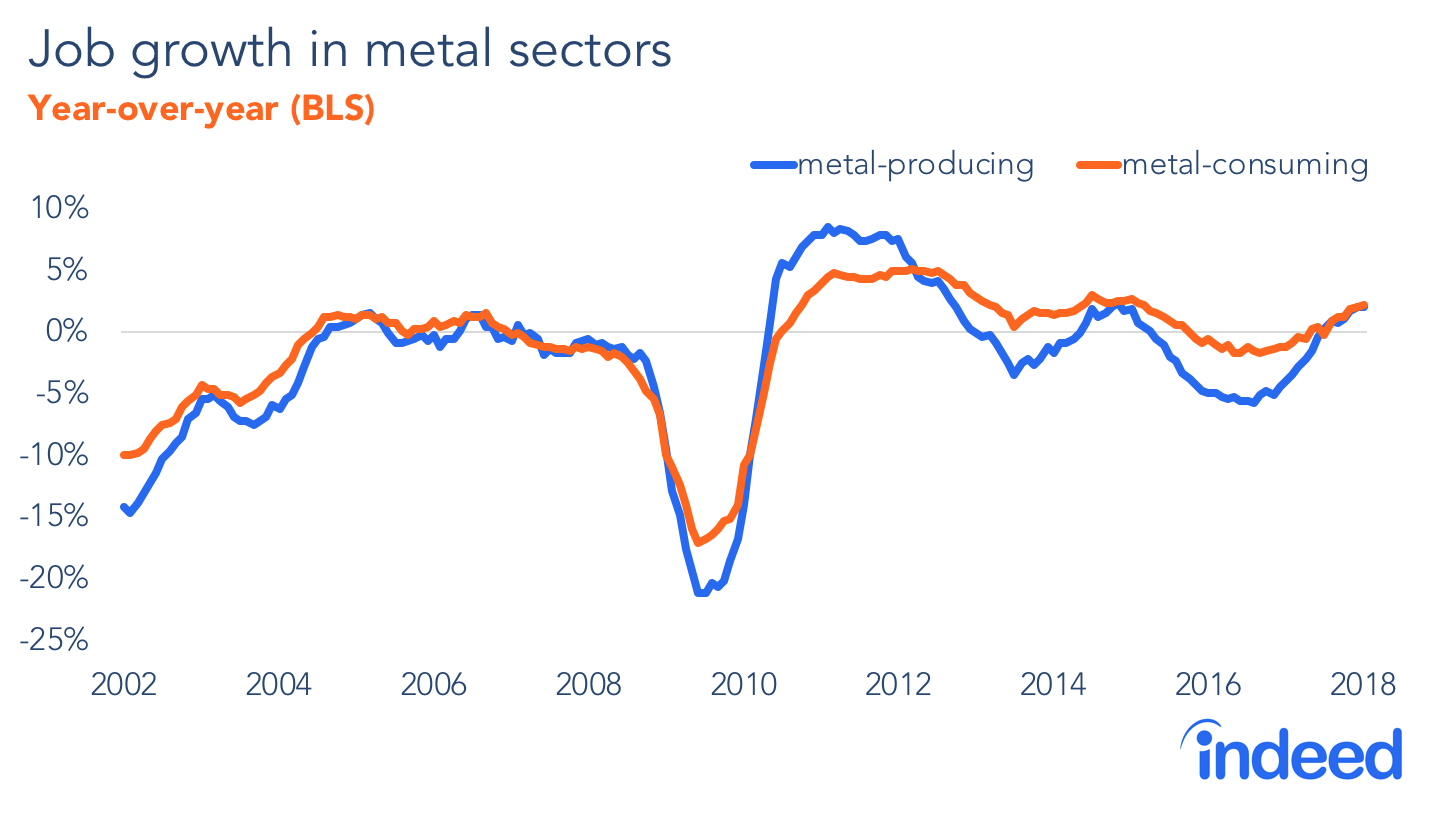
This Friday’s jobs report sets the baseline for measuring the future employment effect of tariffs. At the moment, job growth in metal-producing and metal-consuming sectors is relatively strong. In January 2018, employment rose 2.0% year-over-year in the metal-producing sectors of metal-ore mining and primary metal manufacturing. Growth was 2.2% in the key metal-consuming manufacturing sectors of machinery, fabricated metal products, transportation equipment, and electrical equipment and appliances. (Note that metal-consuming sectors employ 4.6 million people, versus just 415,000 people in metal-producing sectors, as we’ve defined them.) In contrast, job growth economy-wide was 1.5%.
Yet both metal-producing and metal-consuming sectors have suffered longer-term job losses and dramatic volatility, despite recent gains. Since the start of 2001, employment in the metal-producing sectors dropped by 35%, and in metal-consuming sectors by 20%, even as employment economy-wide rose 11%. These job losses are due, in part, to increasing productivity: output per worker rose more last decade in both manufacturing generally and in primary metal manufacturing specifically than in the economy overall.
Watching for the tariff effect
If tariffs are imposed, and we see future job growth in metal-producing industries that benefit from those tariffs, it may be a continuation of the expansion already underway. On the flip side, if we see future job losses in metal-consuming industries, that could just be a return to longer-term labor-saving productivity.
Still, there are two things to watch in future months for the effect of tariffs:
- First: divergence in job growth in metal-producing and metal-consuming sectors. As the above chart shows, job growth in these sectors tends to move together over time, rising and falling in concert. But if tariffs have a strong effect on jobs, it would mean faster growth in metal-producing sectors and slower growth in metal-consuming sectors.
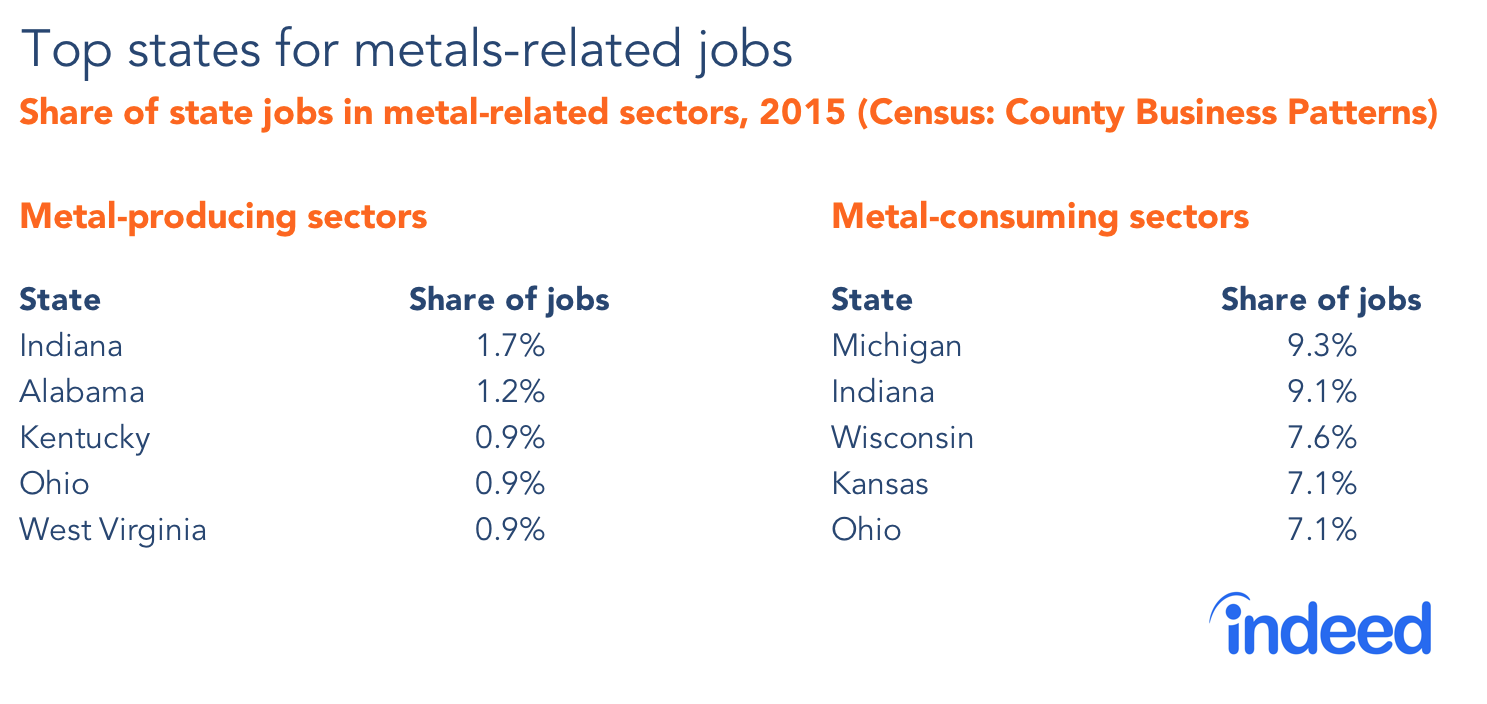
- Second: localized effects where these industries are concentrated. Metal-producing sectors, which would benefit from tariffs, are mostly clustered in Indiana and Alabama. In contrast, metal-consuming sectors are centered in the Midwest, led by Michigan, Indiana, and Wisconsin. To be sure, metal-producing and metal-consuming sectors tend to locate near each other, and most states tend to rank high on both (like Indiana and Ohio) or low on both (like Maryland, Florida, and New Jersey). Still, some states like West Virginia and Pennsylvania should be on the winning side from these tariffs, while states like Michigan, Iowa, Kansas, and Mississippi are likelier to bear more costs than benefits.
Finally, tariffs could also affect employment indirectly in other sectors. Prices could rise for a wide range of consumer goods and other services because nearly every business purchases products containing steel or aluminum, whether in cars, construction materials, or electronics. That could depress business activity or consumer spending, thus hurting jobs. Plus, countries might retaliate with tariffs on other American products, potentially hurting employment in those targeted sectors.
The ultimate effect of tariffs on jobs is hard to quantify. But if the administration imposes the steel and aluminum tariffs they’ve proposed, we’ll be watching for job gains in metal-producing sectors, broader job losses (or at least slower growth) in metal-consuming sectors and other parts of the economy, and concentrated effects in places where metals industries are clustered.
Methodology
For the trend analysis using the BLS Current Employment Statistics, metal-producing industries include NAICS 2122 (metal ore mining) and 331 (primary metal manufacturing), and metal-consuming industries include NAICS 332 (fabricated metal product manufacturing), 333 (machinery manufacturing), 335 (electrical equipment, appliance, and component manufacturing), and 336 (transportation equipment manufacturing). For the geography analysis using Census County Business Patterns, which provides more granularity, metal-producing industries include NAICS 21221 (iron ore mining) and 331 (primary metal manufacturing), and metal-consuming industries include NAICS 332 (fabricated metal product manufacturing), 333 (machinery manufacturing), 335 (electrical equipment, appliance, and component manufacturing), 336 (transportation equipment manufacturing), 3121 (beverage manufacturing), 3262 (rubber product manufacturing), and 3372 (office furniture manufacturing). These industries were selected based on inspection of the BLS national input-output tables.