
Immigration was one of the most contentious issues in the 2016 presidential campaign. President-elect Trump pledged both to deport unauthorized immigrants and to restrict future immigration in order to “put American workers first.” And these promises resonated: support for Trump was stronger in areas with fewer immigrants but larger recent increases in the local immigrant population, and Trump did best among voters who said immigration was their most important issue.
Economists generally find that immigrants have a positive effect on the economy in aggregate and even on the wages and job prospects for most native-born workers. But there’s fierce disagreement about how much native-born workers in similar jobs and with similar skills are hurt by competition with immigrants, particularly in economic downturns. In this blogpost we make no attempt to resolve these complex debates. Instead, we look at the jobs that immigrants do today, with a particular focus on recent immigrants, as a guide to which occupations, workers, employers, and consumers might be most affected — for better or for worse — by future changes to immigration policy.
To identify these jobs, we used the Census’s American Community Survey (ACS), which asks respondents about their employment status, occupation, birthplace, and citizenship, among many other topics. We analyzed the data for all immigrants in the U.S. and then focused on those who have been in the country less than five years. The punchline is that compared with earlier immigrants, recent immigrants are more educated, more likely to come from Asia rather than Latin America, and less likely to work in occupations where they might compete directly with the native-born workers who were most supportive of Trump.
What Are the Occupations With the Most Immigrants
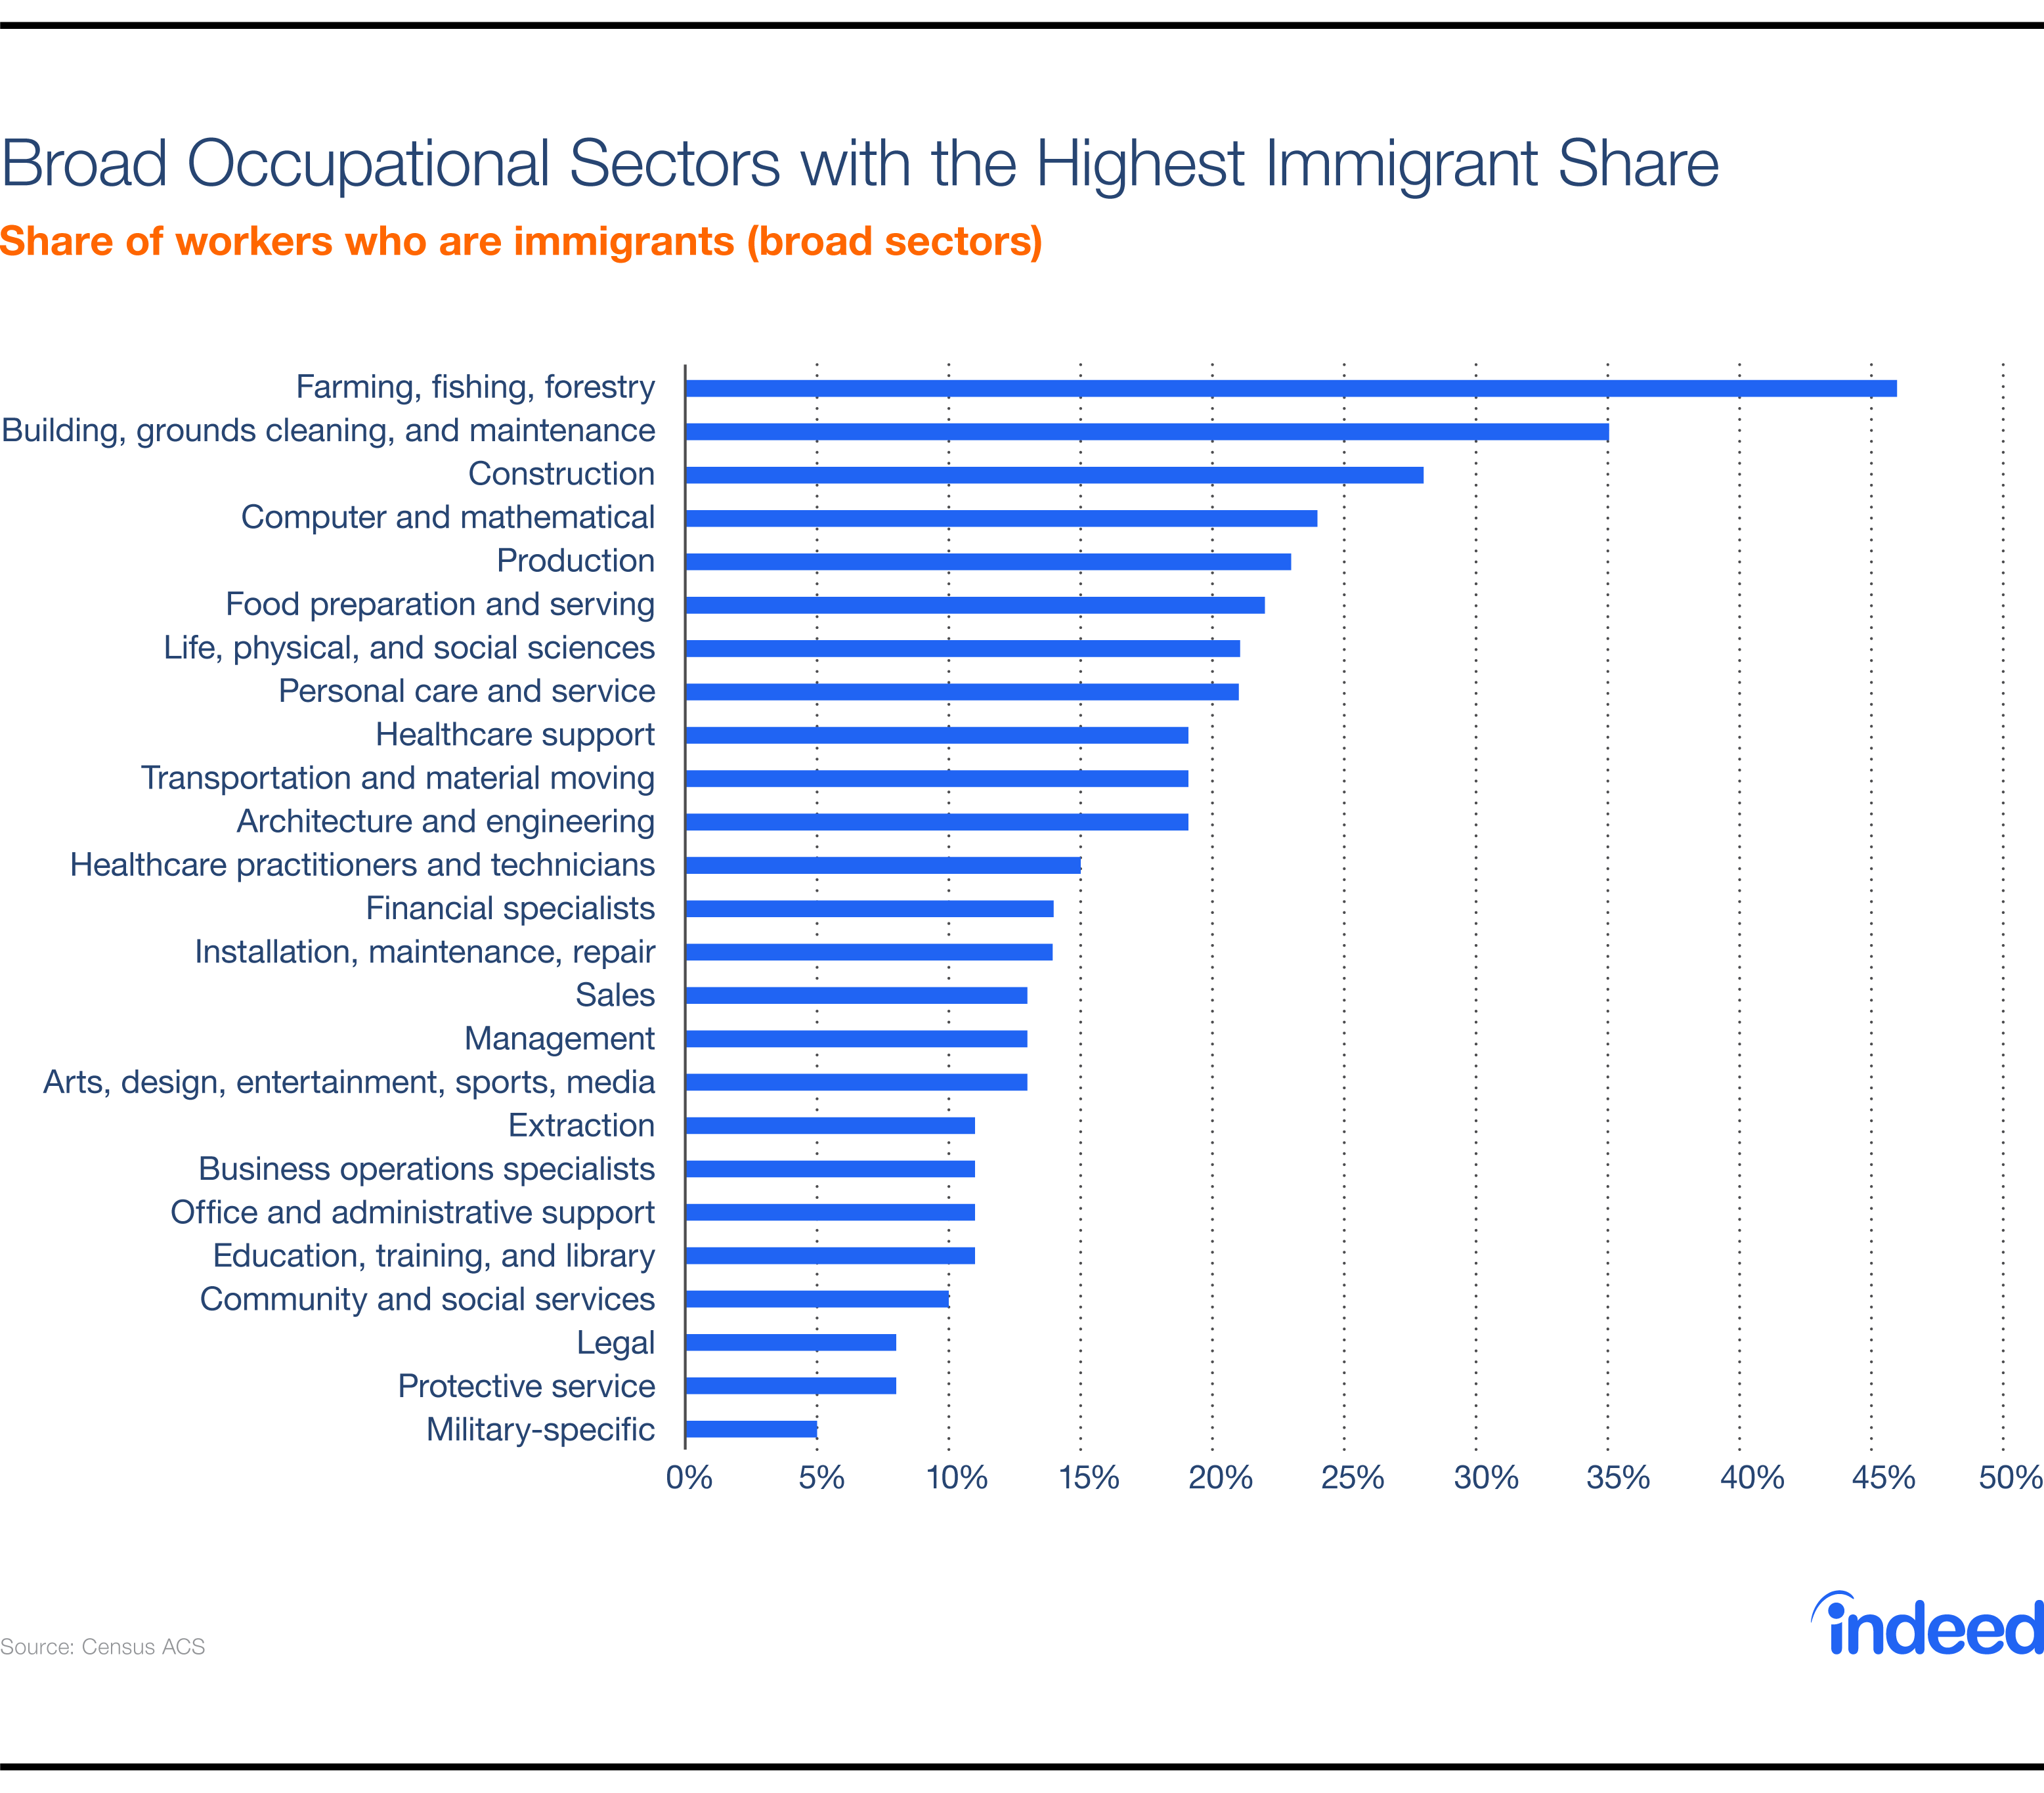
Among broad job sectors, immigrants make up the highest share of farming, forestry, and fishing occupations, accounting for 46% of those who work in those jobs, compared with 17% of the economy overall. Immigrants also constitute 35% of buildings and grounds cleaning and maintenance workers and 28% of construction workers. Therefore, the sectors with the highest share of immigrants tend to be goods-related rather than services-related, though the share of production (that is, manufacturing) jobs held by immigrants is a bit lower at 23%.
Immigrants account for the smallest share of workers in military-specific occupations, protective service jobs (like police and firefighters), legal occupations, and community and social services jobs.
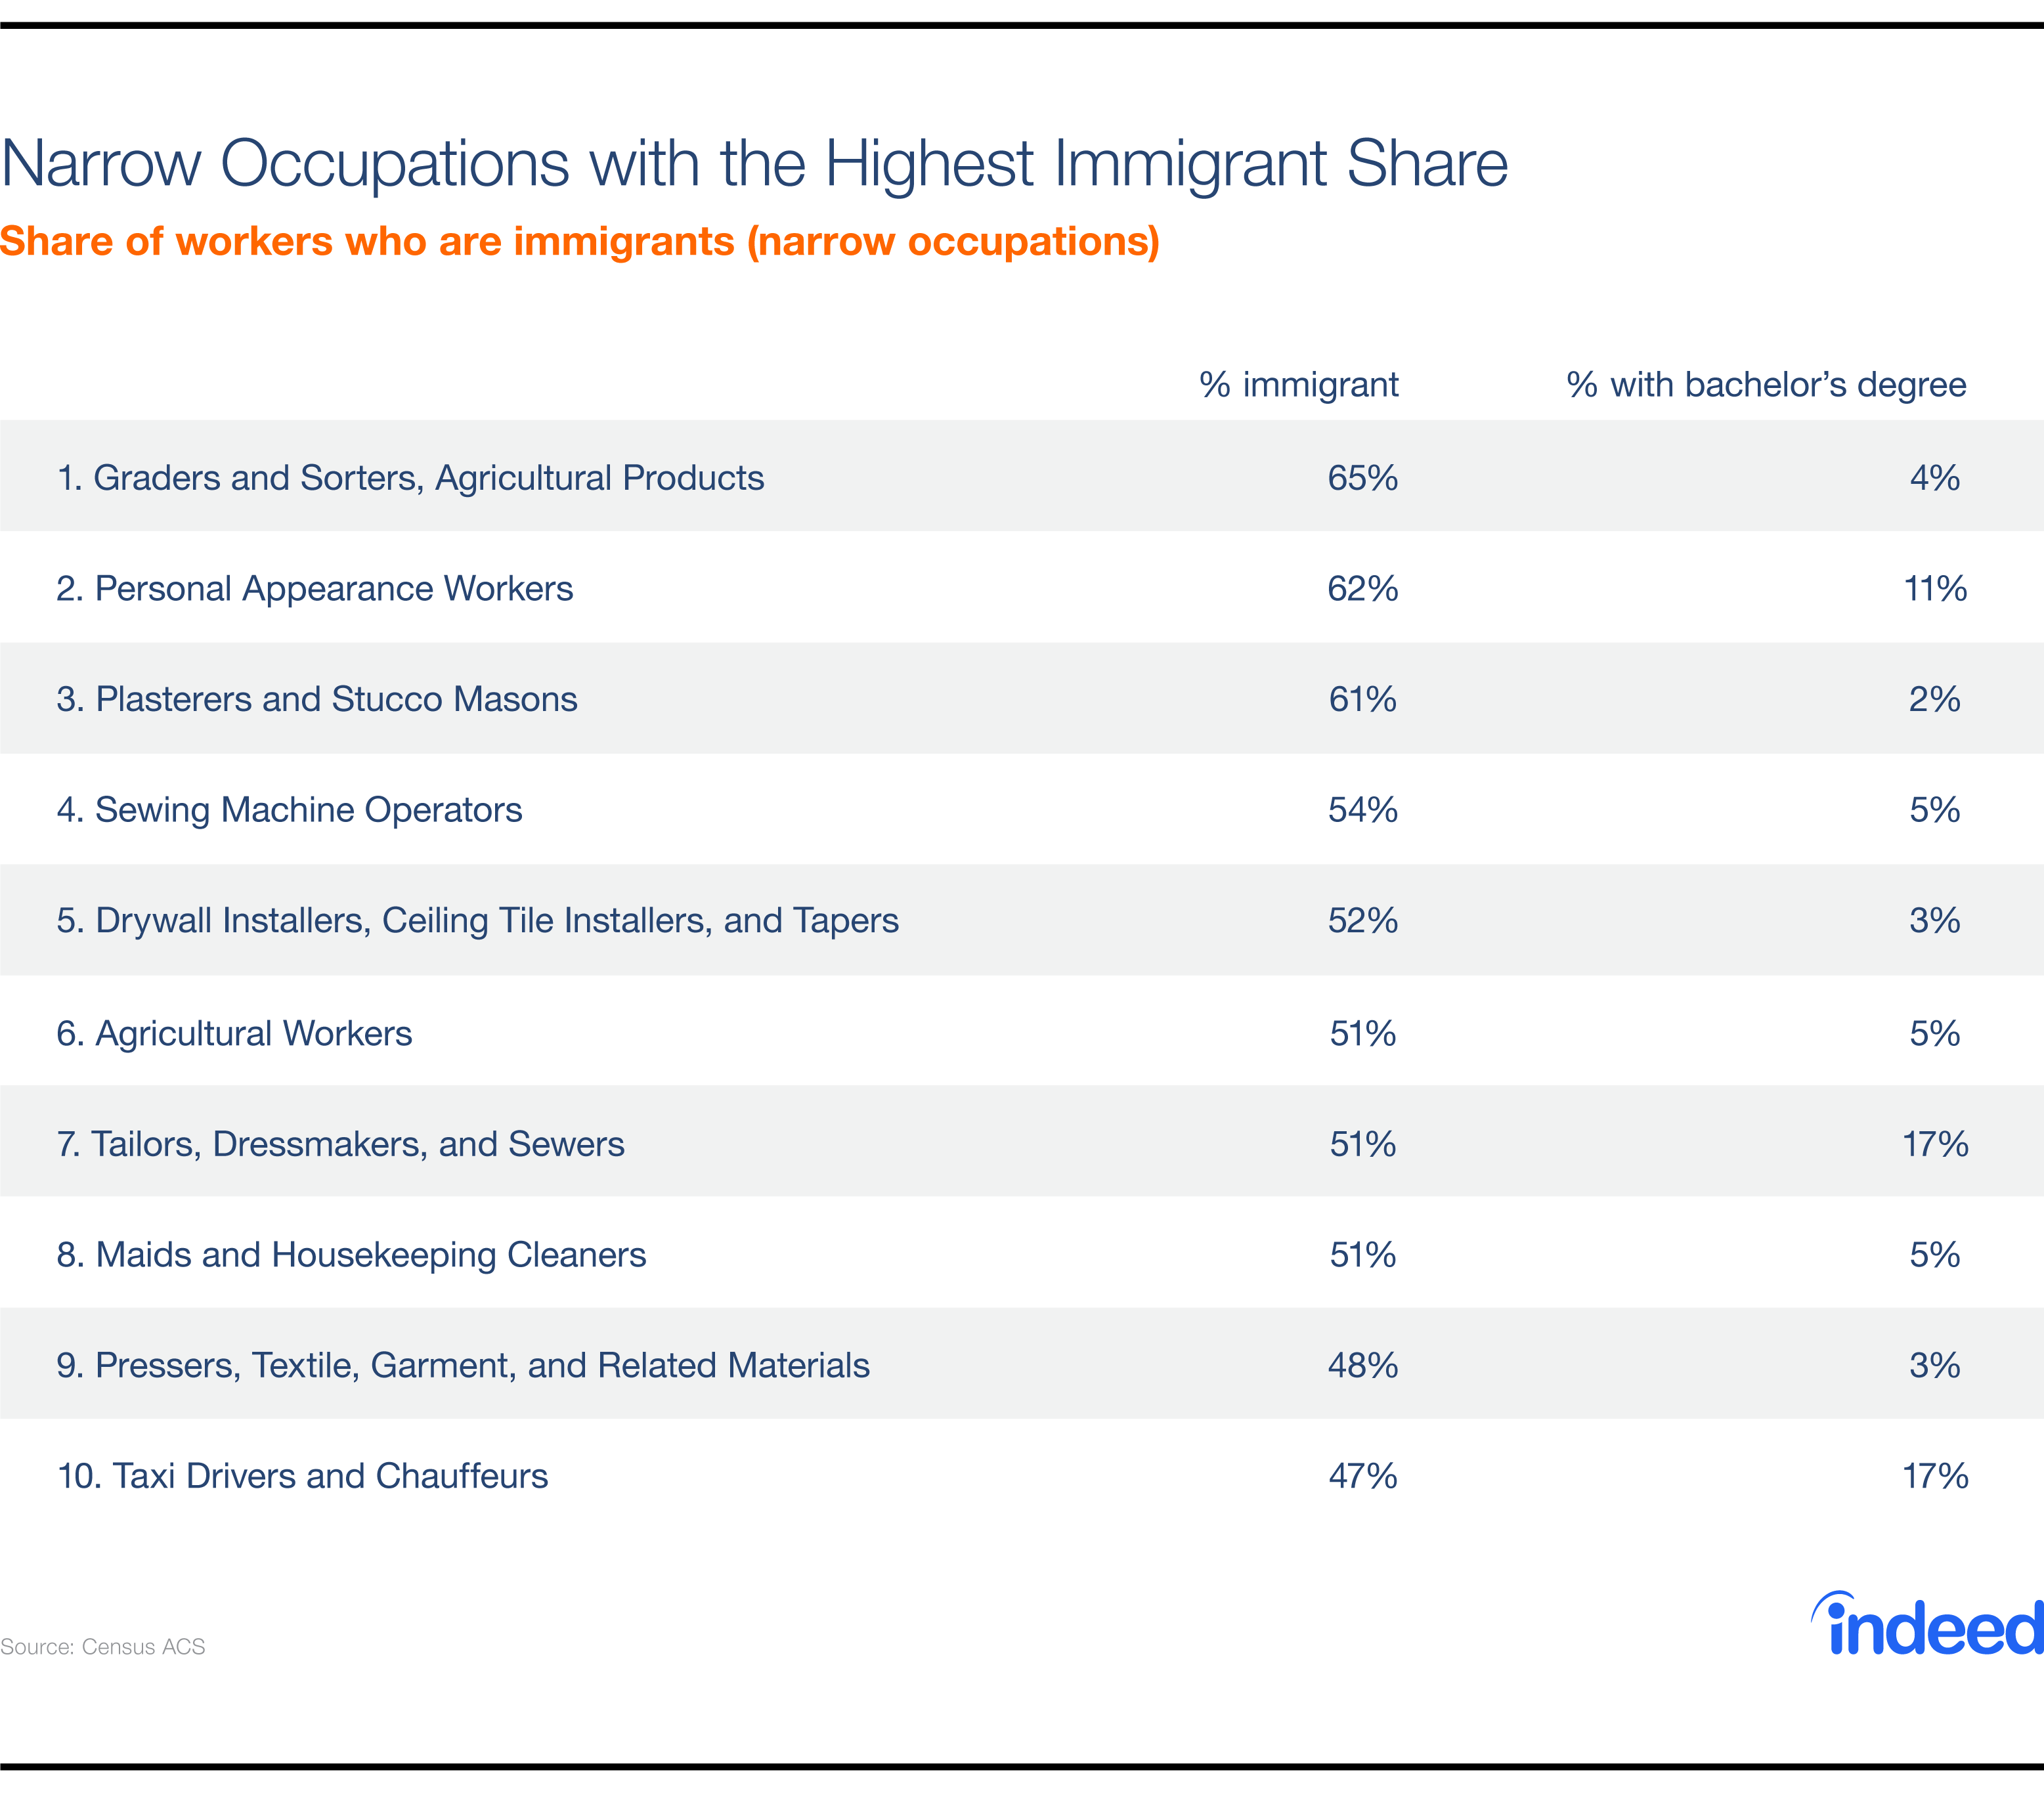
While immigrants do not constitute the majority of workers in any of the broad job sectors, they are the majority in eight specific occupations and account for more than 60% of the workers in three: agricultural product graders and sorters, personal appearance workers (such as manicurists), and plasterers and stucco masons.
All ten of the occupations in which immigrants make up the largest share require relatively little education. These occupations differ, however, in whether they’re held by men or women. Personal appearance workers and maids and housecleaners are overwhelmingly women; plasterer and drywall installers are nearly all men. Notably, while manufacturing jobs in the US are mostly held by men, immigrants who work in manufacturing are disproportionately likely to be employed in jobs that are majority female, including in apparel-related industries.
How Recent Immigrants Are Different
Immigrants who have come to the U.S. in recent years differ in important ways from earlier arrivals.
First, they come from different countries: among all immigrants in the U.S. today, half were born in Latin America, including the 27% who were born in Mexico. But among those who came to the U.S. in the past five years, only one-third were born in Latin America, and 12% in Mexico. Immigrants are increasingly coming from Asia: 45% of recent immigrants were born there (especially India, China, and the Philippines), compared with 30% of all immigrants. (These figures refer to adults age 25 and older, surveyed in 2015.)
Even more striking — and important for the job market — recent immigrants are much more likely to have a bachelor’s degree than earlier immigrants. Among immigrants age 25 and older residing in the U.S. in 2015, 48% of those who arrived after 2010 have a bachelor’s degree, versus 35% of those who arrived between 2006 and 2010 and 27% of those who arrived in 2005 or earlier. By comparison, 31% of native-born adults have a bachelor’s degree.
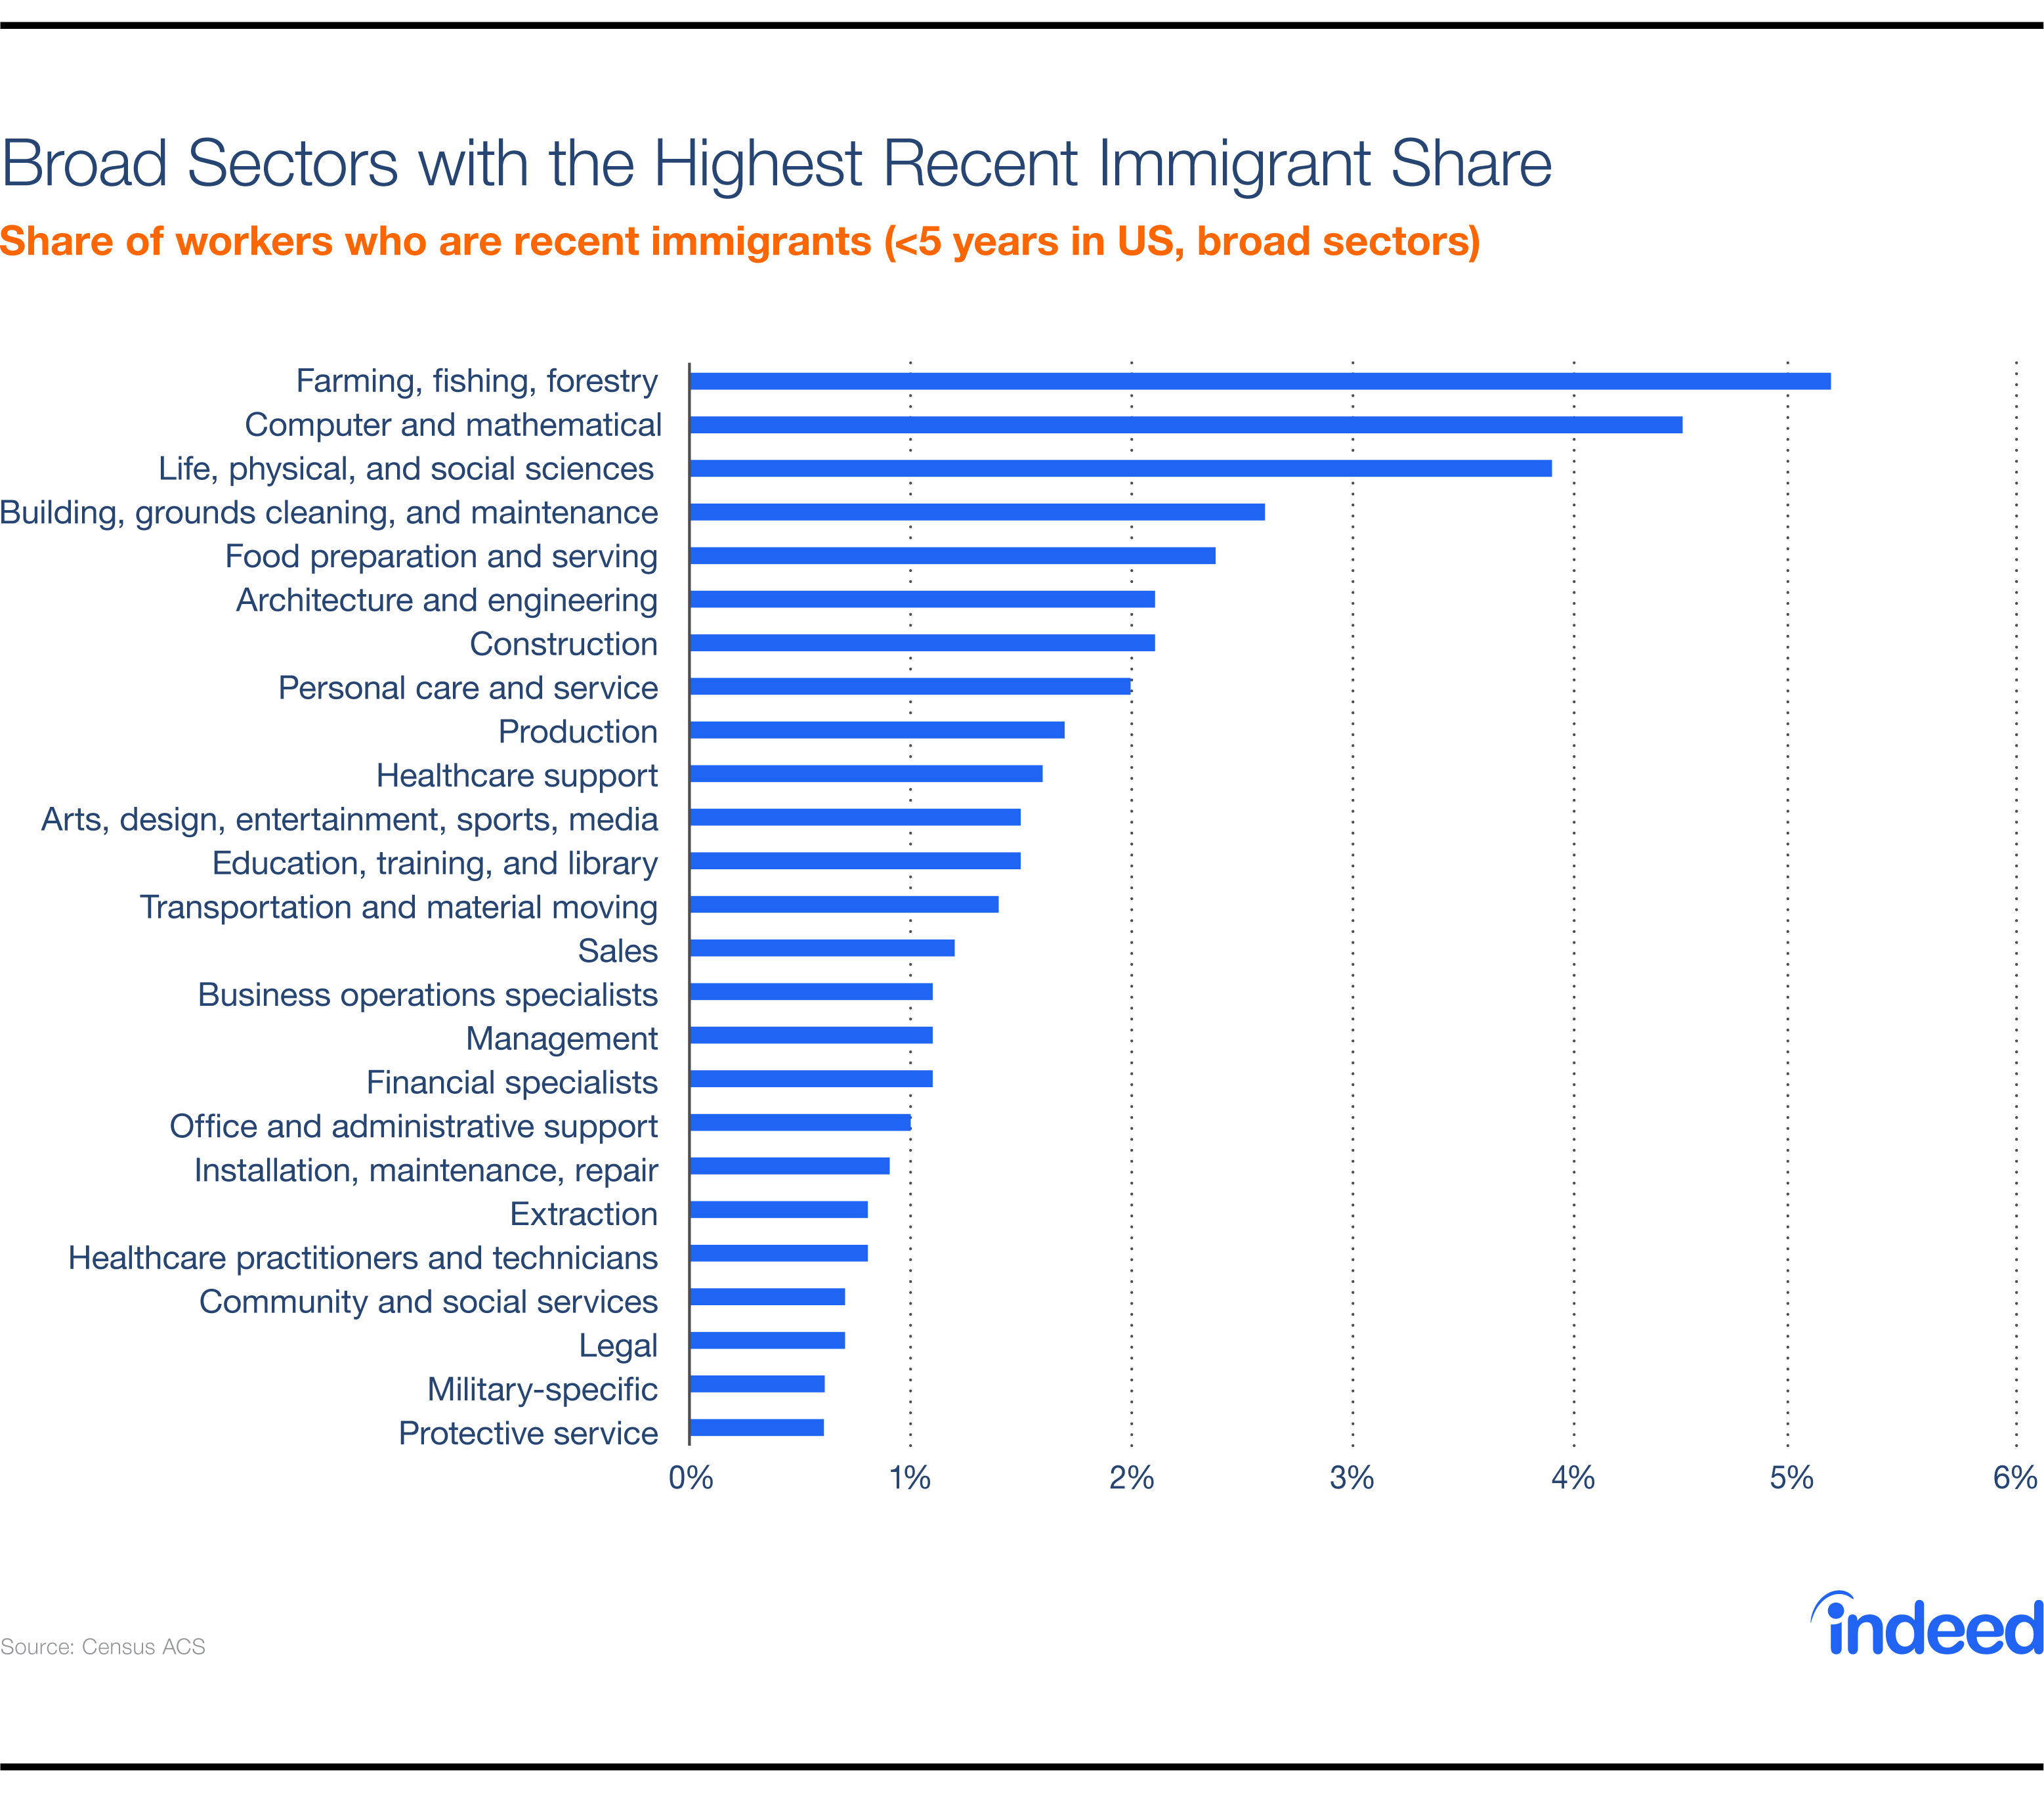
These demographic differences translate to occupational differences. The broad sectors and narrow occupations with the highest shares of recent immigrants look quite different than those with the highest shares of immigrants overall.
Among broad sectors, farming, forestry, and fishing remains on top. But the next two sectors where immigrants account for the highest share of workers are computer and mathematical occupations and life, physical, and social sciences.
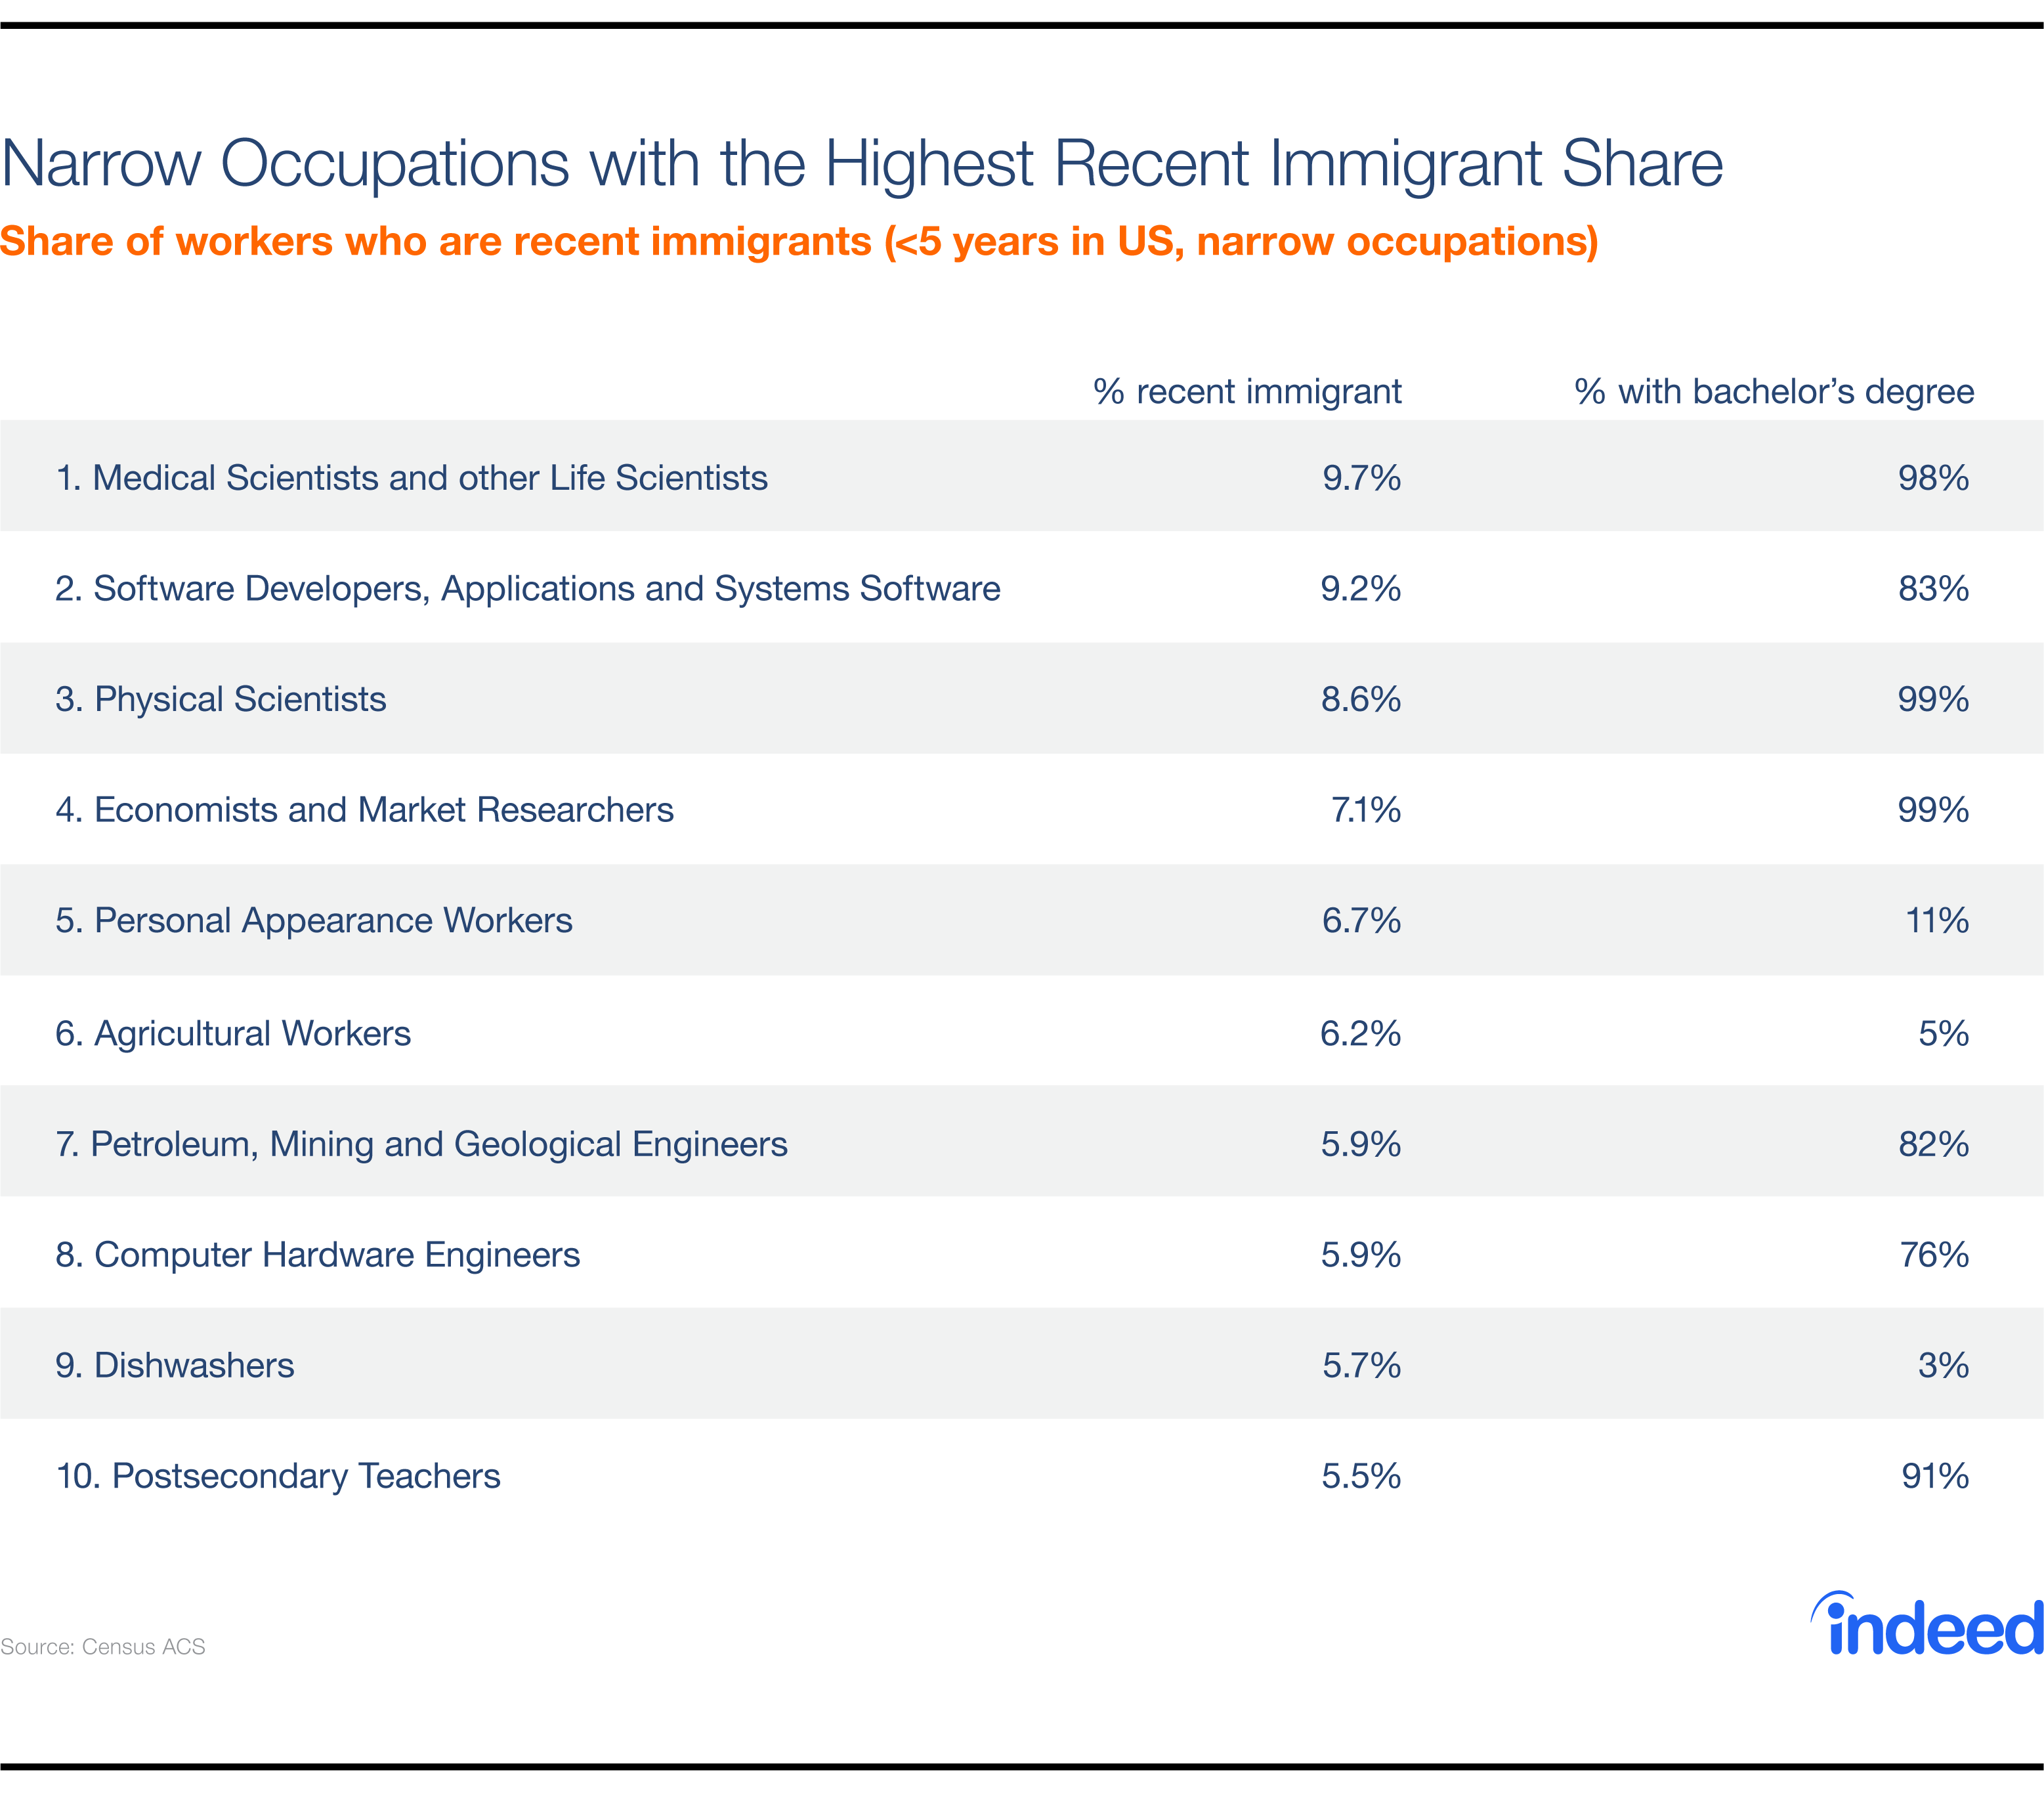
Among specific occupations, the four in which recent immigrants are most prevalent are all professional or technical jobs: medical scientists, software developers, physical scientists, and economists. In seven of the top ten jobs with the highest share of recent immigrants, the vast majority of workers have a bachelor’s degree, compared with none of the ten jobs with the highest share of immigrants overall (as shown above).
Immigration and the labor market
Recent immigrants are more educated, come from different parts of the world, and are more likely to work in professional and technical occupations than earlier immigrants. The characteristics and occupations of recent immigrants are an important guide to the potential effects of future changes to immigration policy: all else being equal, immigrants in 2017 will look more like those who came to the U.S. in 2016 than those who came in — for instance — 2002 or 1986. (The most recent immigrants, however, are not necessarily those most likely to be unauthorized and therefore affected by changes to deportation policies, though they could be directly affected by changes to H1-B visa rules).
These shifts could have important implications for immigration policy and politics in the U.S. First, recent immigrants are less likely than earlier immigrants to be competing (or, at least, to be perceived as competing) for jobs with those who were among the strongest Trump supporters — native-born white men with a high school degree or less (see note). Many residential construction trades — like plasterers, roofers, and carpet and tile installers — have high shares of both immigrants and native-born working-class white men, but these are the types of occupations that rank lower for more recent immigrants. Looking across all occupations, the correlation between the share of immigrants and the share of native-born working-class white men is positive and statistically significant, but this correlation effectively disappears when including only recent immigrants.
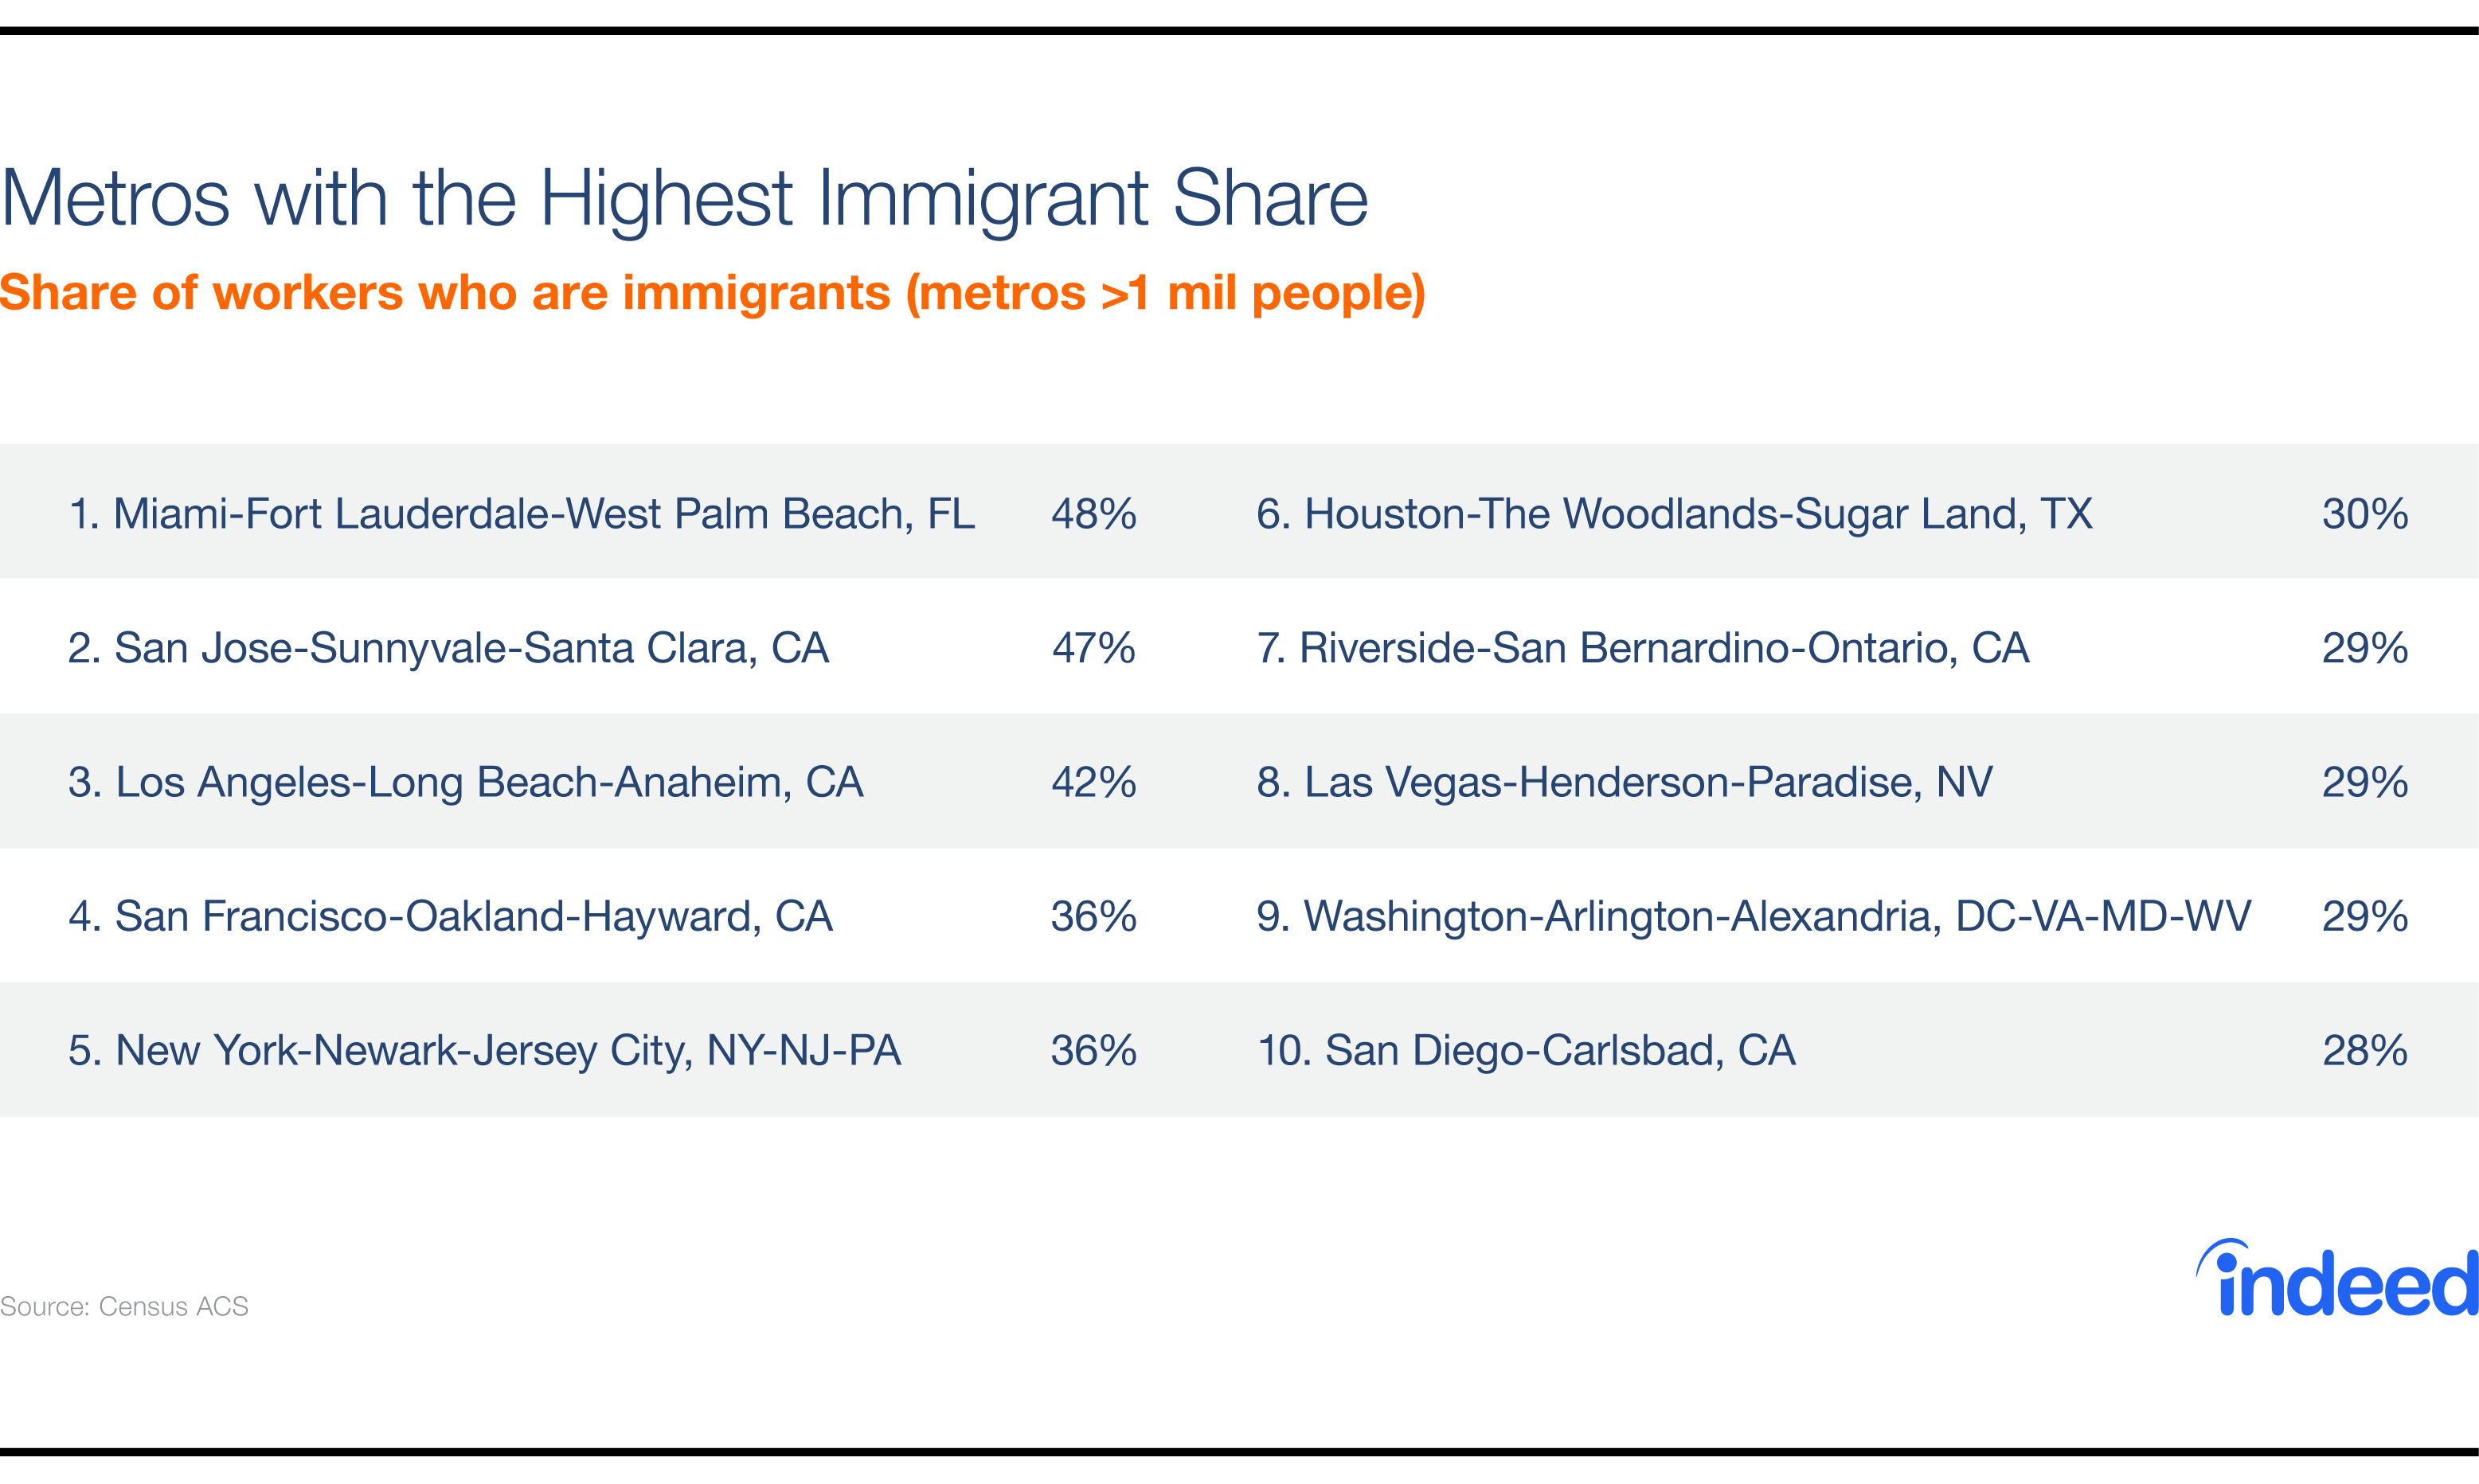
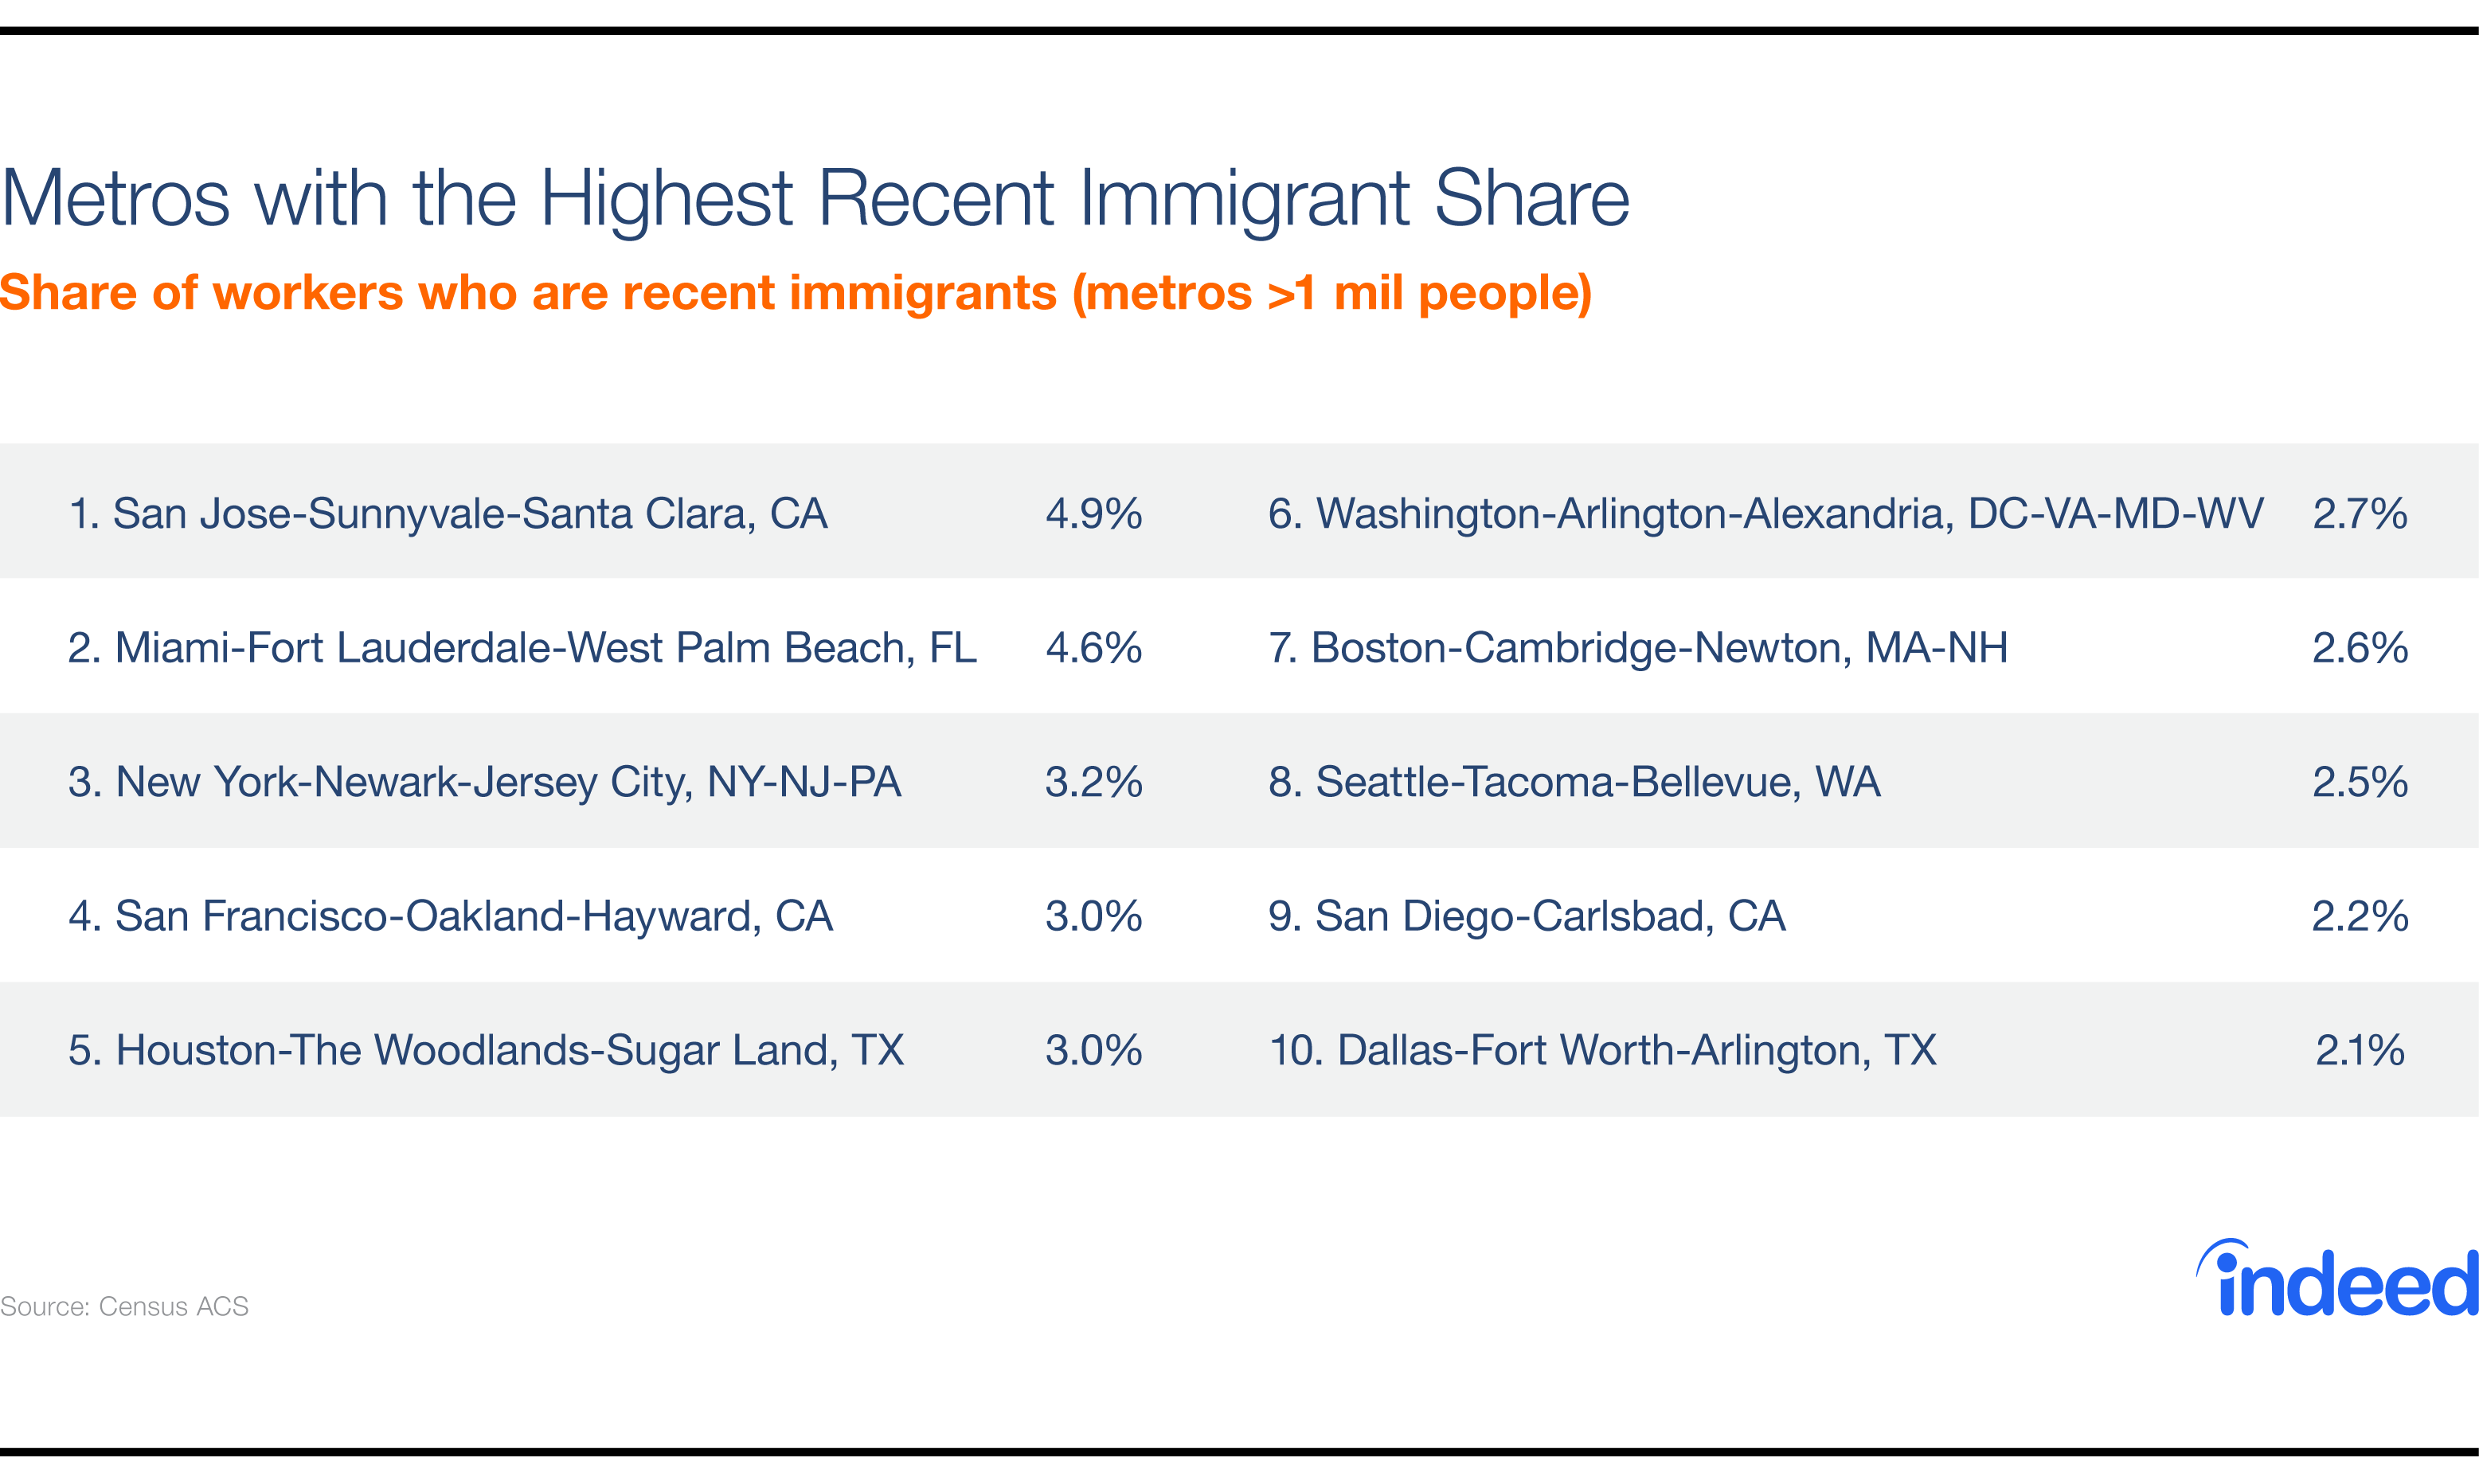
Second, recent immigrants are settling in different metros than earlier immigrants did. Whereas Miami has a higher share of immigrants overall than any other large metro, San Jose is tops (Miami is #2) for recent immigrants. Three of the top ten metros for immigrants overall — Los Angeles, Riverside – San Bernardino, and Las Vegas — are not among the top spots for recent immigrants: Boston, Seattle, and Dallas have taken their place. More recent immigrants, therefore, are likely to live in more expensive metros that offer more professional jobs than earlier immigrants did.
These changes in who immigrants are, where they live, and what they do will affect the politics of immigration in the new Trump administration. The employers who oppose restrictions on new immigrants will increasingly come from technical industries and research organizations. Some workers might feel less personally threatened by immigration than in the past, while others might feel more so. With immigration a top priority for the new administration and Congress, it should soon start to become clearer how policy changes will affect the work that immigrants do.
-
See note at end of post on definitions and methodology.
-
A similar trend is clear from the time series.
-
The correlation between the all-immigrants share and the native-born working-class white men share is 0.31, statistically significant at the 1% level. The correlation between recent immigrants and native-born working-class white men is 0.07, which is not significant even at the 10% level.
Methodology
Data are from the 2013, 2014, and 2015 American Community Survey (ACS) unless otherwise noted, downloaded from IPUMS-USA, University of Minnesota, www.ipums.org. Occupations are based on the normalized OCC2010 variable.
We define immigrants as people born outside the U.S. (excluding those born to American parents). Immigrants include both naturalized citizens and non-citizens. The Census does not ask whether non-citizen immigrants are authorized to be in the U.S., but most unauthorized immigrants are believed to be reflected in the ACS data. The most careful estimates suggest that the latest ACS surveys undercount unauthorized immigrants by only 5-7%. The share of unauthorized immigrants in the workforce peaked in 2009 and has declined slightly since then.
“Recent immigrants” are those who moved to the U.S. less than five years before the year that the respondent was surveyed.
The share of workers who are native-born white working-class men was calculated using only native-born workers as the denominator. For this analysis, working class included those whose educational attainment was no more than a high-school degree.