
Key points:
- Job postings have continued to gradually decline, having seen a lacklustre seasonal rebound in January.
- Wage growth has fallen back as the labour market has loosened further.
- Redundancy notifications have edged higher, but still few signs of impending widespread job losses.
Our Labour Market Updates examine important trends using Indeed and other labour market data. Our European Labour Market Overview chartbook provides a more comprehensive view of the European labour market. Other data, including the Indeed Wage Tracker, is regularly updated and can be accessed on our data portal.
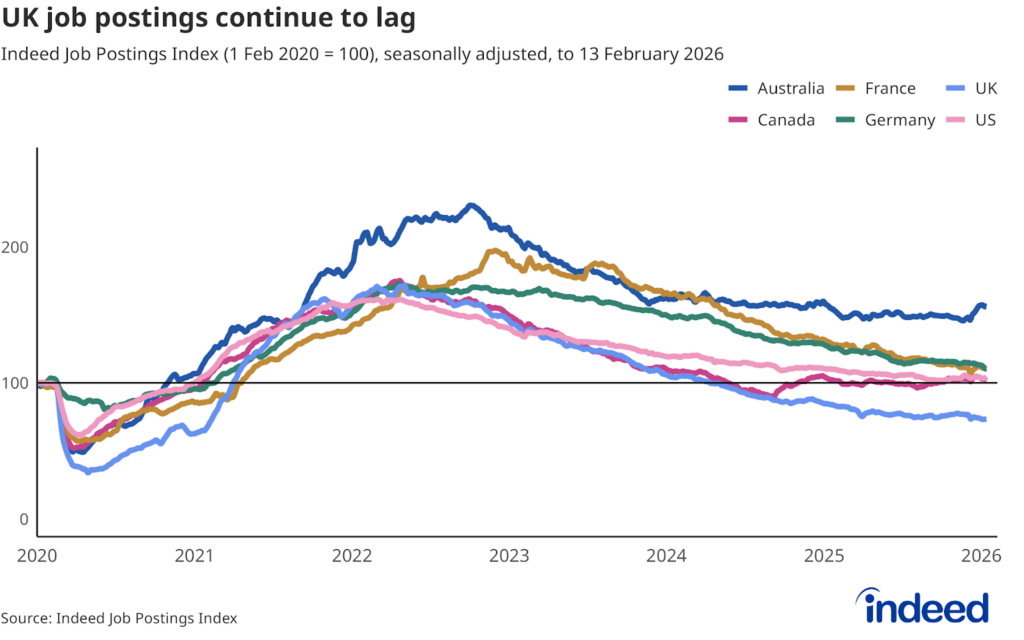
The UK labour market continues to weaken amid persistently soft hiring demand. UK job postings have continued to gradually fall, slipping a further 1.9% in the month to 13 February and standing around 13% below last year. The headline job postings index now sits around 27% below its pre-pandemic baseline, remaining well below equivalent metrics for peer economies globally.
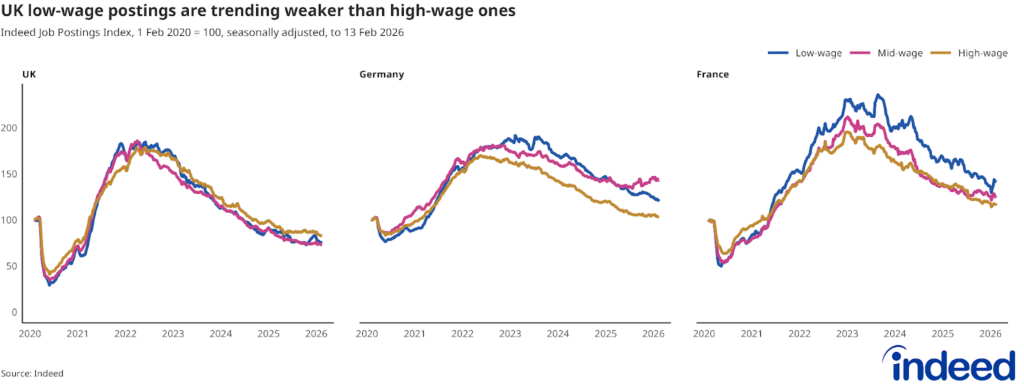
Weakness in low-paid occupations continues to mark out the UK versus peers. Whereas low-wage postings in the UK are trending below high-wage ones, they remain substantially stronger in countries like Germany and France. Lower-paid jobs in the UK have been hit harder by last year’s tax rises and minimum wage increases, which have raised employment costs to a greater degree proportionally than higher-wage ones.
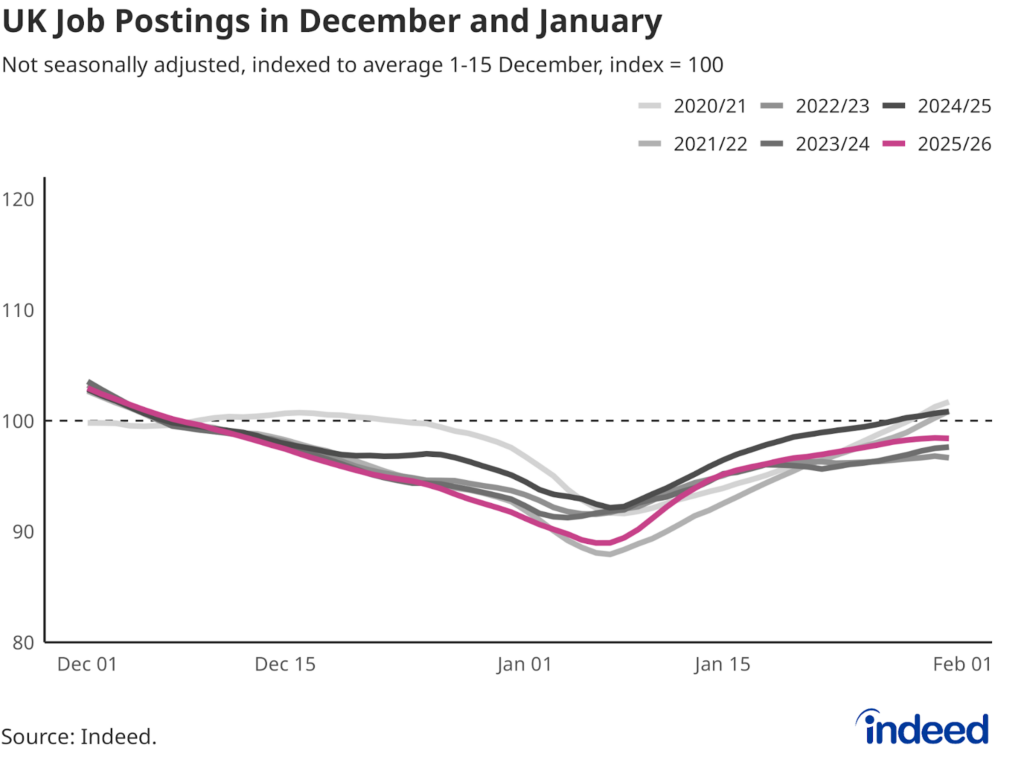
Spotlight: Subdued January job postings rebound
UK job postings typically dip over the holiday season, and then build momentum during January as recruitment plans kick into gear. But this January’s seasonal rebound was sluggish, with postings failing to reach their early-December average, remaining 1.6% down on that level at month-end. The muted start to the year underlines the mood of caution around the UK job market, amid modest economic growth projections and higher employment costs in the wake of last year’s tax increases and minimum wage rises.
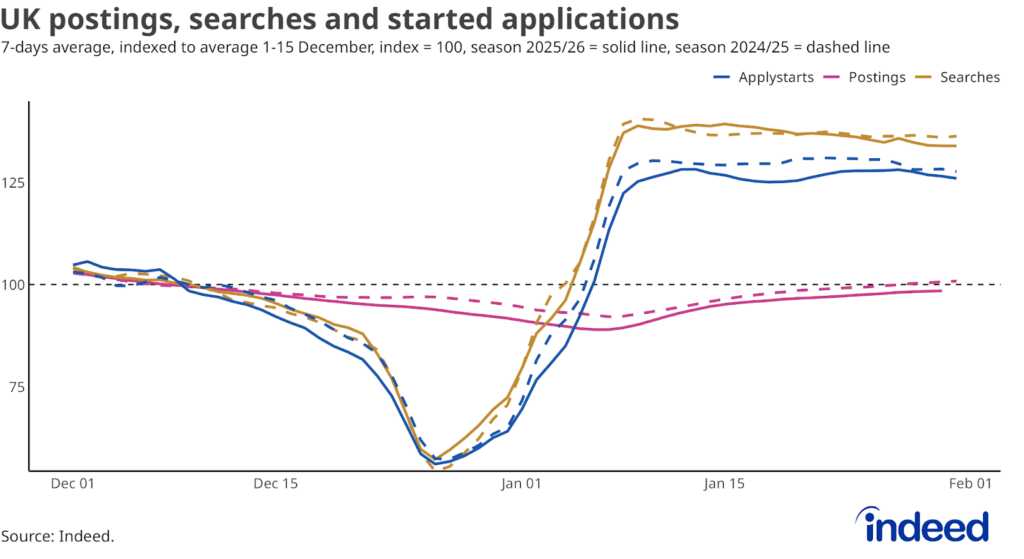
Searches and applications saw slightly softer rebounds than last year
The seasonal rebound in jobseeker searches, meanwhile, followed a similar trajectory to last year, though lost some steam towards the end of January, finishing around 1.7% down versus a year previously.
Applications were a little sluggish, trailing the previous year’s trend throughout January and finishing the month 1.3% lower year-on-year. Perhaps a perceived shortage of good opportunities played a part in jobseekers’ lack of gusto at the beginning of 2026.
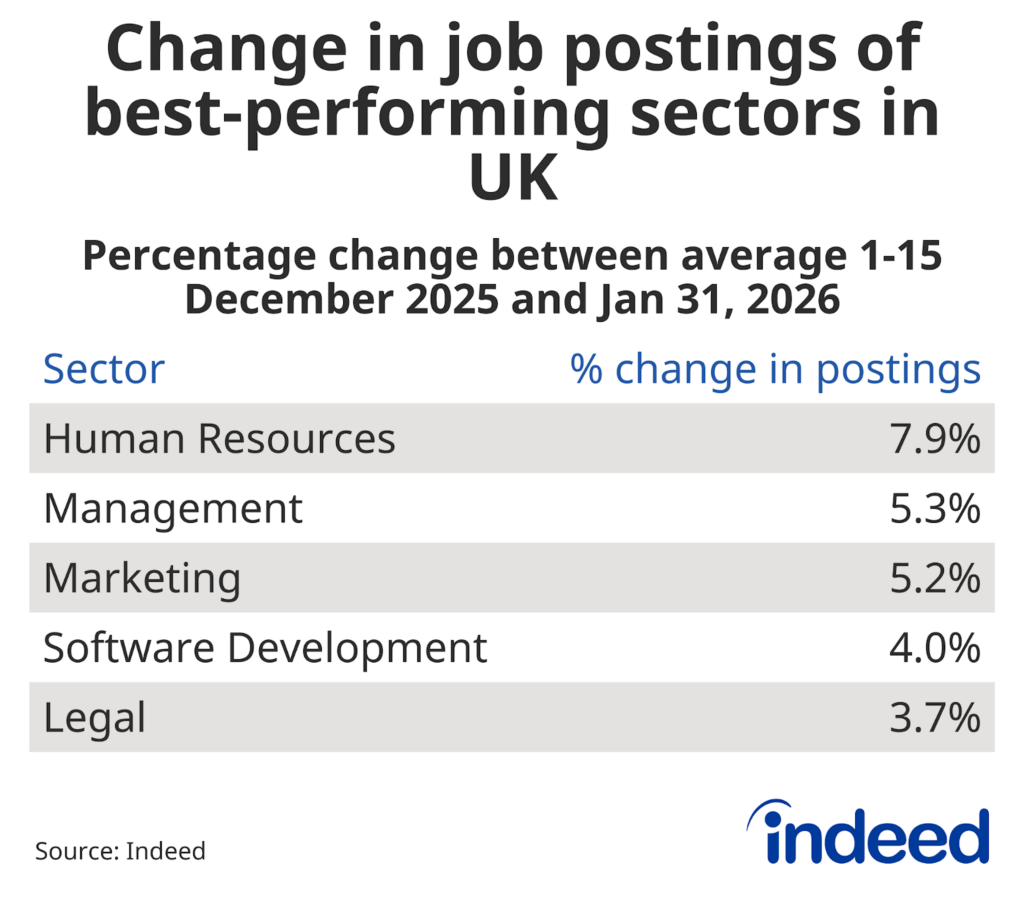
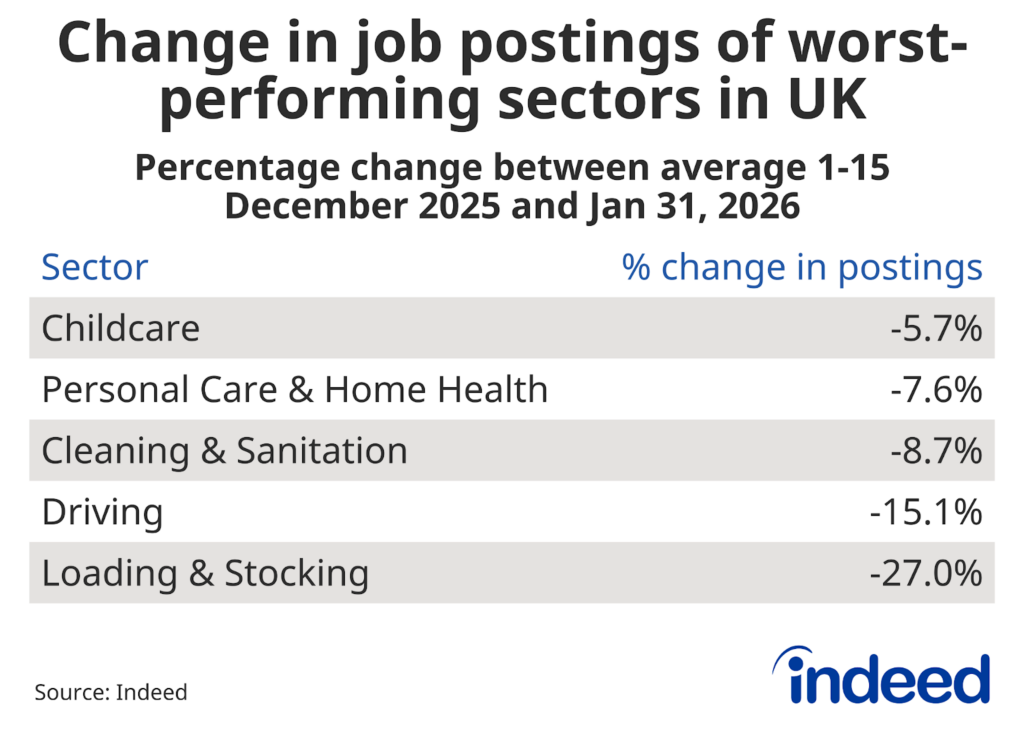
Strongest and weakest job postings rebounds
Several categories opened the year with a spring in their step, led by human resources, which saw a 7.9% rise in postings versus baseline. Management, marketing, software development and legal also saw among the strongest January job postings rebounds.
Cleaning, logistics, social care and childcare occupations were among those that had a soft start to the year. Loading & stocking postings were furthest down on baseline (-27%). Though that category usually sees a seasonal drop-off after the holiday period, this year’s decline was larger than in prior years.
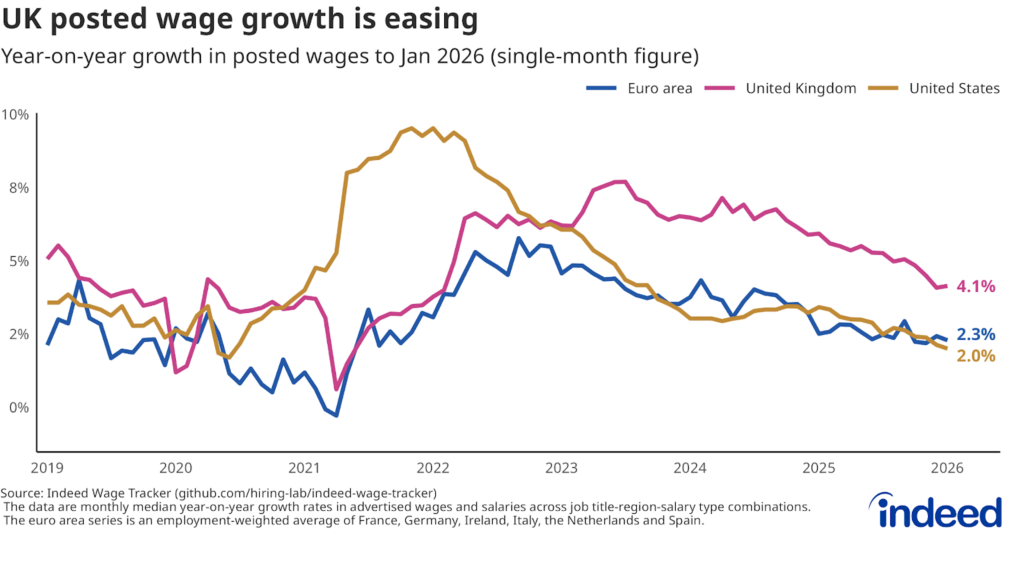
Wage growth has moderated
The softer labour market has resulted in easing pay pressures. The Indeed Wage Tracker shows that annual posted wage growth was 4.1% in January, unchanged from the rate in December. That’s well down from the elevated levels seen throughout much of the post-pandemic period, though still above the 3% range the Bank of England considers consistent with its 2% inflation target.
Official data also shows easing pay pressures, with annual growth of regular pay slowing to 4.2% in the final quarter of last year and private-sector wage growth (closely watched by Bank rate setters) easing to 3.4%.
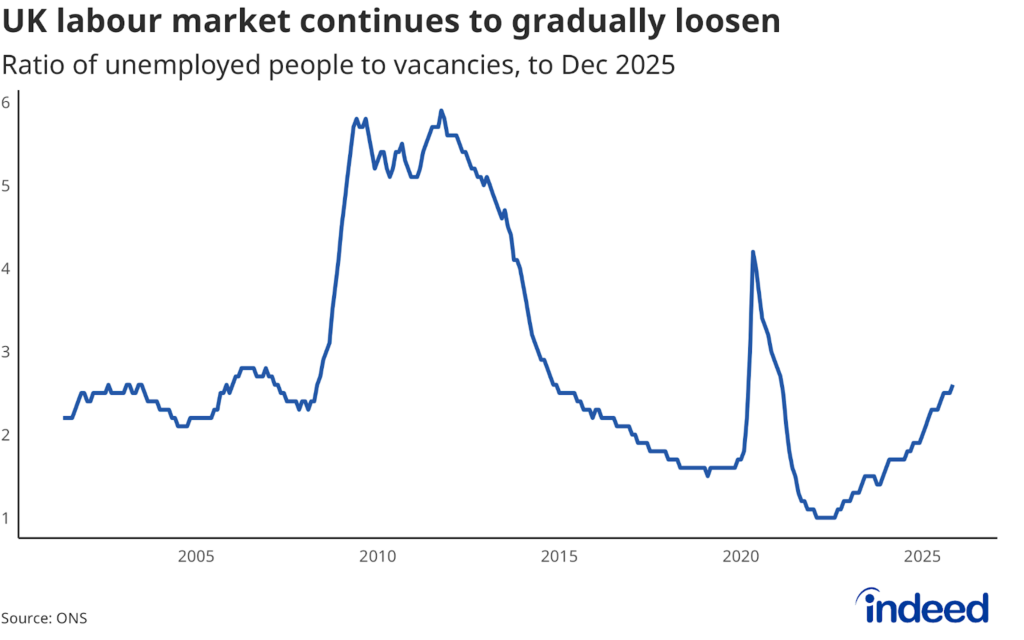
The labour market continues to loosen
The unemployment rate continues to edge higher, reaching 5.2% in the three months to December – the highest in nearly five years. Though vacancies have been relatively stable in recent months, rising joblessness has continued to loosen the labour market. At 2.6, the ratio of unemployed people to vacancies is at its highest since early 2021 when the labour market was recovering from the initial COVID shock.
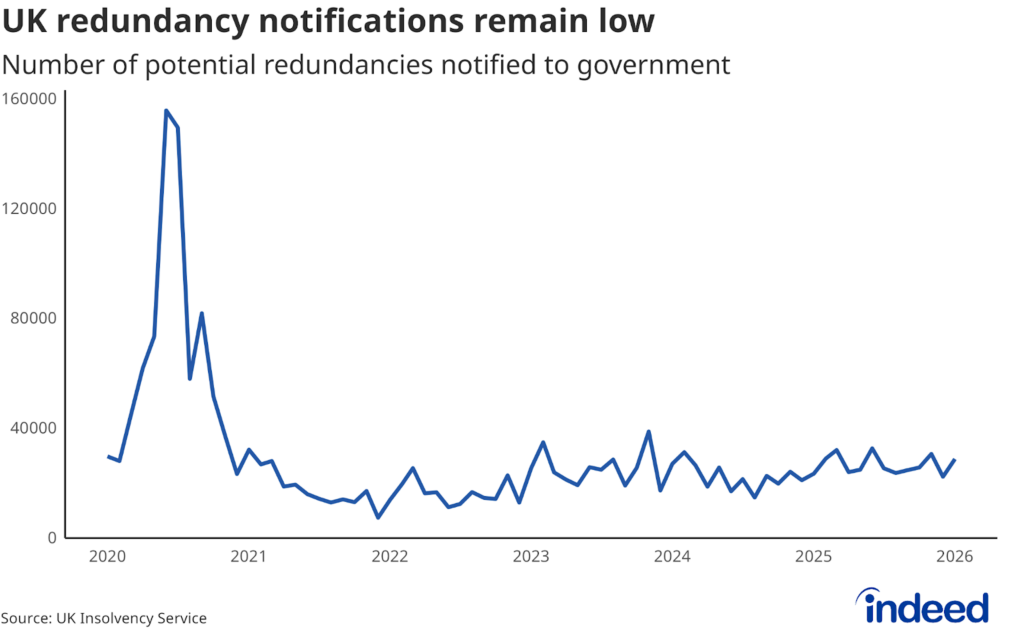
Redundancy notifications have crept up, though remain modest
Though there remain few signs of impending widespread job losses, redundancy notifications have been nudging higher. The number of potential redundancies averaged around 27,000 in the three months to January. That’s a little lower than the series average since comparable data started in 2020, but higher than the average of around 21,000 since 2021, excluding the early-COVID spike.
Conclusion
The soft start to 2026 continues a pattern that has characterised the UK labour market for some time: persistently weak hiring demand and a gradually loosening market. But there remains little sign of that turning into a more serious shakeout, in the immediate term at least. With employers grappling with higher costs and modest expectations for the UK economy, prospects for the labour market soon pulling out of its funk look slim. If policymakers respond by cutting interest rates in the coming months, that may help shore up confidence in the economy’s prospects and hopefully prevent the weakness from turning into a more protracted jobs downturn.
Hiring Lab Data
Job postings data is available on our Data Portal. We also host the underlying job-postings chart data on GitHub as downloadable CSV files. Typically, it will be updated with the latest data one day after this blog post is published.
Methodology
Data on seasonally adjusted Indeed job postings is an index of the number of seasonally adjusted job postings on a given day, using a seven-day trailing average. Feb. 1, 2020, is our pre-pandemic baseline, so the index is set to 100 on that day.
To calculate the average rate of wage growth, we follow an approach similar to the Atlanta Fed US Wage Growth Tracker, but we track jobs, not individuals. We begin by calculating the median posted wage for each country, month, job title, region and salary type (hourly, monthly or annual). Within each country, we then calculate year-on-year wage growth for each job title-region-salary type combination, generating a monthly distribution. Our monthly measure of wage growth for the country is the median of that distribution.
The number of job postings on Indeed.com, whether related to paid or unpaid job solicitations, is not indicative of potential revenue or earnings of Indeed, which comprises a significant percentage of the HR Technology segment of its parent company, Recruit Holdings Co., Ltd. Job posting numbers are provided for information purposes only and should not be viewed as an indicator of performance of Indeed or Recruit. Please refer to the Recruit Holdings investor relations website and regulatory filings in Japan for more detailed information on revenue generation by Recruit’s HR Technology segment.