
Key Points:
- UK job postings continue to decline from their peak, with London now below pre-pandemic levels for the first time since July 2021.
- Falling inactivity means the labour market is also rebalancing on the supply side, despite record long-term sickness.
- Robust wage growth and persistently high inflation mean further interest rate hikes remain on the cards.
- But high inflation is still reducing the value of workers’ pay packets.
While still relatively robust, the UK labour market continues to rebalance in the face of slowing labour demand and improving labour supply, while strong wage growth continues to be a key concern for Bank of England policymakers. Job seekers’ confidence in their ability to quickly find a new job has fallen to its lowest recorded level as overall job postings, while generally still above pre-pandemic levels in most parts of the country, continue to decline — especially in and around London.
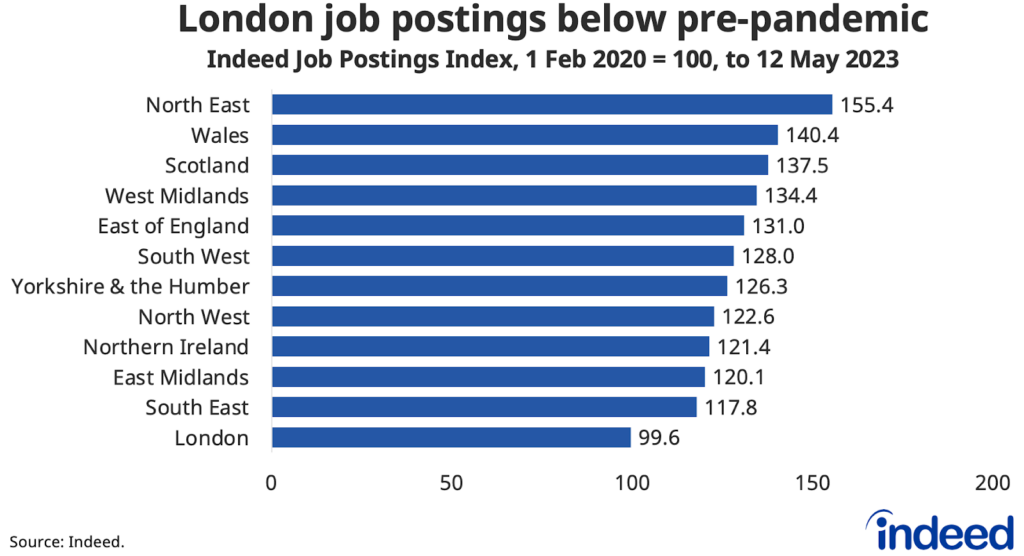
Spotlight: London job postings are now below pre-pandemic levels
The level of job postings in London has persistently lagged behind the rest of the UK throughout the post-pandemic period, with job postings in the capital falling below their pre-pandemic levels in May for the first time since July 2021. As more people continue working from home, lower commuter footfall in the city is likely a key driver of the broad-based decline in London job postings throughout the year. A range of in-person services, distribution and professional occupations were among the categories in which postings declined the most.
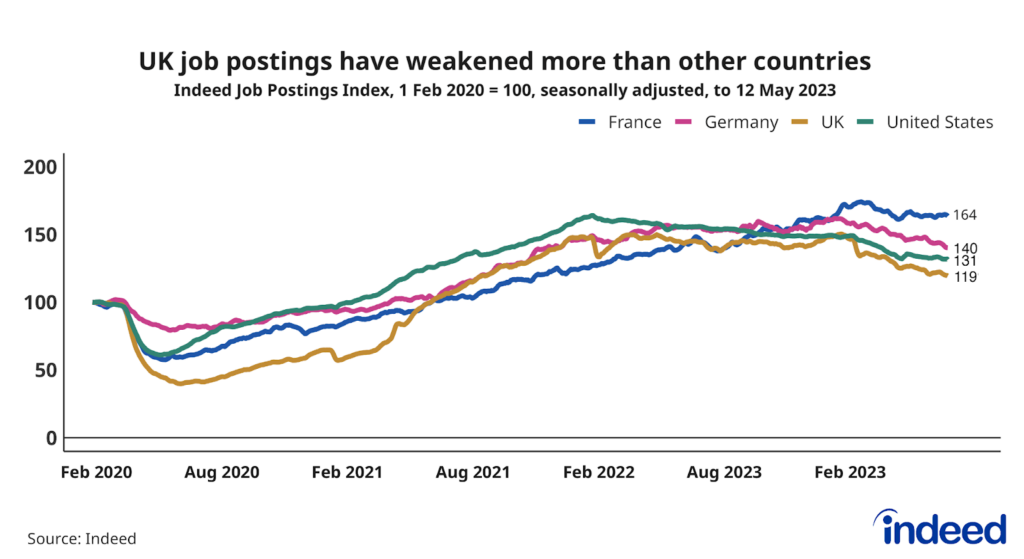
But while the rest of the nation has managed to outperform London, UK postings overall continue to decline at a steady clip that reflects a softening in hiring appetite, especially relative to other comparable countries. As of 12 May, UK postings were 19% above their immediate pre-pandemic level from 1 February 2020. That’s down from a peak of 50% last December and well below levels in the US, Germany and France, where postings in each nation remain at least 30% above their pre-pandemic baseline.
UK postings have also fallen further from their peak, down 21% versus 20% in the US, 13% in Germany and 6% in France.
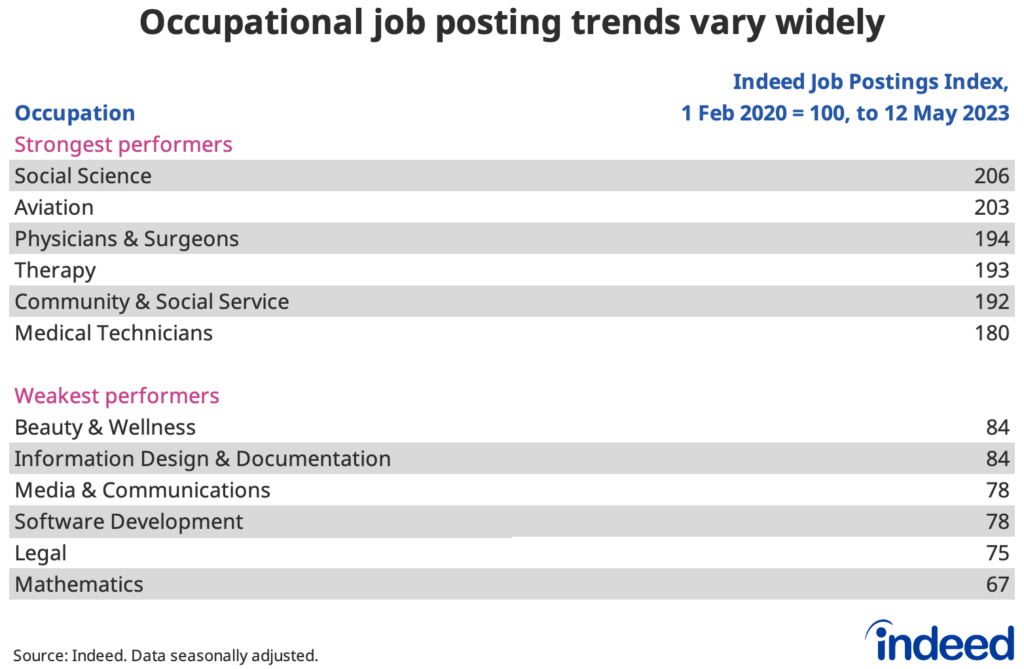
National job posting trends vary widely by occupation. Posts for roles in social science, aviation and several healthcare categories are well above pre-pandemic levels, while job postings in fields as diverse as mathematics (including jobs for data analysis, data scientists and statisticians), legal, media & communications, beauty & wellness and tech occupations are all below pre-pandemic levels.
Declining jobseeker confidence
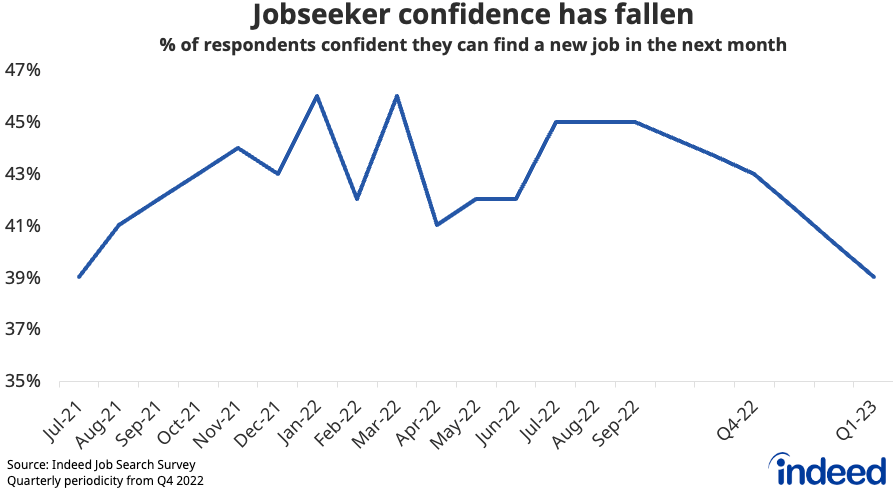
The decline in postings coincides with an almost year-long decline in confidence among job seekers in their ability to quickly find a new job. The labour market has been tilted strongly in candidates’ favour over the past few years as employer demand for workers outstripped labour supply, but that imbalance is beginning to shift. In Q1, just 39% of respondents to an Indeed survey said they were confident they could find a new job within a month, the lowest level since the survey began in July 2021. The recent dip in confidence has been particularly marked among those aged 55+ and those younger than 25.
Labour Market Overview
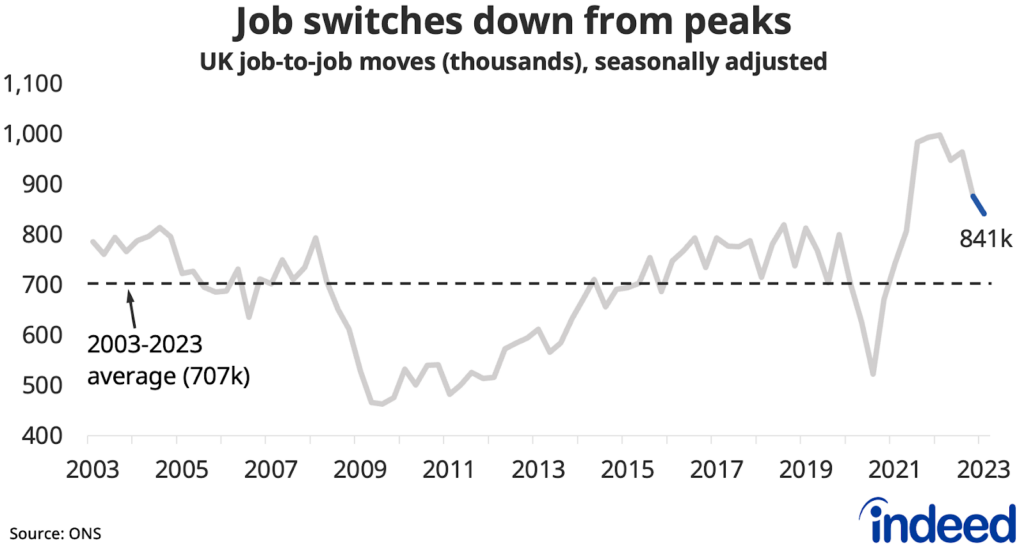
But while the labour market continues to soften and rebalance, there are still signs of resilience. Vacancies and job-to-job moves, while down from recent peaks, remain 30% and 20% above pre-pandemic levels, respectively. The unemployment rate ticked up to 3.9% in the most recent reading, driven by long-term unemployment, but remains historically low.
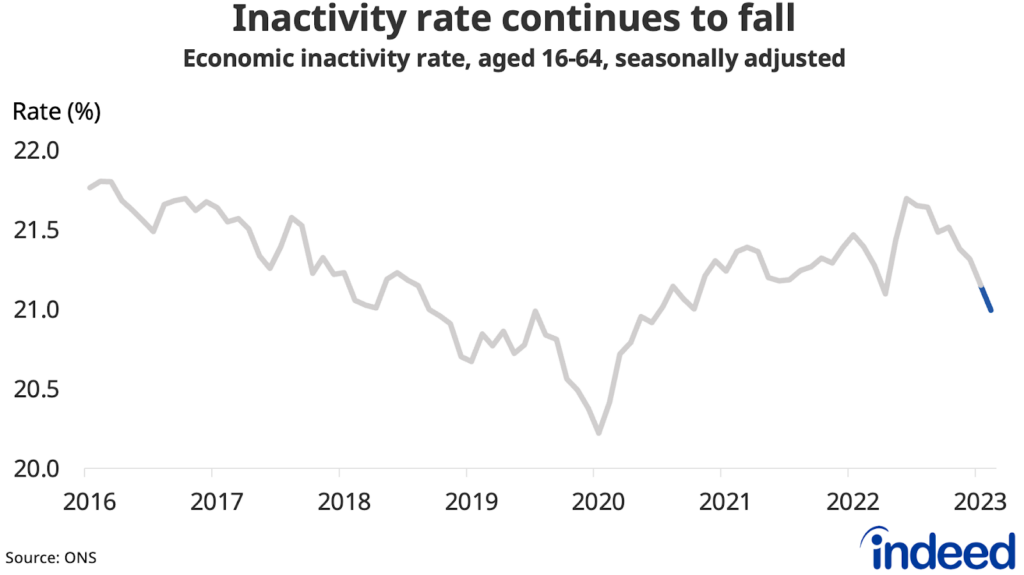
The labour supply picture is also improving. A record net flow of workers moving from inactivity to employment in the first quarter helped bring the national inactivity rate down to 21.0%. That’s down from a peak of 21.7% last summer, but remains above the 20.2% rate on the eve of the pandemic.
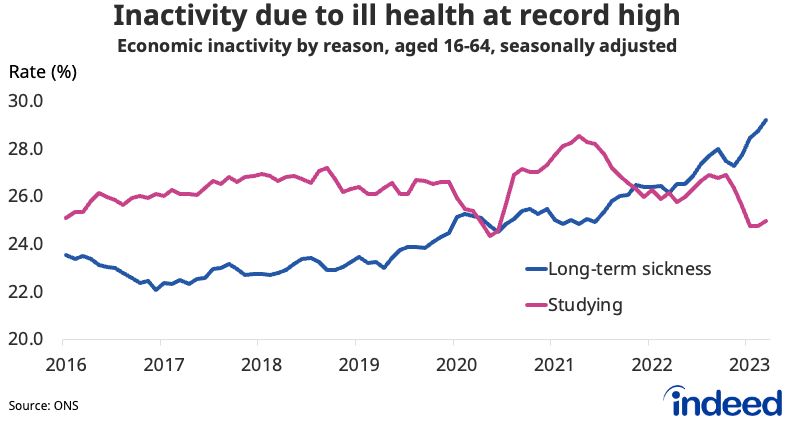
The main driver of the recent drop in activity has been from former students entering the workforce. In the pandemic’s early phases, many students chose to stay in school longer as large swathes of the economy shut down and job opportunities were scarce. But that trend has now largely unwound.
But while the young and healthy have largely returned to work, those working-age people infirm and ill with long-term ailments continue to grow as a share of the overall workforce, hitting a new record high of 29.2% in the first quarter. There are currently more than 2.5 million working-age people currently inactive in the labour force due to long-term ill health, according to government data, as NHS waiting lists swell to record levels.
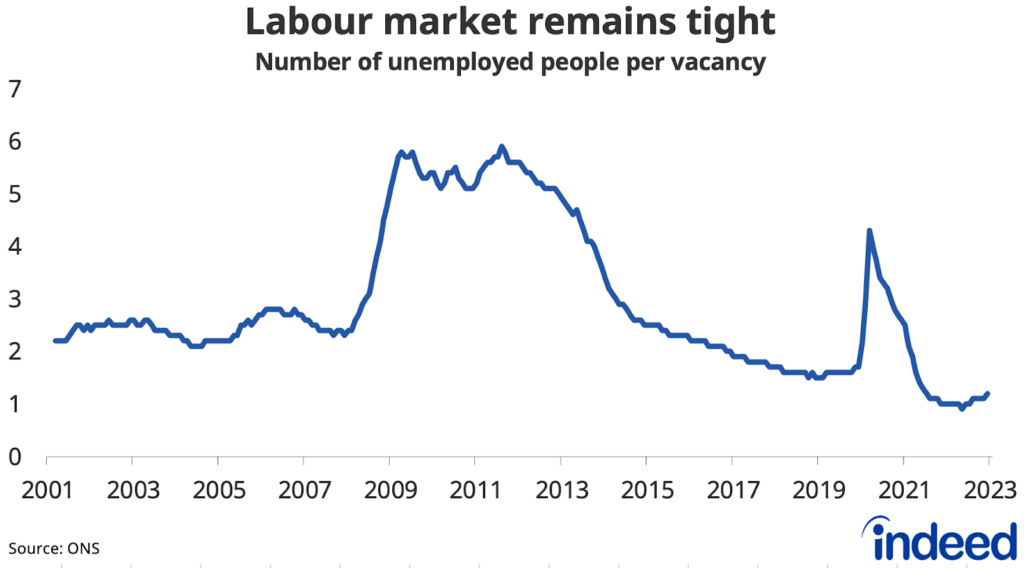
But while slowing labour demand and improving labour supply have contributed to some rebalancing in the market, overall it remains historically tight. There are currently just 1.2 unemployed jobseekers for each vacancy.
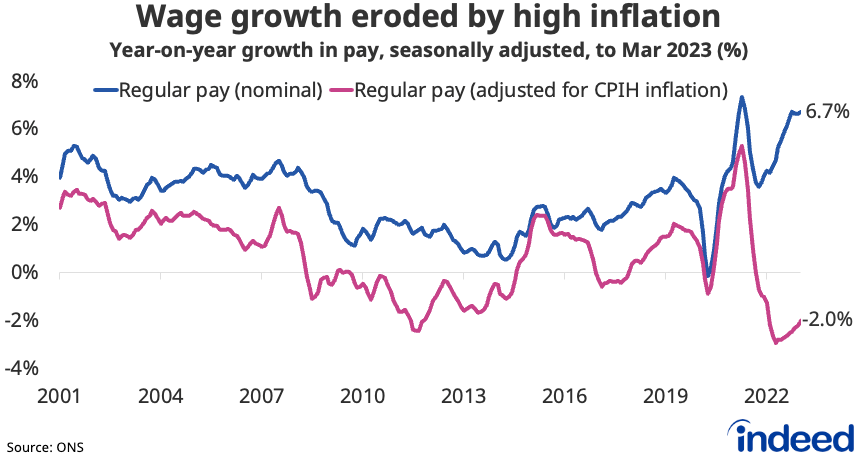
Strong wage growth still eroded by high inflation
That tight labour market continues to generate strong regular wage growth, with nominal wages up 6.7% year-on-year (y/y). But after accounting for inflation, real wages fell by 2.0% y/y through Q1.
Public sector wage growth picked up to 5.7% y/y at the end of Q1, the fastest since 2003, but is still below the 7.0% y/y pace of private sector wage growth.
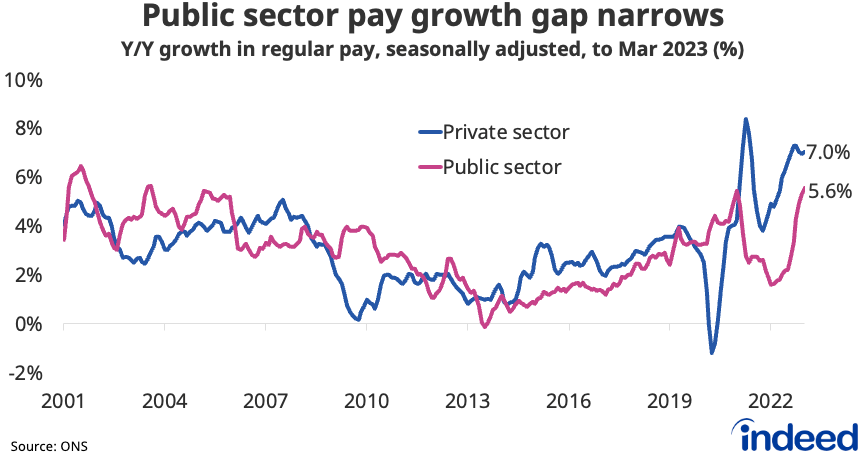
The recent acceleration of public sector pay growth points to public sector employers acceding to some of the wage demands of their workers amid widespread industrial action. There were 556,000 working days lost due to strike action in March, the highest since December, as junior doctors joined picket lines in the month.
Conclusion
The strength of the labour market remains a key determinant of how much further the Bank of England will raise interest rates to cool stubbornly high inflation. Though there have been further signs of cooling in labour demand and rebalancing in the market is underway, wage growth remains uncomfortably high for policymakers, maintaining pressure on them for further rate hikes.
The Bank expects job losses to remain limited over coming quarters as employers prioritise retention of existing workers while appetite for new hires slows. Overall vacancies are still high for the time being, though trends vary considerably by sector. With the labour market on course to soften further in coming months, those wanting to find a new job should take action while the market remains generally favourable.
Hiring Lab Data
We host the underlying job-postings chart data on Github as downloadable CSV files. Typically, it will be updated with the latest data one day after this blog post was published.
Methodology
The Indeed Job Postings Index is a daily measure of labour market activity that is updated and will continue to be released weekly, superseding the Job Postings Tracker. The primary difference between the Indeed Job Postings Index and the legacy Job Postings Tracker is the level. The Indeed Job Postings Index is set to 100 on February 1, 2020, and this effectively provides a uniform level shift of 100 to the existing Job Postings Tracker across all time points.
Indeed conducted an online survey between 1-22 March of 15,000 UK adults 18-64. Weights were applied to each survey to match respondent distributions across age, gender, region, education and ethnicity based on data from the Office for National Statistics.
The number of job postings on Indeed.com, whether related to paid or unpaid job solicitations, is not indicative of potential revenue or earnings of Indeed, which comprises a significant percentage of the HR Technology segment of its parent company, Recruit Holdings Co., Ltd. Job posting numbers are provided for information purposes only and should not be viewed as an indicator of performance of Indeed or Recruit. Please refer to the Recruit Holdings investor relations website and regulatory filings in Japan for more detailed information on revenue generation by Recruit’s HR Technology segment.