
Key Points:
- Job postings trend remains robust but several categories have seen a correction, especially pandemic winners like cleaning & sanitation and food preparation & service.
- HR slowdown as economic uncertainty leads to caution.
- Inactivity spike amid record long-term sickness tightens the labour market even further, suggesting employers are unlikely to find hiring conditions easing up too much in the near term despite recession risks.
- Real wage squeeze goes on.
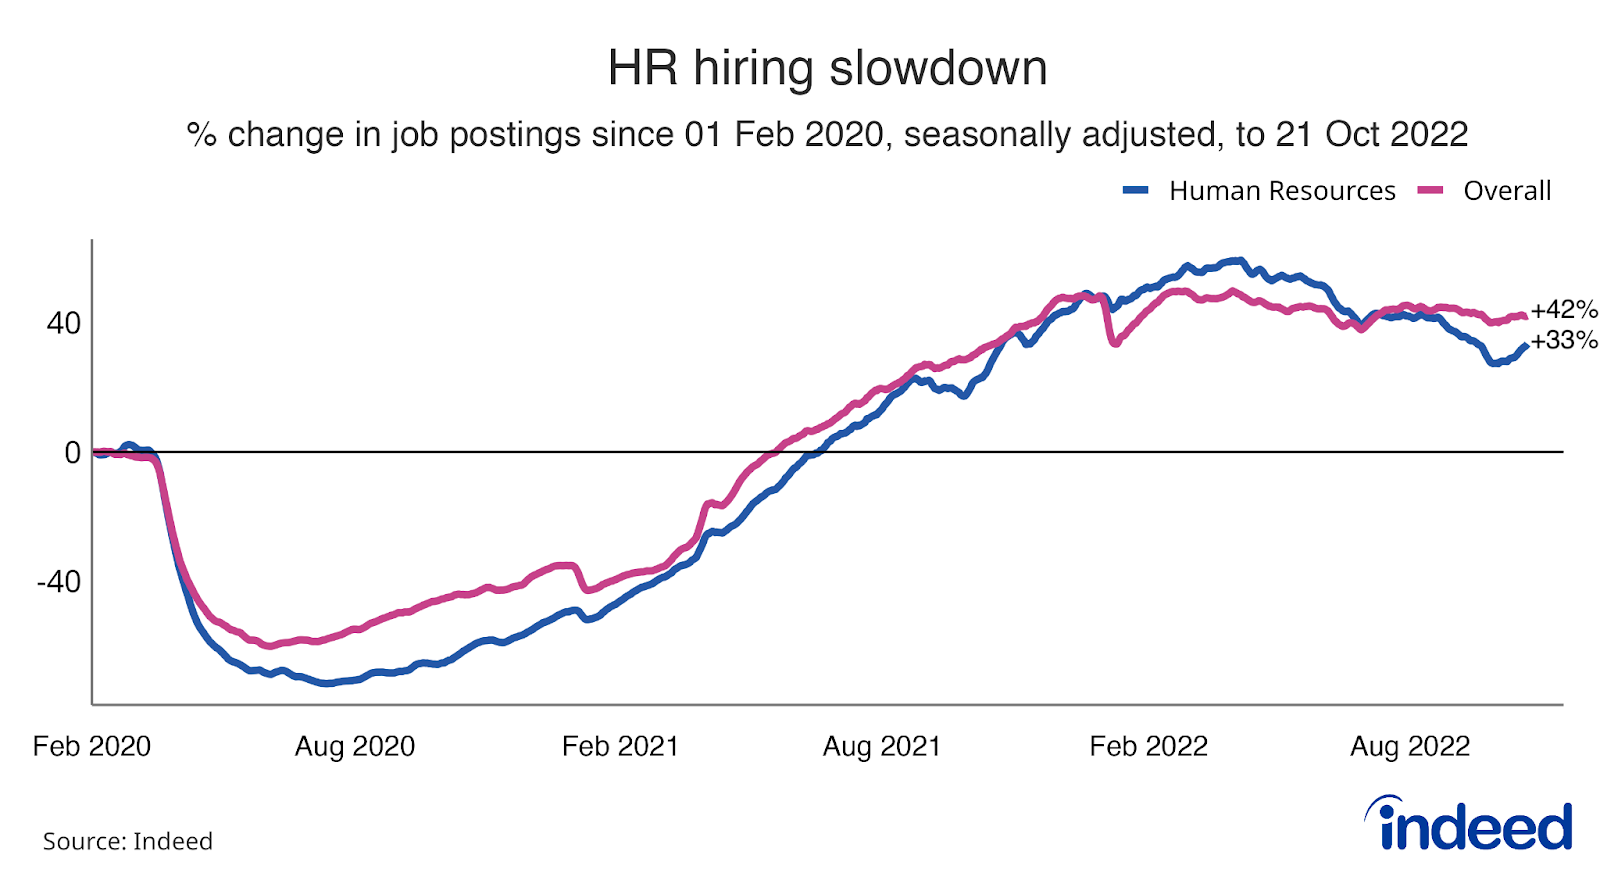
Spotlight: HR hiring slowdown
Job postings in the human resources category have slowed in recent months and are now underperforming the overall UK trend. Earlier in the year, HR postings were outperforming as the post-pandemic hiring boom meant organisations were eager to hire the people who help them hire others. The slowdown may be indicative of caution as the economic outlook has clouded, albeit postings in the HR category are still a healthy 33% above their pre-pandemic level.
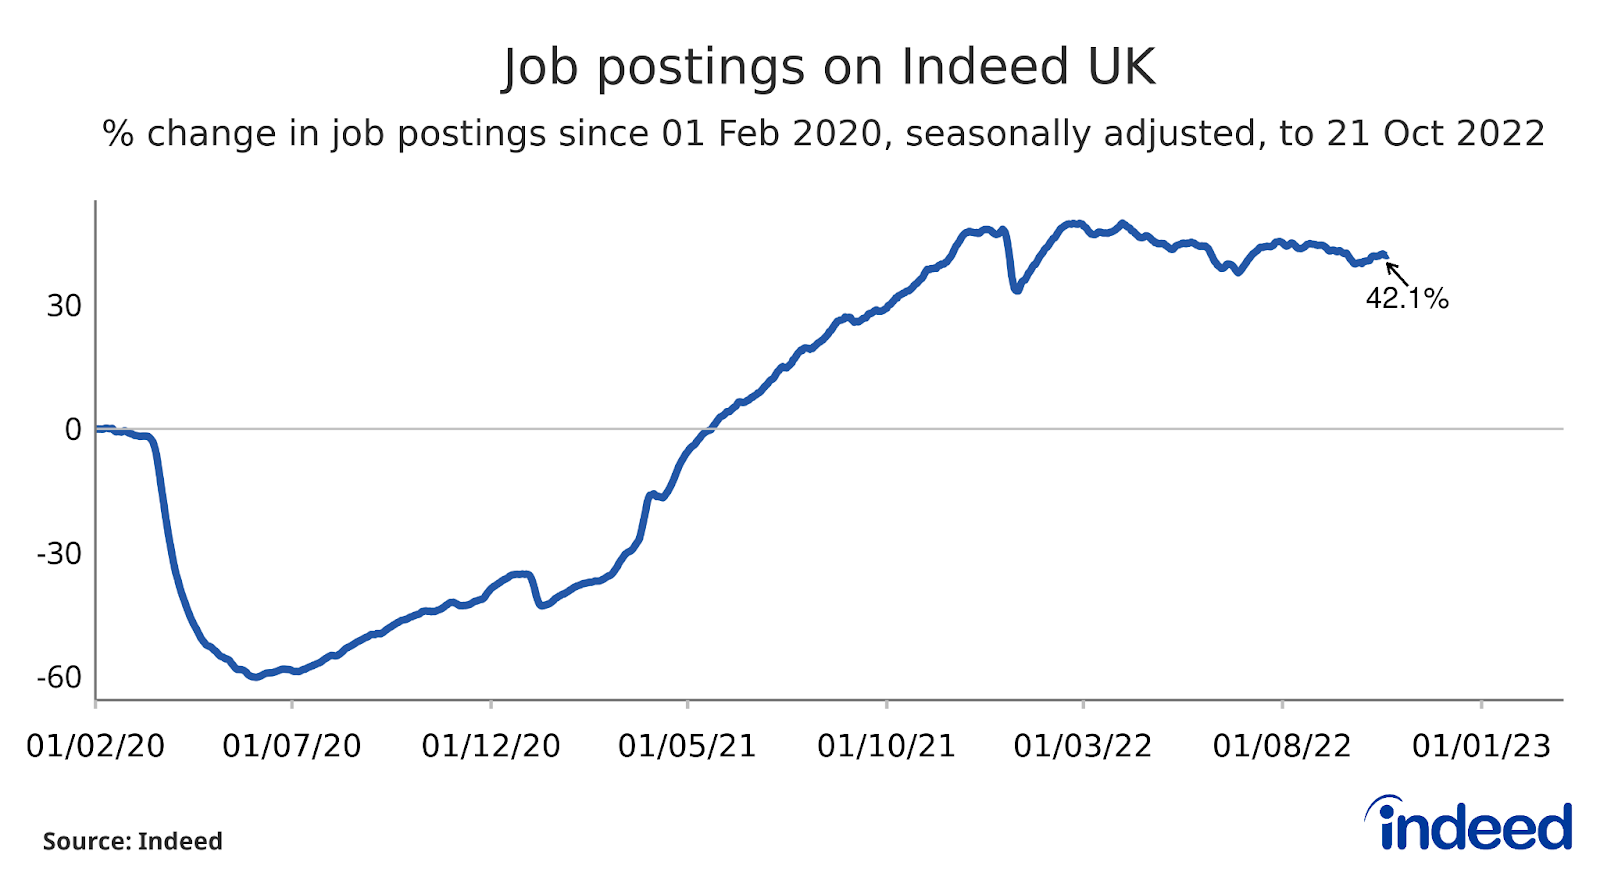
Real-time data from Indeed job postings continue to indicate a robust trend at the aggregate level. UK job postings were 42% above the 1 February 2020, pre-pandemic baseline, seasonally adjusted, as of 21 October 2022. That’s a similar level to what we’ve seen for a number of months now, with hiring demand proving resilient to economic headwinds and recent political turbulence.
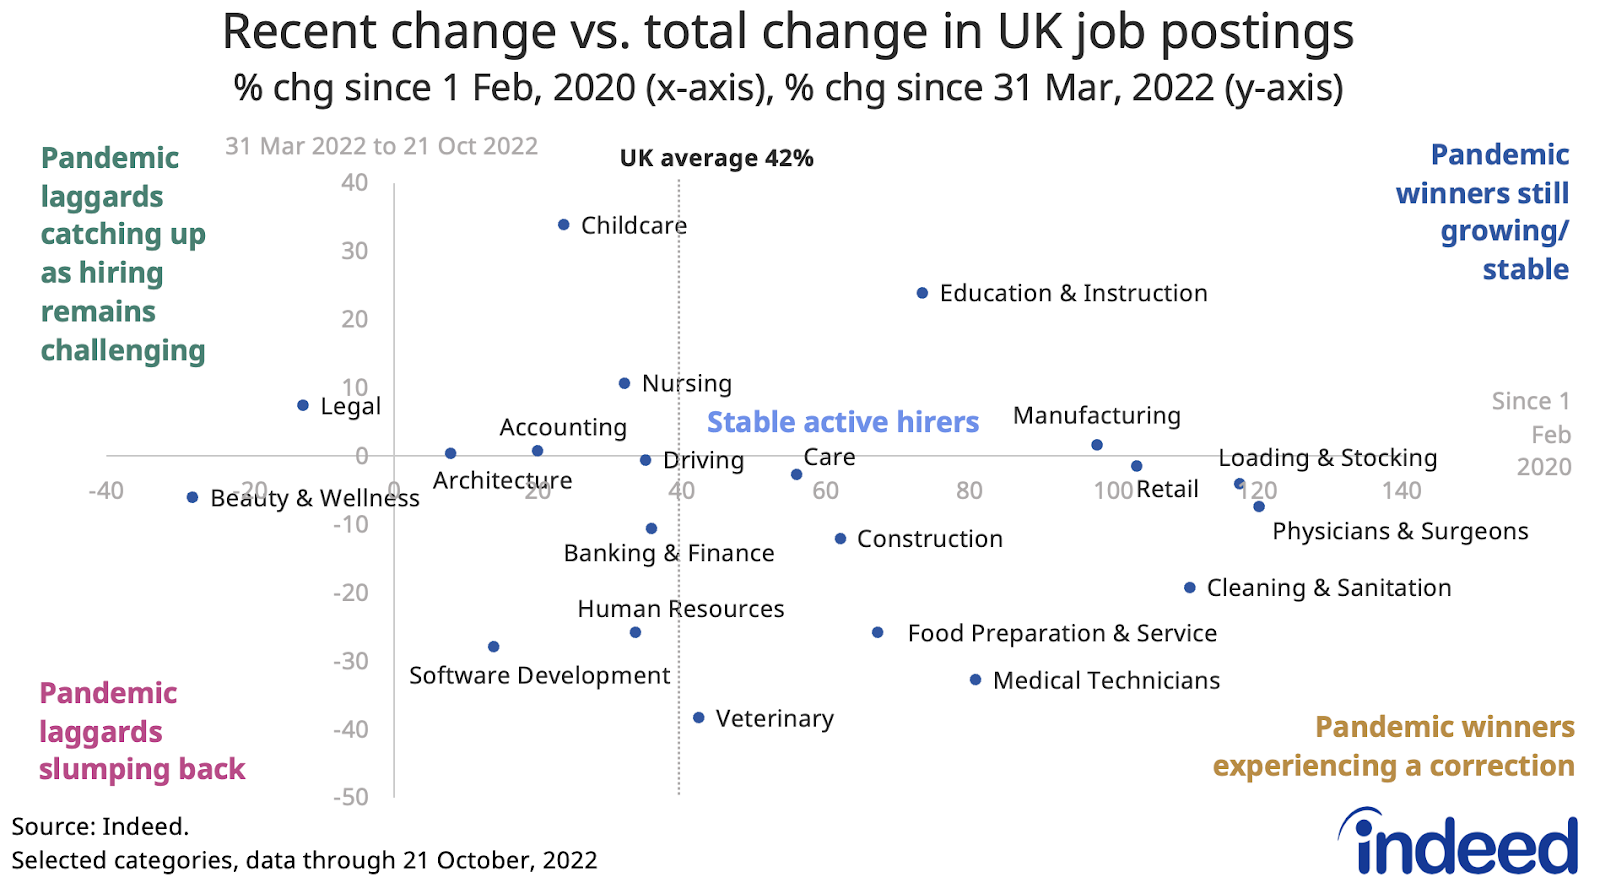
Several categories have seen a correction
Job postings remain elevated in a number of categories, though many have seen a correction in recent months. That includes loading & stocking, cleaning & sanitation, retail, food preparation & service and certain healthcare categories.
Meanwhile, the childcare and education & instruction categories have made the biggest gains since the end of Q1.
Labour Market Overview
The latest figures from the Office for National Statistics (ONS) pointed to further cooling in the labour market. The employment rate dropped to 75.5% in the three months to August (down 0.3ppts from the previous quarter). Vacancies also fell on the quarter though remain close to record highs at 1.25 million.
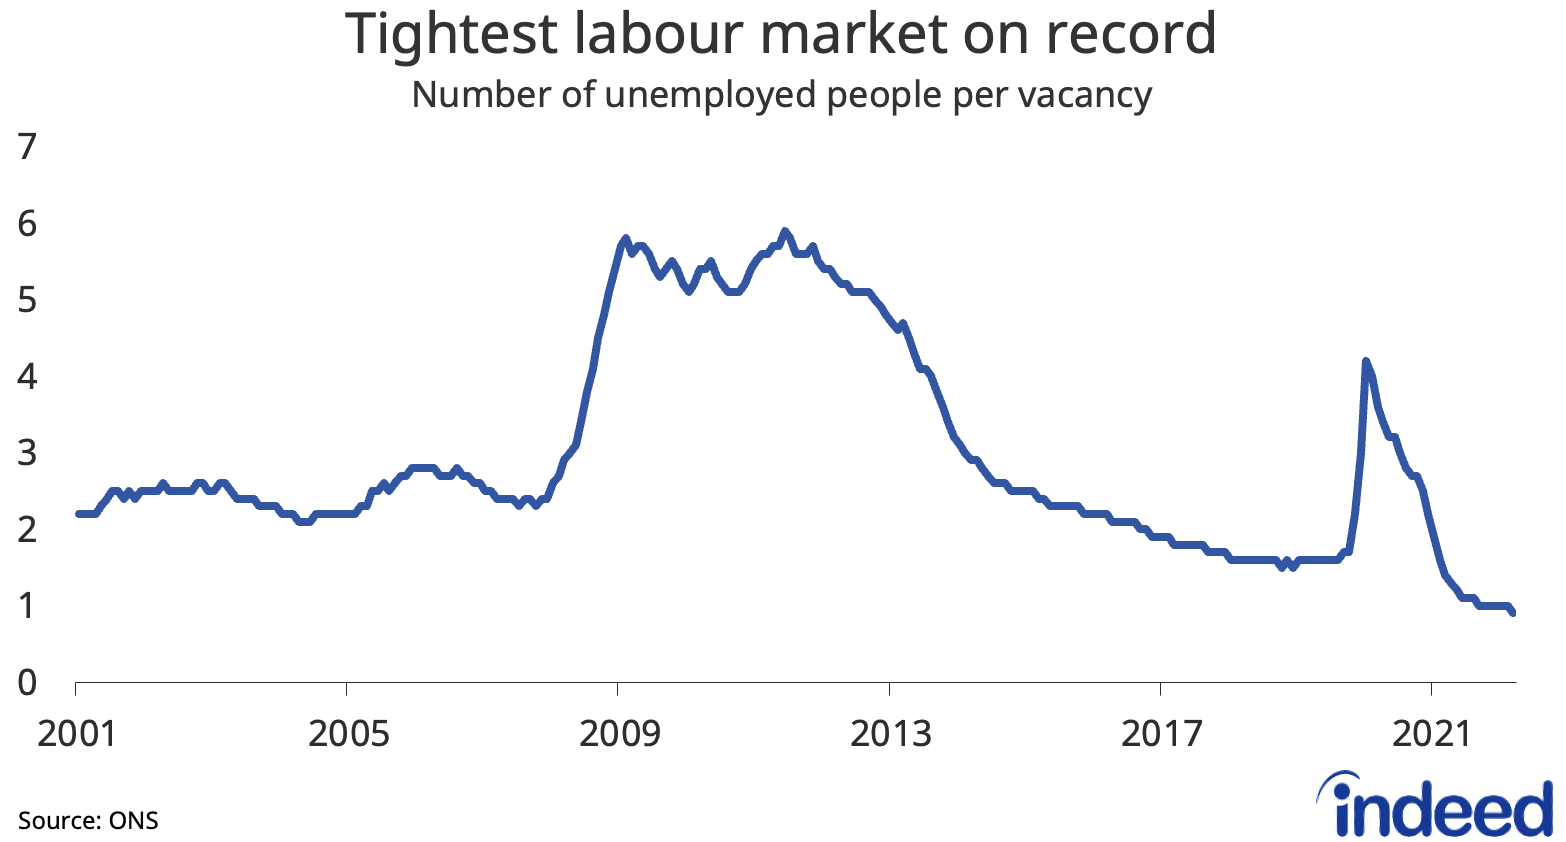
Despite that, the unemployment rate dropped further to just 3.5%, down 0.3ppts on the quarter. That meant the ratio of unemployed jobseekers to vacancies hit a new record low of 0.9, the tightest labour market on record.
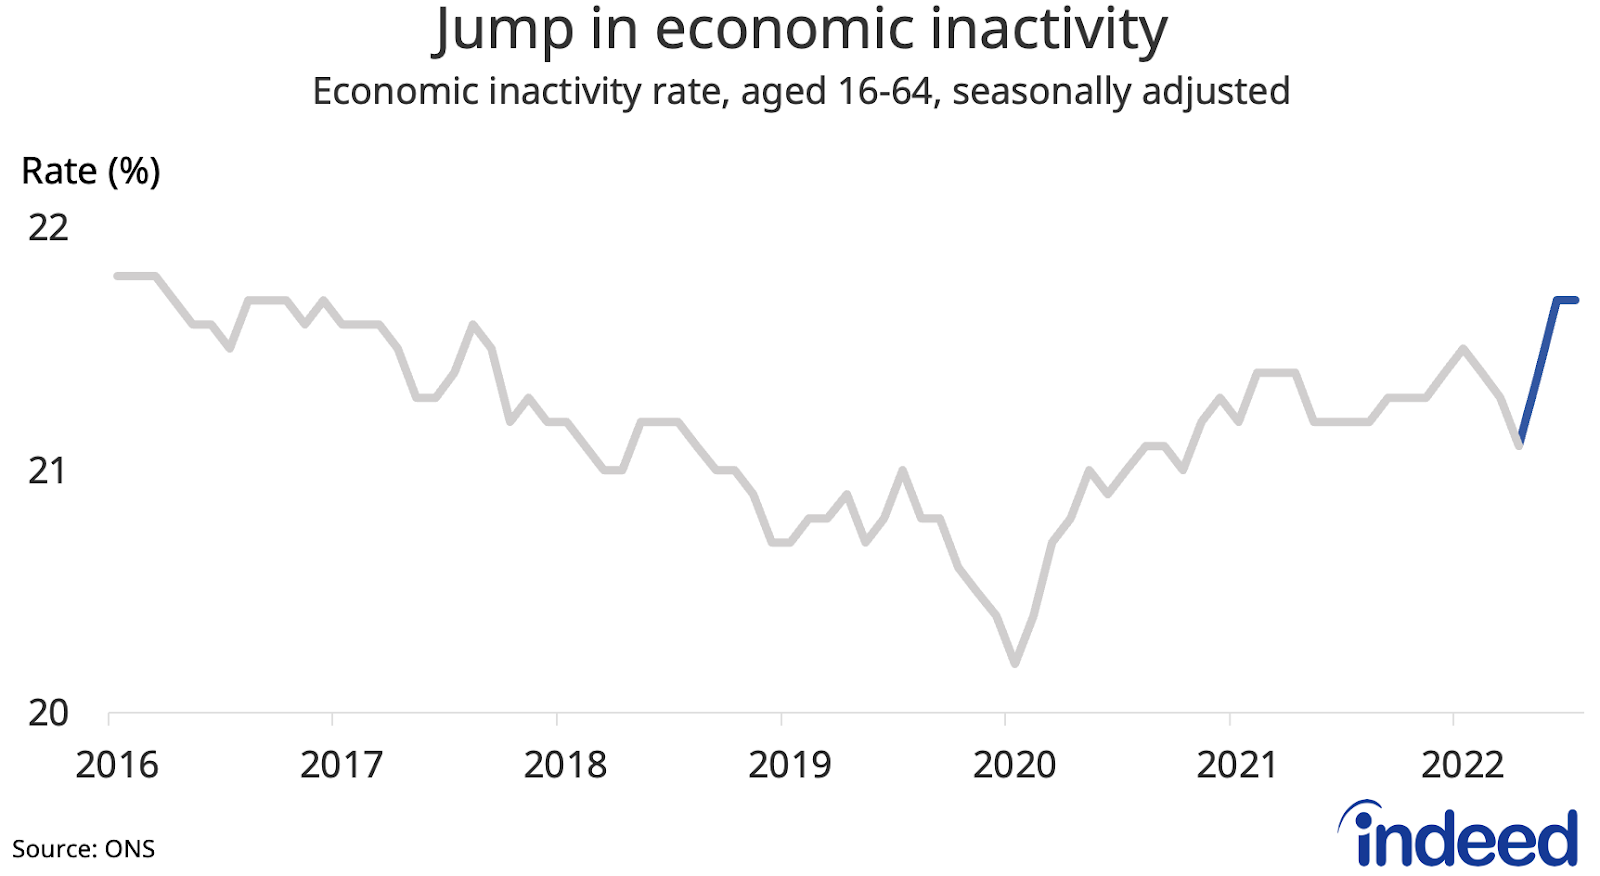
Inactivity spike as long-term sickness hits record
Driving the further tightening of the labour market was a jump in the rate of economic inactivity to 21.7% in the three months to August (up 0.6ppts on the quarter). Ill-health continues to be the main factor behind elevated inactivity. The number of people inactive because of long-term sickness climbed to a new record and now stands close to 2.5 million.
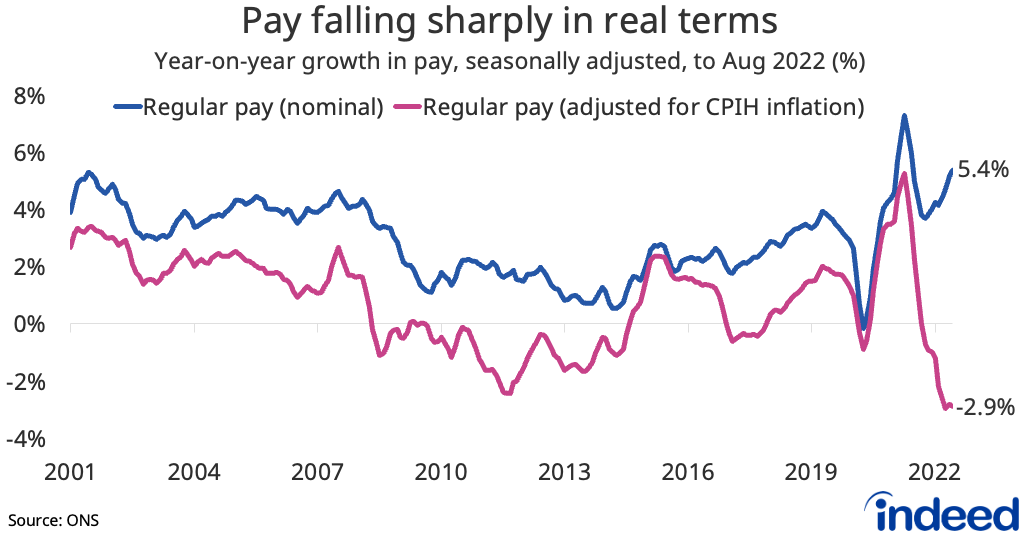
Real terms pay squeeze continues
The tight labour market continues to fuel strong nominal wage growth, which rose to 5.4% y/y for regular pay in the three months to August. But after accounting for high inflation, pay was down by a near-record 2.9% y/y in real terms.
Conclusion
After weeks of political and financial market turmoil, the UK has a new Prime Minister and appears headed into somewhat calmer waters. But the economic outlook for the rest of the year and into 2023 remains extremely challenging and, though starting from a strong position, the labour market is likely to feel the chill.
With the government set to unveil its fiscal plans in mid-November and the Bank of England attempting to calibrate its monetary policy tightening around that, policymakers will continue to desire a ‘soft landing’ whereby the labour market rebalances primarily through a decline in vacancies from elevated levels without an accompanying large spike in unemployment. That would appear to be the least painful way of cooling nominal wage pressures and seeing off the inflationary threat over the medium term.
Though cost-of-living pressures may yet draw more people currently sitting on the sidelines back into the workforce, constrained labour supply looks set to be an enduring feature of the UK labour market. Current trends around long-term sickness are especially concerning. Employers are therefore unlikely to find hiring conditions easing up too much despite the economic gloom and recession risks.
We host the underlying job-postings chart data on Github as downloadable CSV files. Typically, it will be updated with the latest data one day after this blog post was published.
Methodology
All figures in this blogpost are the percentage change in seasonally-adjusted job postings since 1 February, 2020, using a seven-day trailing average. 1 February, 2020, is our pre-pandemic baseline. We seasonally adjust each series based on historical patterns in 2017, 2018, and 2019. Each series, including the national trend, occupational sectors, and sub-national geographies, is seasonally adjusted separately. We adopted this methodology in January 2021.
The number of job postings on Indeed.com, whether related to paid or unpaid job solicitations, is not indicative of potential revenue or earnings of Indeed, which comprises a significant percentage of the HR Technology segment of its parent company, Recruit Holdings Co., Ltd. Job posting numbers are provided for information purposes only and should not be viewed as an indicator of performance of Indeed or Recruit. Please refer to the Recruit Holdings investor relations website and regulatory filings in Japan for more detailed information on revenue generation by Recruit’s HR Technology segment.