
Key points:
- Jobseeker interest has lagged surging demand for workers in sectors like food preparation & service, construction, cleaning, loading & stocking, driving and manufacturing.
- Pay advertised in job postings has risen significantly faster in those sectors than in other areas of the economy.
After a challenging 2020 for the labour market, demand for workers has grown strongly in 2021. Job postings on Indeed UK in rebounding sectors like food, construction, cleaning, transport and distribution have grown rapidly. However, the supply of jobseekers in those sectors has not kept pace with demand, leading to reports of labour shortages.
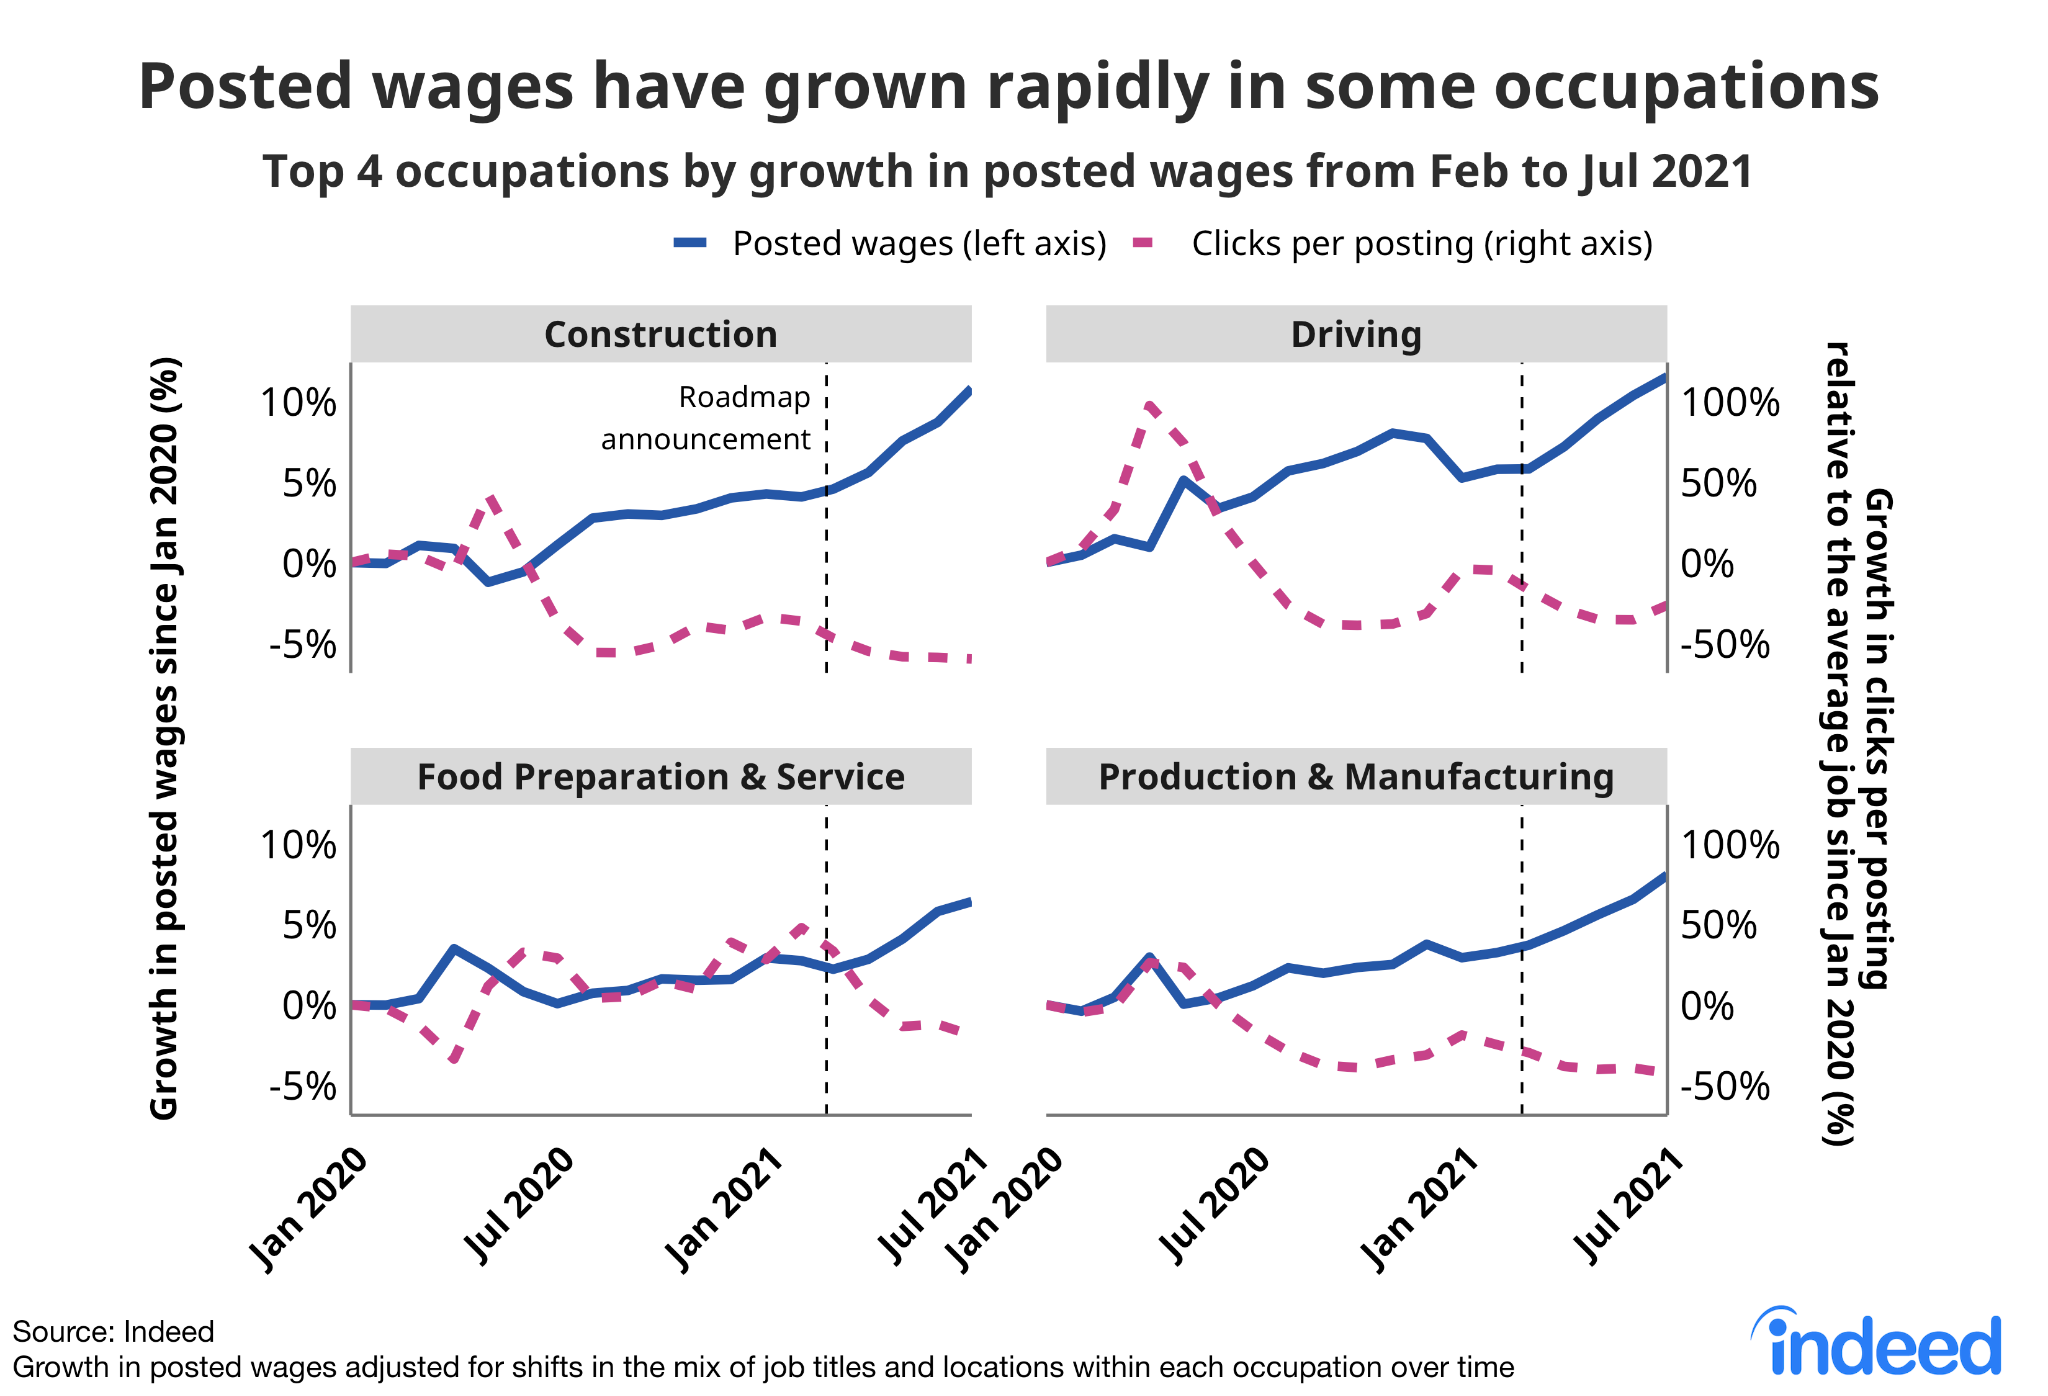
A key question is to what extent this ‘tighter’ labour market can lift pay. This is of special interest to central banks, which pay close attention to the link between wage growth and inflation. To help answer this question, we looked at data on salaries and wages advertised in over 3 million Indeed UK job postings from January 2020 to July 2021. Occupations with the biggest falls in jobseeker clicks per job posting relative to the average job have registered above-average growth in posted wages. From February to July 2021, average advertised pay grew 6.7% in construction, 5.7% in driving, 4.8% in manufacturing and 3.7% in food preparation & service vs. 0.8% for all jobs, adjusted for compositional changes. This suggests the hiring rebound is translating into upward wage pressures in some sectors of the economy.
Job postings recovered as economy reopened
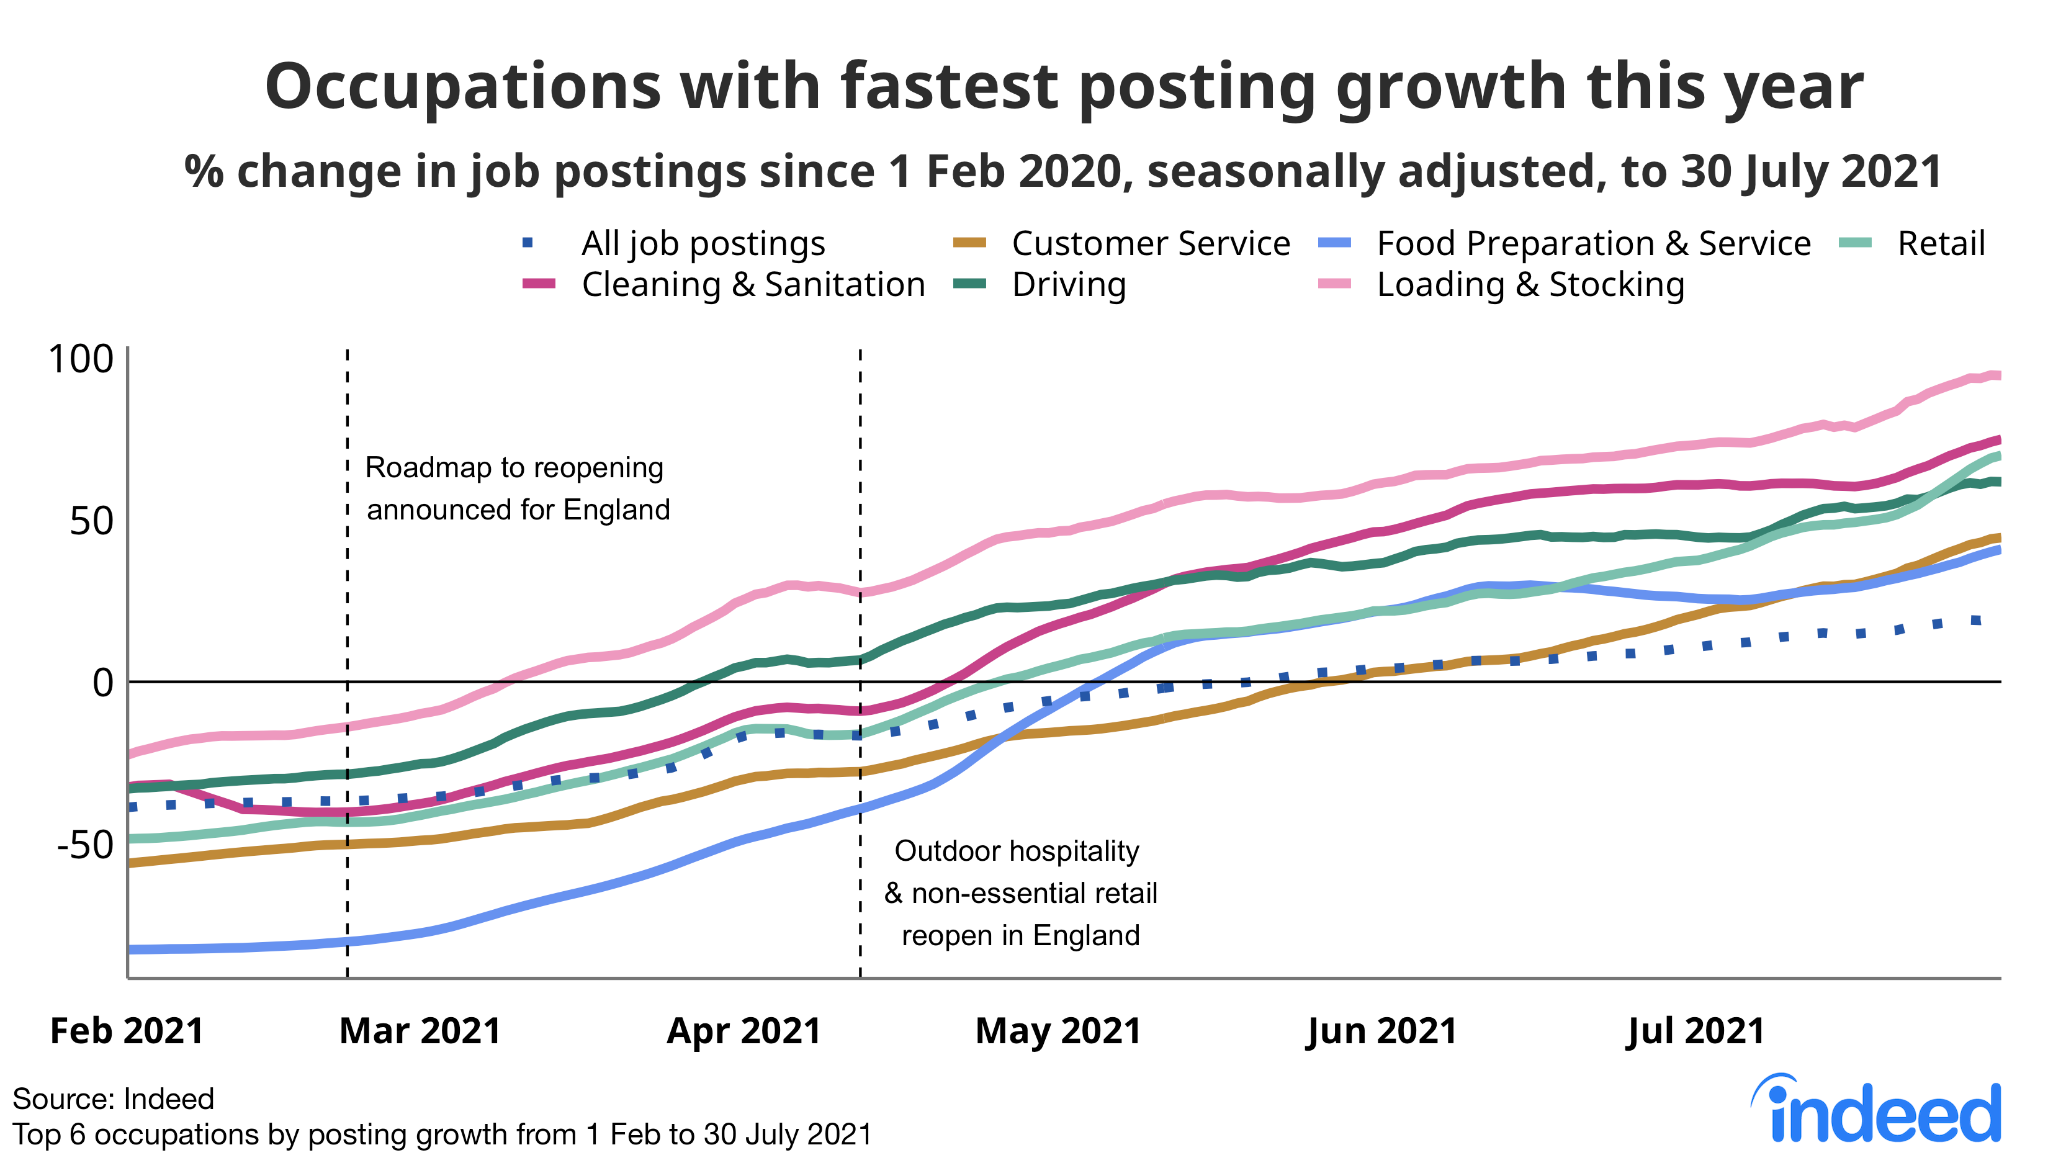
At the onset of the pandemic in early 2020, many employers reduced hiring and job postings fell sharply. Since then, postings have grown beyond their pre-pandemic levels — a sign of renewed hiring demand. Between the announcement of the roadmap to reopening in England on 22 February 2021 and the completion of the last phase of the roadmap on 19 July, UK-wide job postings jumped 83%.
Postings have increased especially rapidly in sectors boosted by the easing of social distancing rules. Among large sectors, cleaning & sanitation, customer service, driving, food preparation & service, loading & stocking and retail have grown fastest.
Rising demand for new workers in rebounding sectors outpaced jobseeker interest
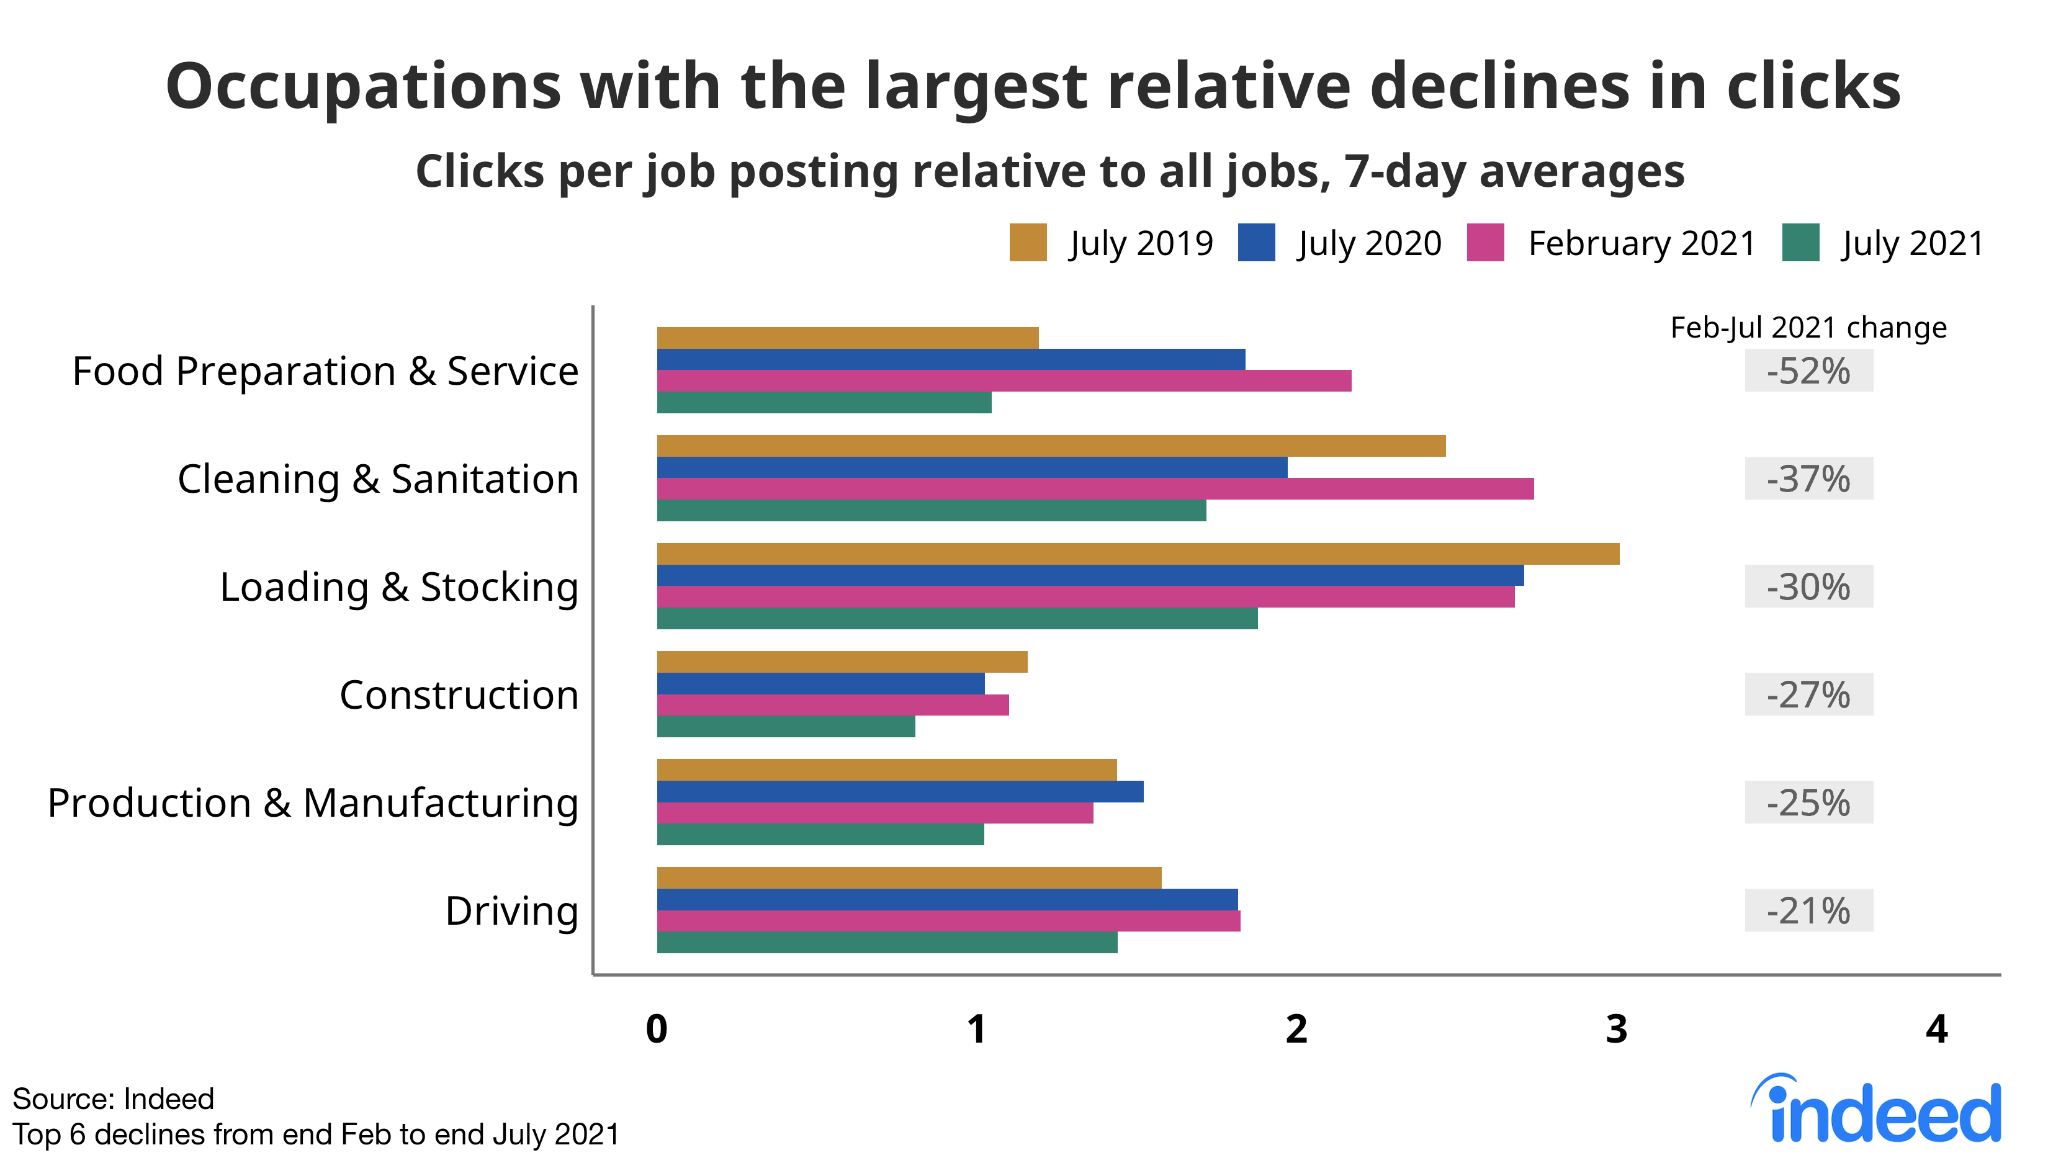
In some sectors, the resurgence of postings has not been matched by an equivalent increase in jobseeker clicks. Tracking trends in clicks per job posting in a sector is a good indicator of the potential supply of candidates relative to demand. The more people click on a job posting, the more applications the employer is likely to receive. Conversely, a fall in clicks per posting implies tighter labour market conditions that could boost wages.
Occupations where clicks per posting have fallen most relative to the average job between the end of February and the end of July this year were food preparation & service (-52%), cleaning & sanitation (-37%), loading & stocking (-30%), construction (-27%), production & manufacturing (-25%) and driving (-21%). Employers hiring for these jobs are likely to face the greatest difficulties attracting candidates. Brexit may have aggravated these problems.
Strong demand for workers has pushed up wages
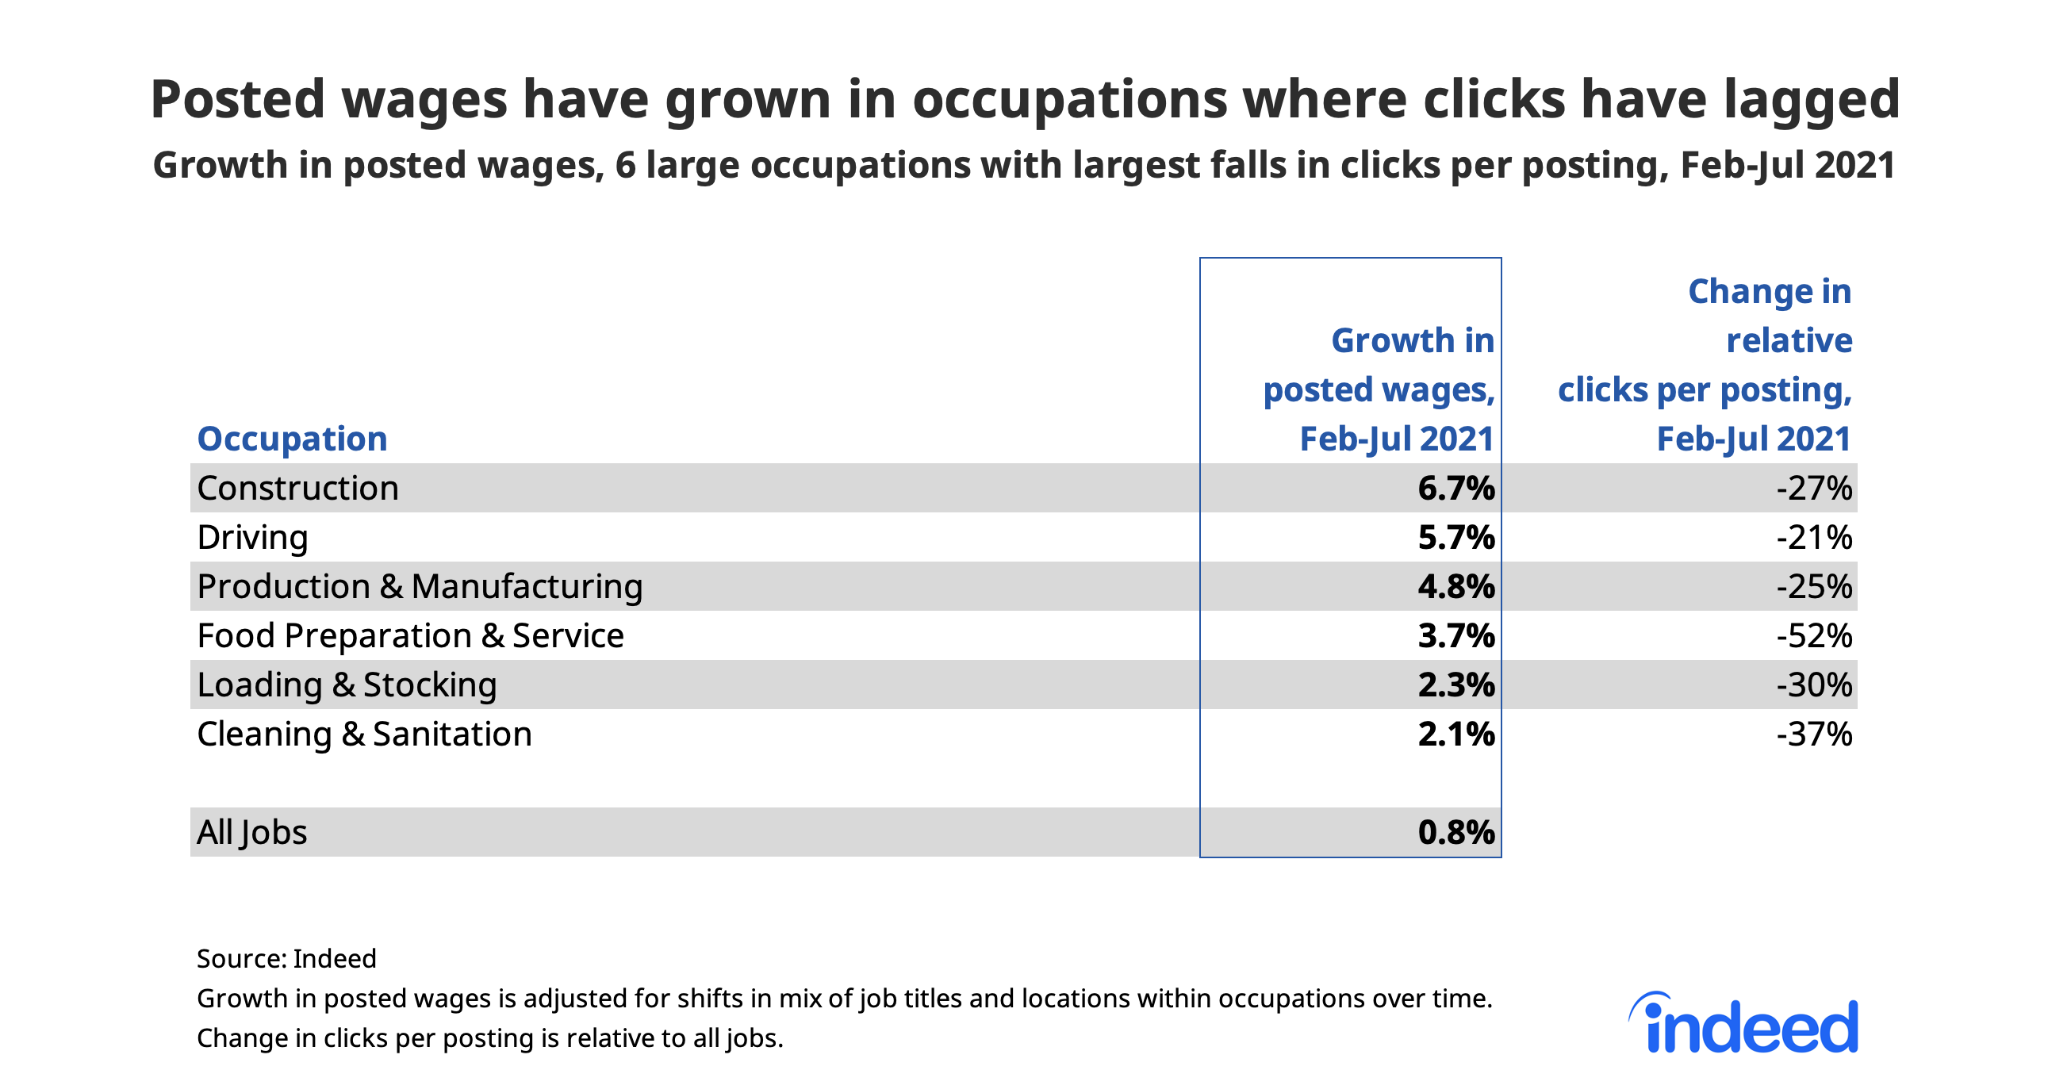
Do tighter labour markets, like those we’ve observed in some sectors in 2021, lead to higher wages? To answer this, we looked at how wages advertised in job postings in each occupation related to the number of jobseeker clicks postings in that occupation received. Our calculations adjust for shifts in the mix of job titles within each occupation and the location of jobs over time.
Between February and July this year, we found clear signs of wage growth in occupations where jobseeker clicks most lagged strong job posting growth. Among large occupations, this included 6.7% growth in posted wages in construction, 5.7% in driving, 4.8% in production and manufacturing, 3.7% in food preparation & service, 2.3% in loading & stocking and 2.1% in cleaning & sanitation. This contrasts with 0.8% average posted wage growth for all jobs.
In other work, we analyse data over a longer period, confirming that wages generally respond to increases and decreases in clicks per job posting. The response is not always immediate. It can take some time before posted wages change in response to a fall in clicks per job posting in an occupation. This could be because employers take a wait-and-see approach when setting wages or because it takes them time to realise market conditions have changed. What is unusual about the 2021 recovery is that demand for workers increased suddenly — and employers appeared to respond swiftly.
Conclusion: upward pressures on pay are limited to certain sectors
Our findings suggest some employers are raising advertised pay to attract candidates. However, upward pressure on wages advertised in job postings appears limited to a few sectors where hiring bottlenecks are most severe. The labour market is still some way from a full recovery and this may be dampening wage growth in many sectors of the economy.
This post draws on our working paper entitled “Job Creation During the Pandemic”.
Methodology
We used data on job postings and jobseeker clicks on Indeed UK from January 2019 to July 2021. Clicks per posting are expressed relative to the average job.
Job posting trends in the first chart are the percentage changes in seasonally adjusted postings since 1 February 2020 using a seven-day trailing average, like in our job posting tracker. 1 February 2020 is our pre-pandemic baseline. We seasonally adjust each series based on historical patterns in 2017, 2018 and 2019. Each national and sector trend is seasonally adjusted separately. This information is based on publicly available information on the Indeed UK website, is limited to the UK, is not a projection of future events, and includes both paid and unpaid job solicitations.
Wage and salary data are extracted from job postings. When a range is mentioned, we use the midpoint of the range. We excluded wages expressed as “up to” or “from” a certain amount since it was not possible to identify the full range in those cases (5% of salary data).
Wage growth figures were calculated using regression analysis that accounted for shifts in the mix of job titles and job locations within each sectoral category over time. Differences in wage growth between each of the top six occupations by decline in clicks per posting and all other jobs are statistically significant at the 1% level.