Key points
- Job postings on Indeed UK are already above pre-pandemic levels in some parts of the country as the economy reopens.
- Postings have recovered most in Northern and Midlands cities and large towns, while London, cities in the South and tourist locations lag, often significantly.
- Differences in the pace of hiring recovery appear related to the sectoral composition of postings, with recovery fastest in cities with higher shares of manufacturing, distribution, healthcare and education jobs, while areas reliant on hospitality, tourism and highly paid, white-collar, work-from-home jobs trail.
- Urban areas where the claimant count rate is high and job posting recovery is slow are in greatest need of policy support.
Last week’s much-awaited reopening of many gyms, pubs, restaurants and nonessential shops boosted labour market activity. Total job postings on Indeed UK remain 16% below their pre-pandemic level as of 9 April, but postings in some parts of the country have already exceeded that benchmark. An Indeed/Centre for Cities ranking of 63 UK cities and large towns by job posting recovery finds that the gap between the best- and worst-performing urban areas is wide and is correlated with the sectoral composition of local economies.
Cities and large towns in the North and Midlands lead job posting recovery
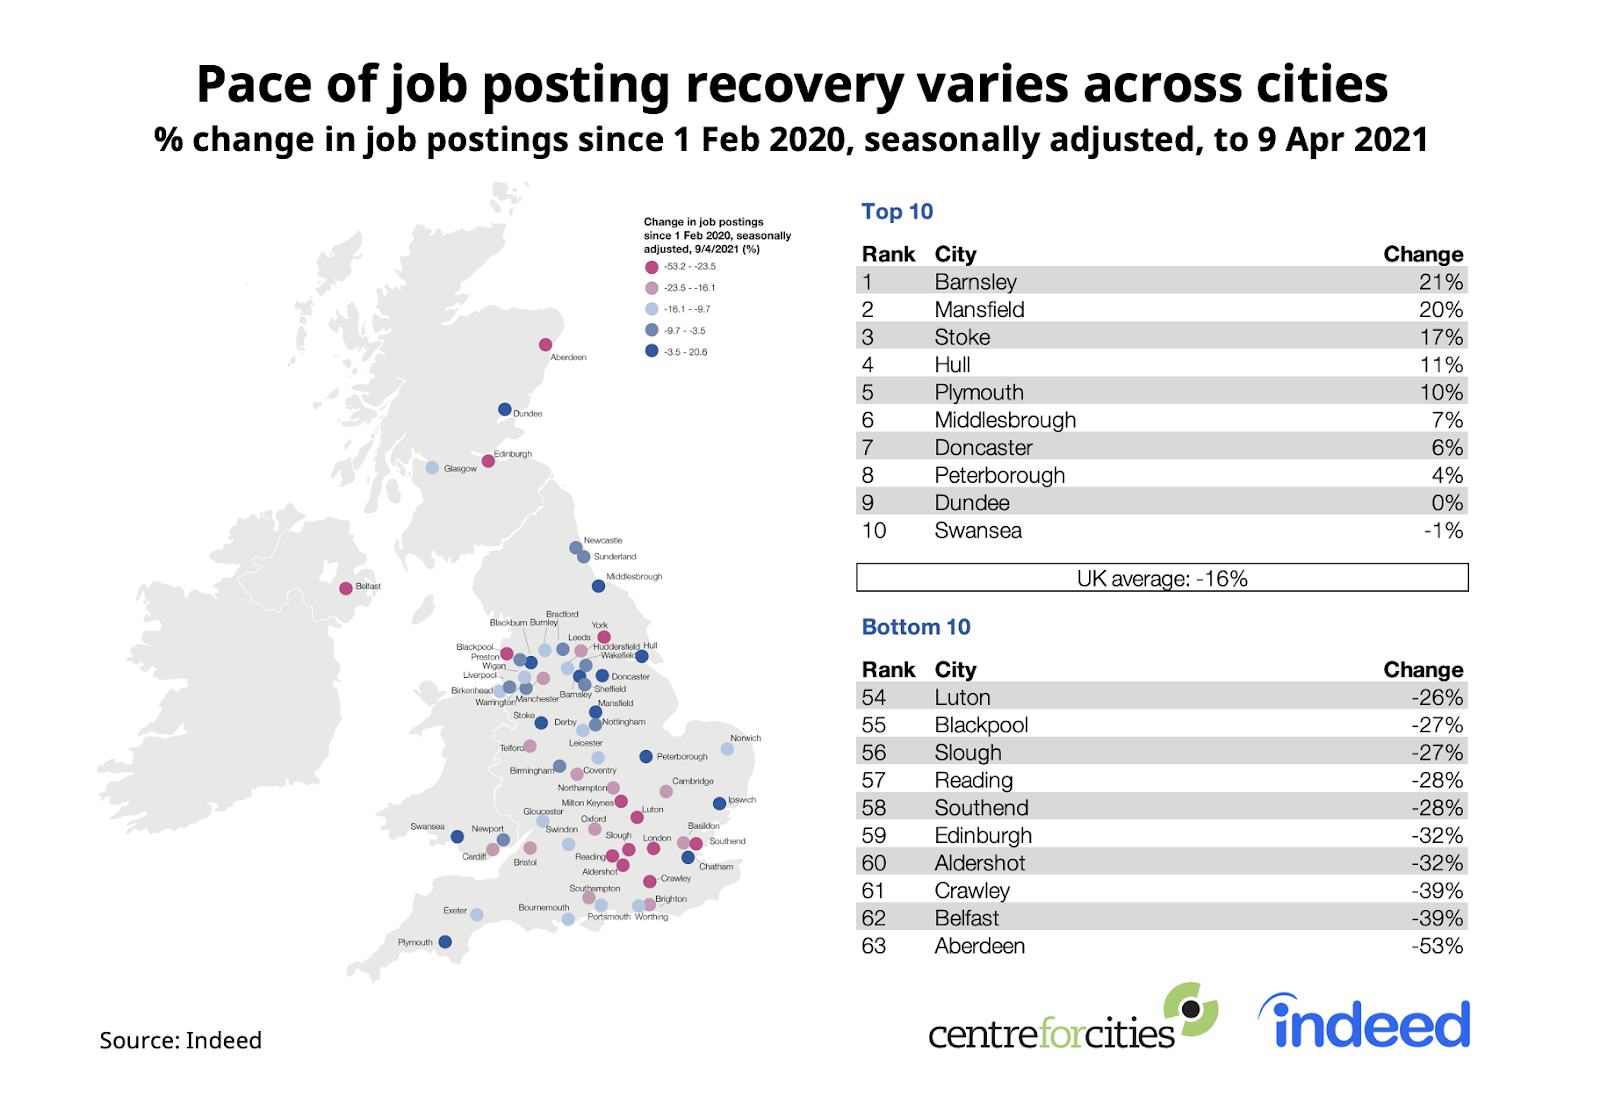
Cities and large towns in the North and Midlands have so far witnessed the strongest job posting recoveries (see Figure 1). In nine cities and large towns — led by Barnsley, Mansfield and Stoke — there are more job postings now than before the pandemic.
In contrast, cities elsewhere are lagging. Aberdeen, Belfast and Crawley are the three urban areas where job postings have recovered least. Other cities and large towns predominantly in the South East of England are also recovering slowly. London is among the cities with the weakest recovery. Job postings in the capital are still 26% below their pre-pandemic level, making it 11th from the bottom among the 63 cities.
Figure 1: Job posting recovery as of 9 April 2021
Posting recovery is fastest in manufacturing and distribution hubs
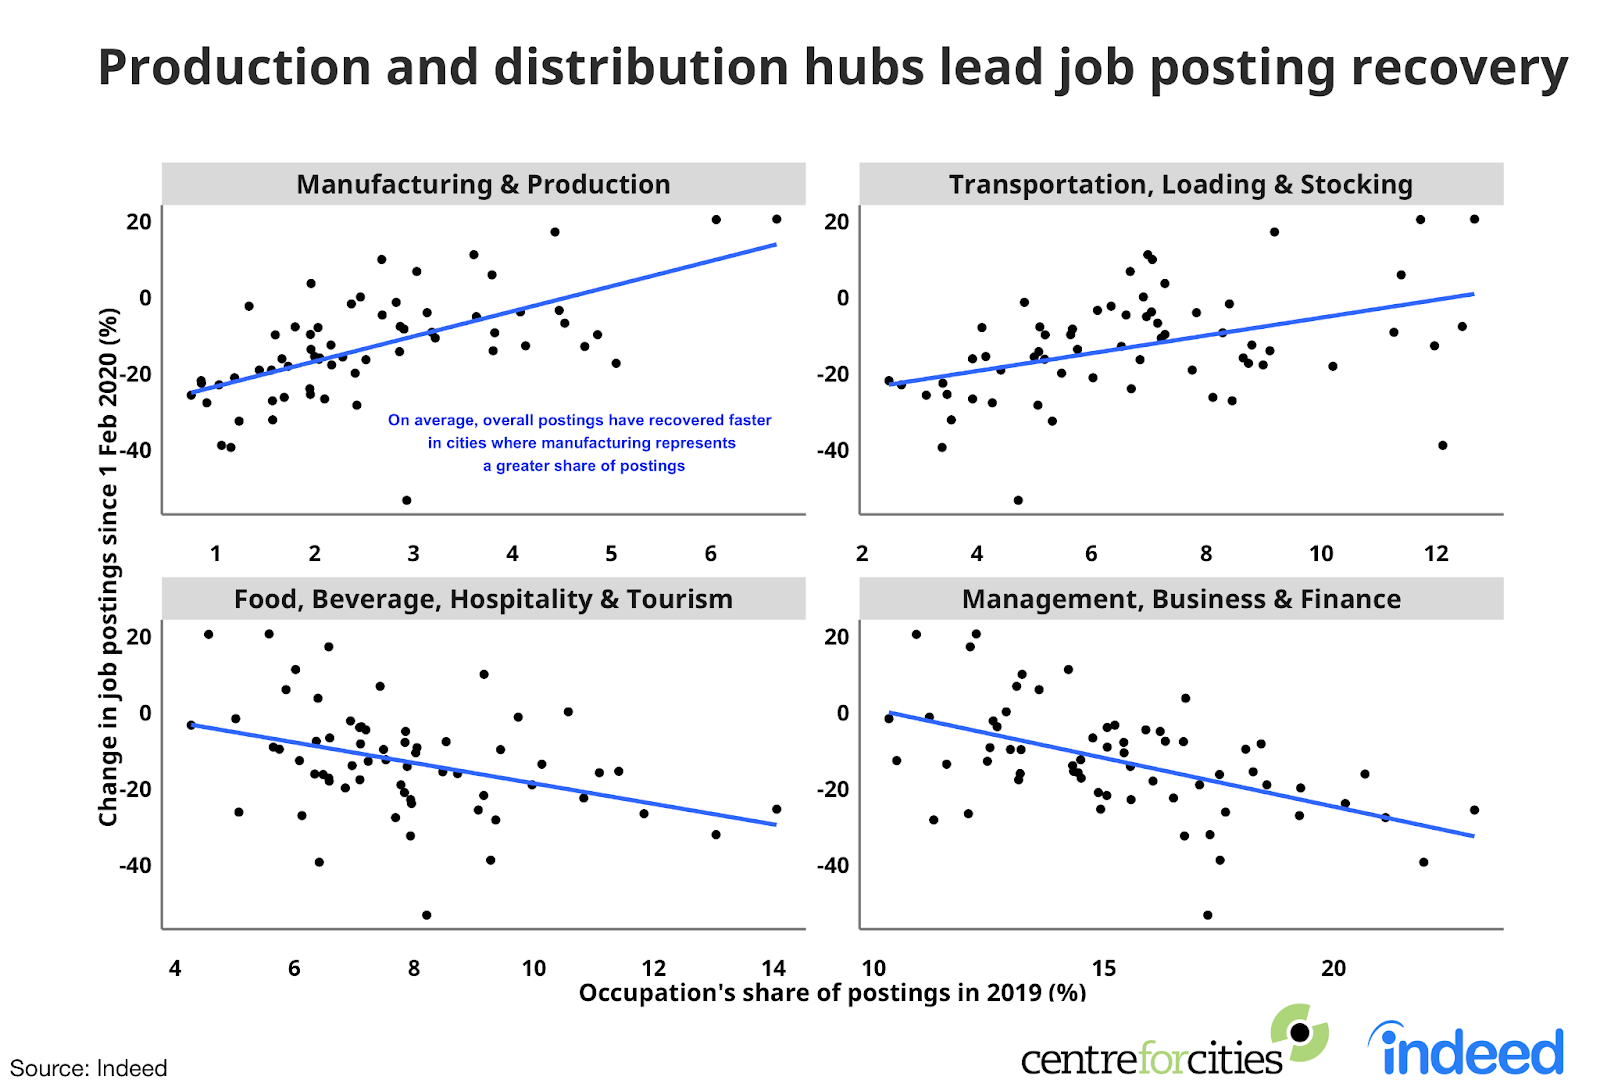
Differences in job posting recoveries among cities are linked to sectoral variations in employment (see Figure 2). To assess this, we looked at the correlation between posting growth in each urban area and the pre-pandemic share of job postings by occupation. Places where job postings have recovered most had greater pre-pandemic shares of postings in occupations related to the production and distribution of goods, such as manufacturing, driving and loading & stocking, as well as essential services like healthcare, social care and education.
In contrast, places with higher shares of pre-pandemic job opportunities in food & beverage service and hospitality & tourism are trailing in overall posting growth. Two reasons are possible. First, despite the partial reopening of those sectors, many businesses are operating below full capacity due to restrictions on indoor activity. Second, those sectors had also furloughed large shares of their workforces. As some businesses reopen, they may be recalling former staff instead of hiring new workers.
Job postings are also recovering slowly in places that had higher pre-pandemic posting shares in high-paid occupations that involve working from home — like management, business & finance and tech, data & science. These patterns hold even after taking city size into account.
Figure 2: The relationship between job posting and selected occupations
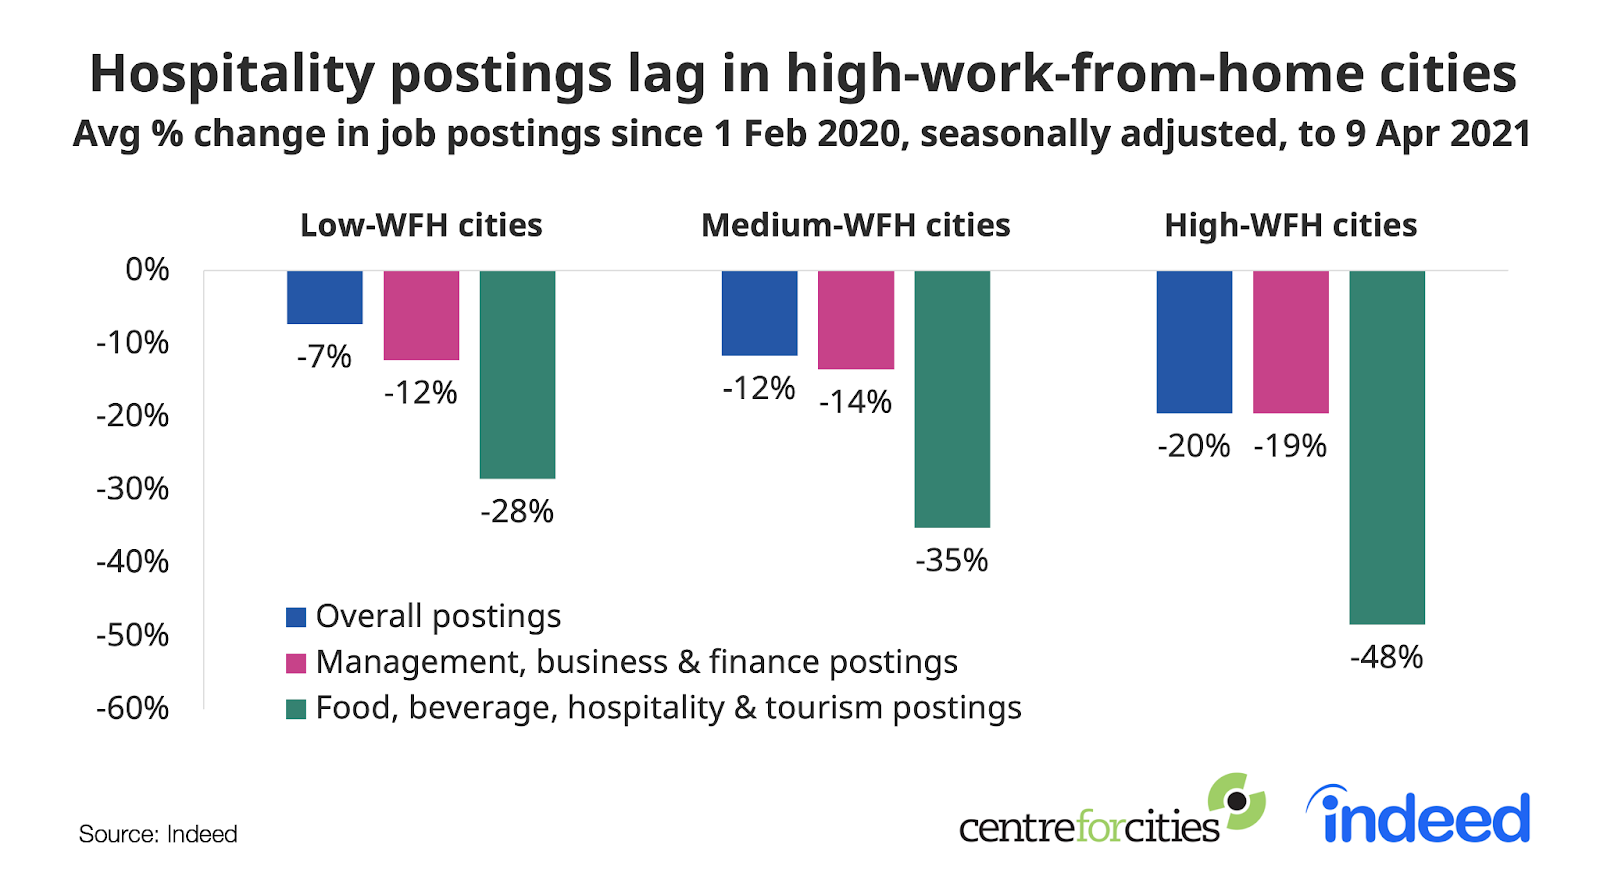
There appears to be a link between a high share of postings in managerial, business and finance occupations and the slow recovery of hospitality postings. During the pandemic, many people in managerial occupations shifted to working from home. That in turn may be slowing hiring for hospitality jobs that typically cater to office workers in city centres. Figure 3 shows that, in urban areas with high propensities for working from home, job postings are still 20% below their 1 Feb. 2020 level, with hospitality job postings substantially further behind. In contrast, in urban areas with low propensities for working from home, postings are only 7% below pre-pandemic levels. This suggests job postings in high work-from-home urban areas will not fully recover until workers return to offices.
Figure 3: Job posting recovery in different sectors in different cities based on work-from-home propensity
Urban areas with weak job posting recoveries and high claimant count rates face the biggest challenges
The interaction between job posting recovery and the claimant count rate — a measure of the number of people claiming benefits primarily because they’re unemployed — is an indication of the health of local labour markets (see Figure 4).
Figure 4: Claimant count rate and job posting recovery by city
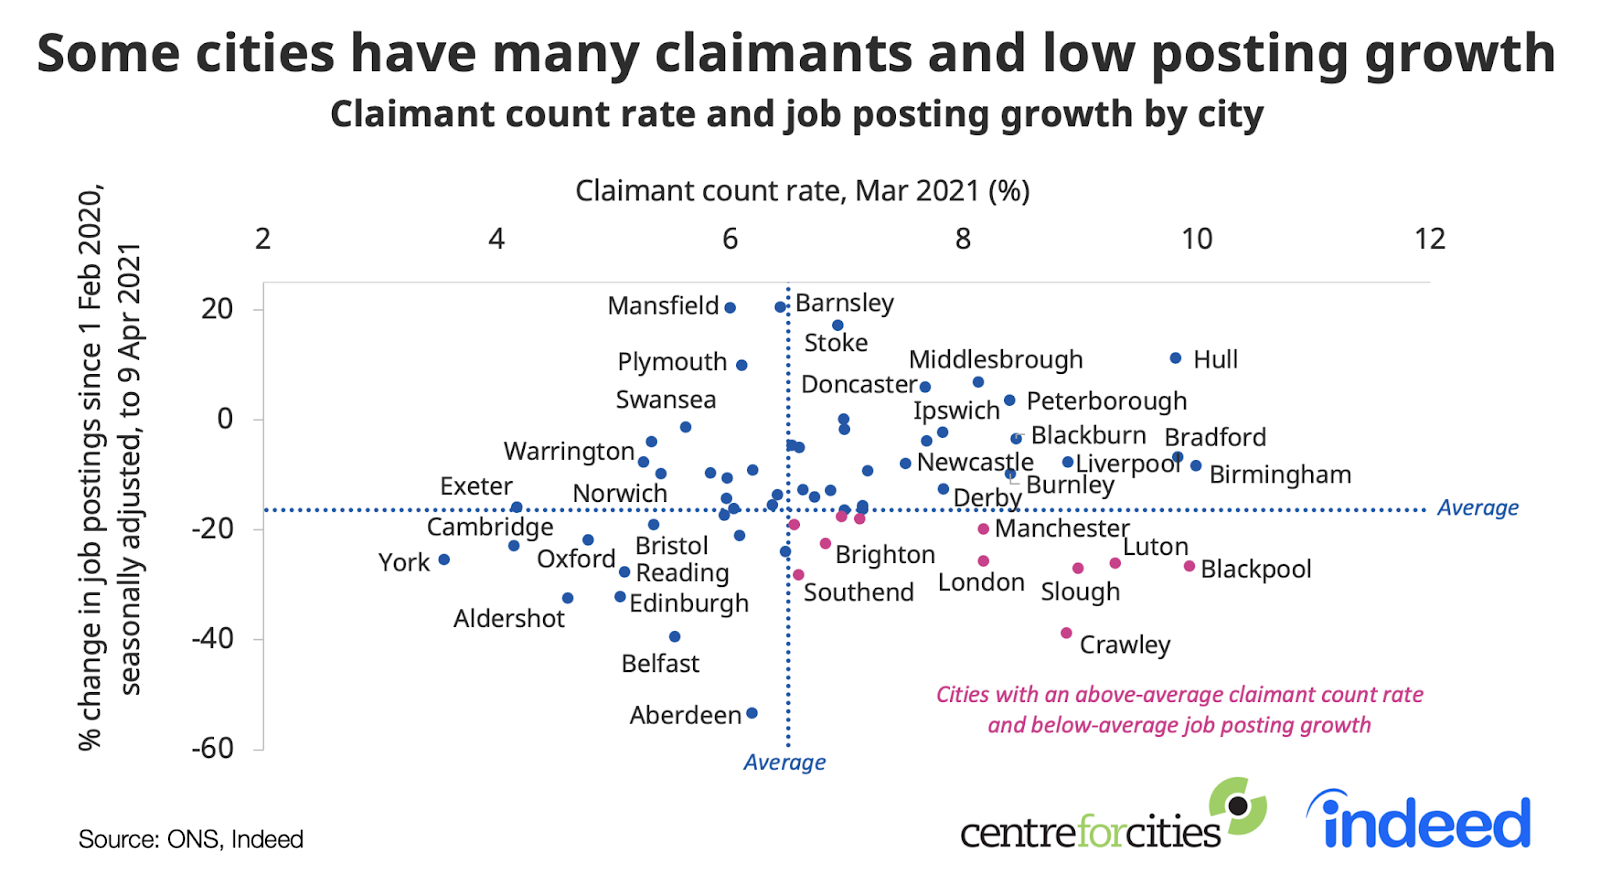
On one hand, in some cities, such as Mansfield, Swansea and Warrington, claimant count rates are low and job postings have mostly returned to pre-pandemic levels. These places appear to have been relatively sheltered — or have largely recovered — from the economic impact of COVID-19.
On the other hand, the pandemic hit some urban areas harder. They can be grouped into three categories based on the challenges they currently face:
- Cities and large towns with slow job posting recovery but low claimant count. This group includes cities such as Oxford, Reading and Aldershot, urban areas with relatively stronger economies going into the pandemic and high propensities for working from home. The low claimant count rates in these places suggests they have been relatively protected from pandemic effects, perhaps because many workers have continued to work from home. Slow posting recoveries could signal a challenge for policy in the longer term, particularly if workers do not return to offices and postings in supporting services sectors do not bounce back fully.
- Cities and large towns with high claimant counts and high job posting growth. Cities in this group include Hull, Middlesbrough and Bradford — places where economic performance was weak even before the pandemic hit. Recruitment activity in these places has picked up, but claimant counts remain higher than average. This could be because these cities had high claimant rates before the pandemic or it could be a signal of mismatches in the labour market between available jobs and worker skills. Policy interventions in these areas might seek to connect unemployed people with the opportunities available in their local areas.
- Cities and large towns with high claimant counts and low job postings. This category is a mix of places. Some, like Crawley and Slough, rely heavily on the aviation industry. Others, like Blackpool and Brighton, depend on tourism. Cities like London and Manchester are both tourist attractions and places with high work-from-home propensity. The pandemic has hit these places hardest. In London and Manchester, the return of workers to offices might be all that’s needed to unlock labour markets. But in Crawley, whose main sector has been hit hard by the pandemic and travel restrictions, government support may be required, both in creating jobs and supporting employment and skills training for those who have lost jobs.
The events of the past year have played out differently across the country. With the economy now gradually reopening, urban labour markets are likely to continue to change fast. Local job posting and claimant count rate trends will bear careful monitoring in the coming months.
This post was published concurrently on the Centre for Cities blog.
Methodology
We aggregated job postings by Primary Urban Area — a measure of the built-up area of a city — based on the location of the job. We used Primary Urban Areas in our analysis because they provide a consistent measure of economic activity in urban areas across the UK. A complete list is available here.
All job posting figures are percentage changes in seasonally-adjusted job postings since 1 Feb. 2020, our pre-pandemic baseline, using a 7-day trailing average. We seasonally adjust each series based on historical patterns in 2017, 2018 and 2019. Each series, including the national trend and city trends, is seasonally adjusted separately. More information on the methodology is available here.
Job posting information is based on publicly available information on the Indeed UK website, is limited to the UK, is not a projection of future events and includes both paid and unpaid job solicitations.