
Key Points:
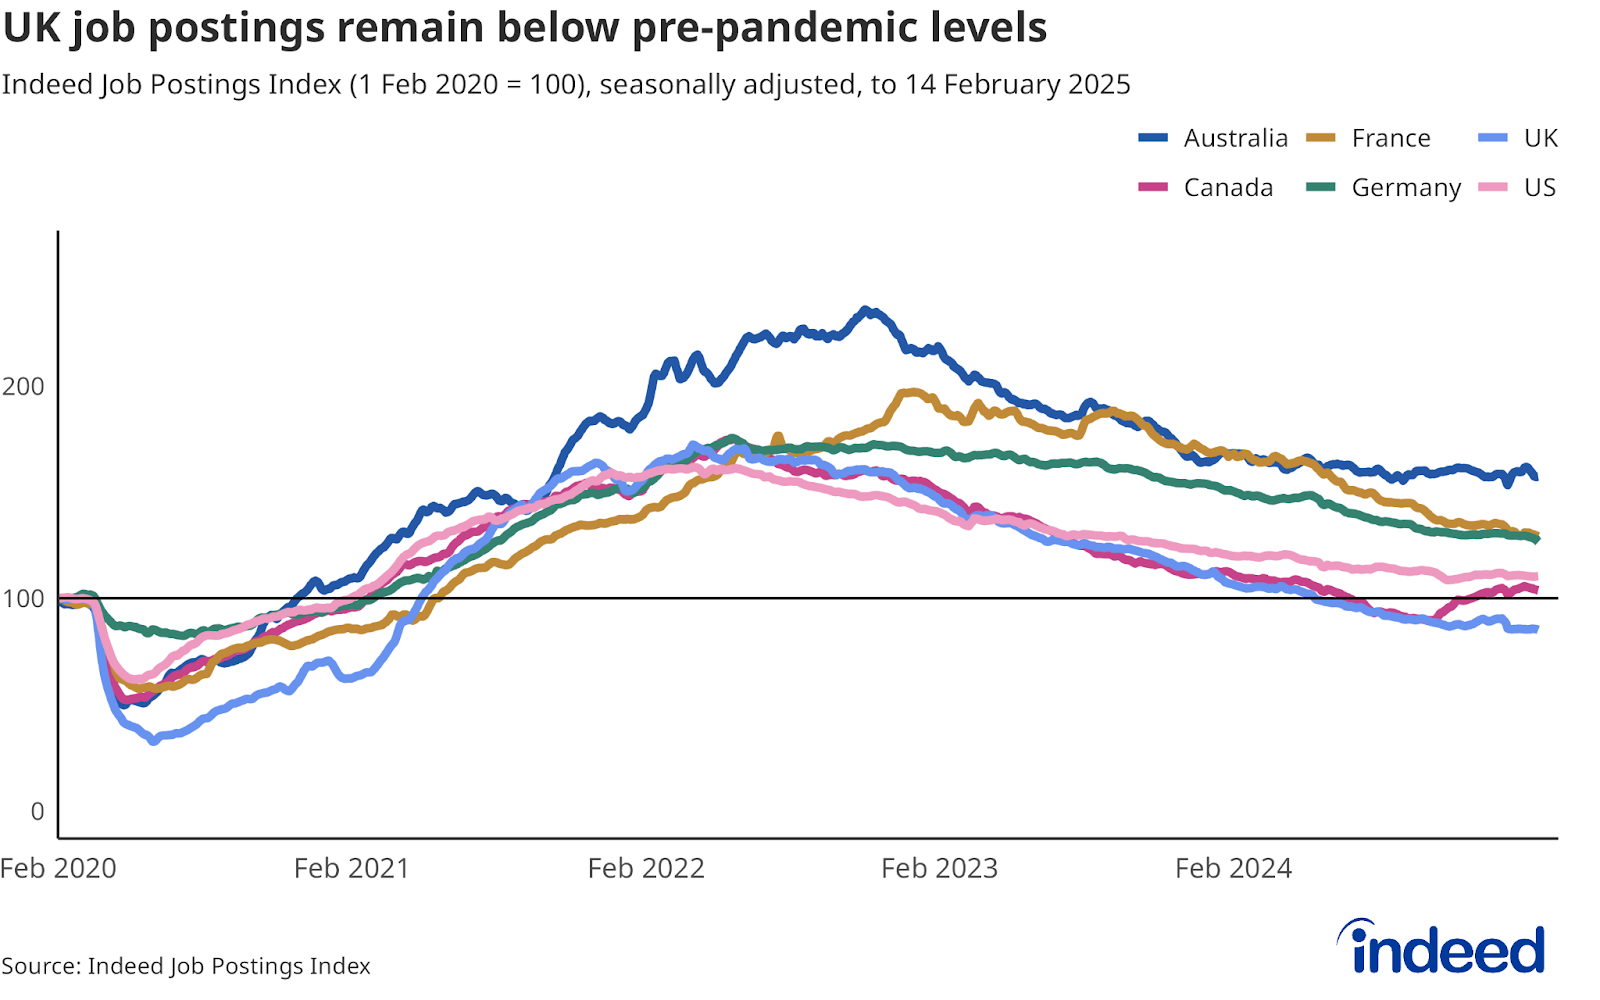
- As of 14 February, UK job postings were 15% below their pre-pandemic baseline, a similar level to before last October’s Budget.
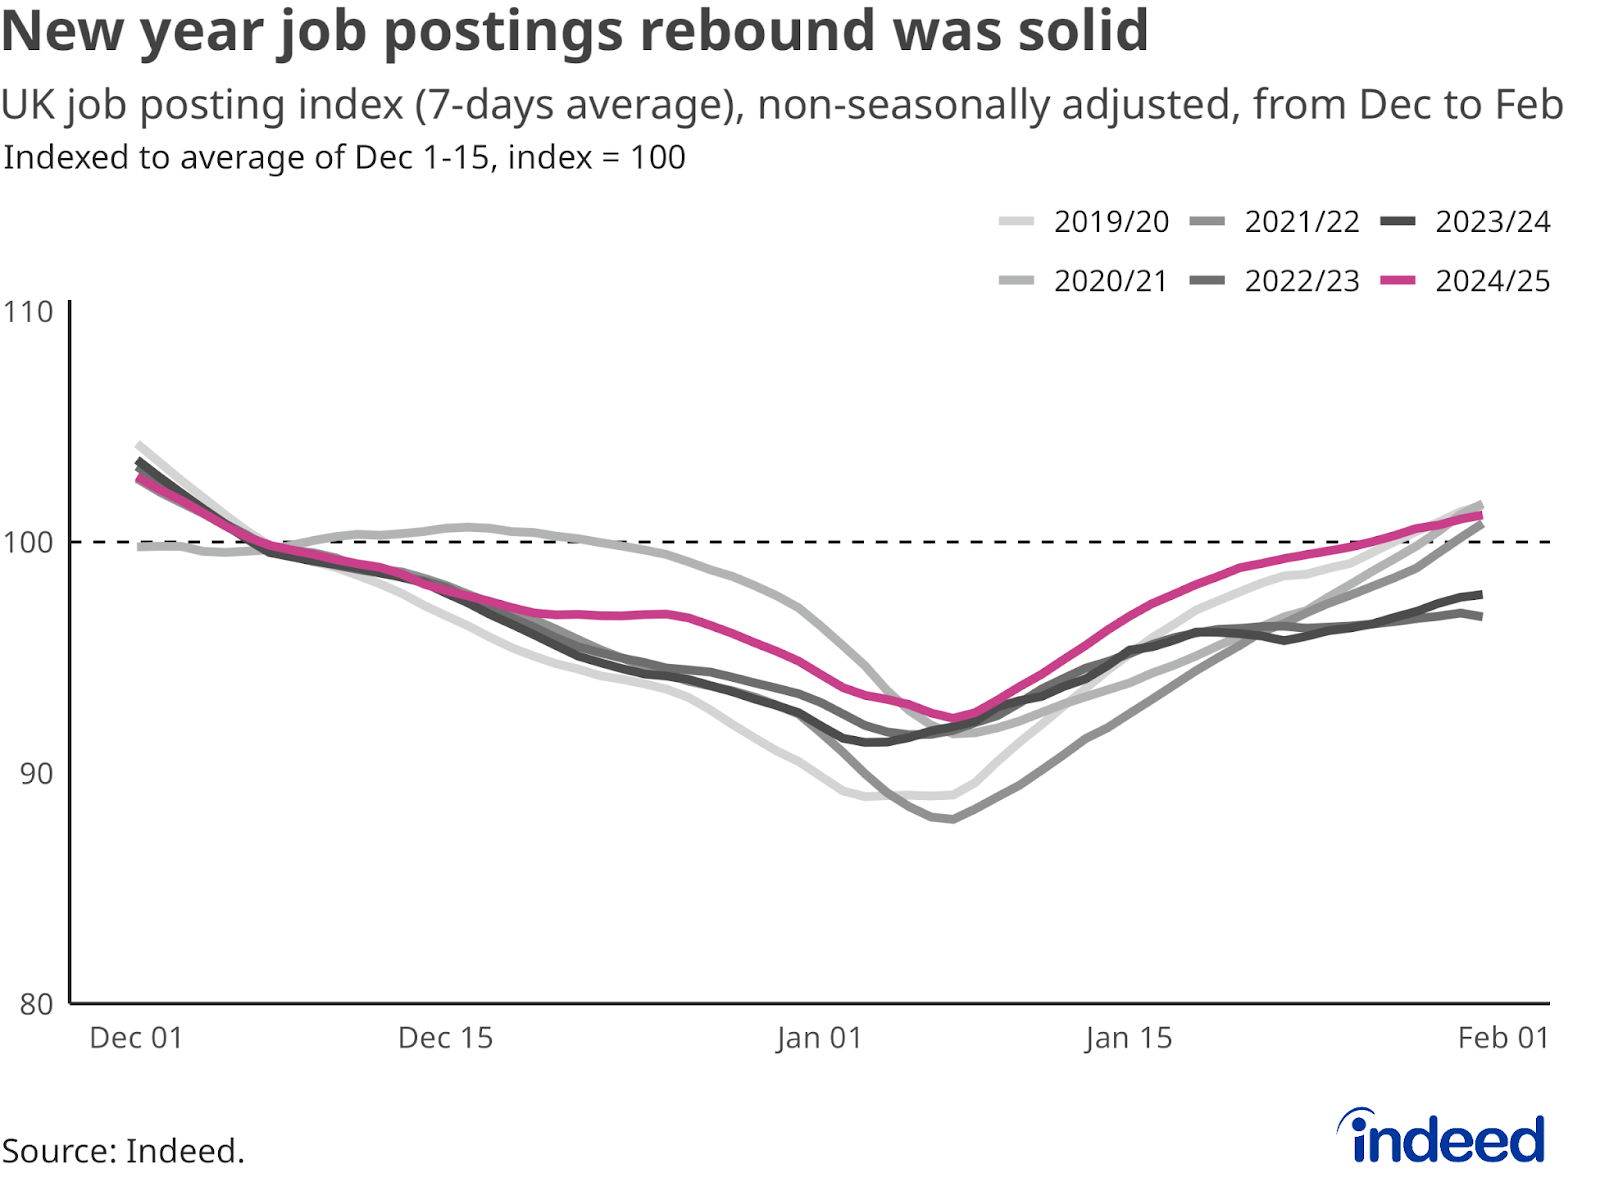
- Postings saw a decent new year rebound after the traditional holiday’s lull.
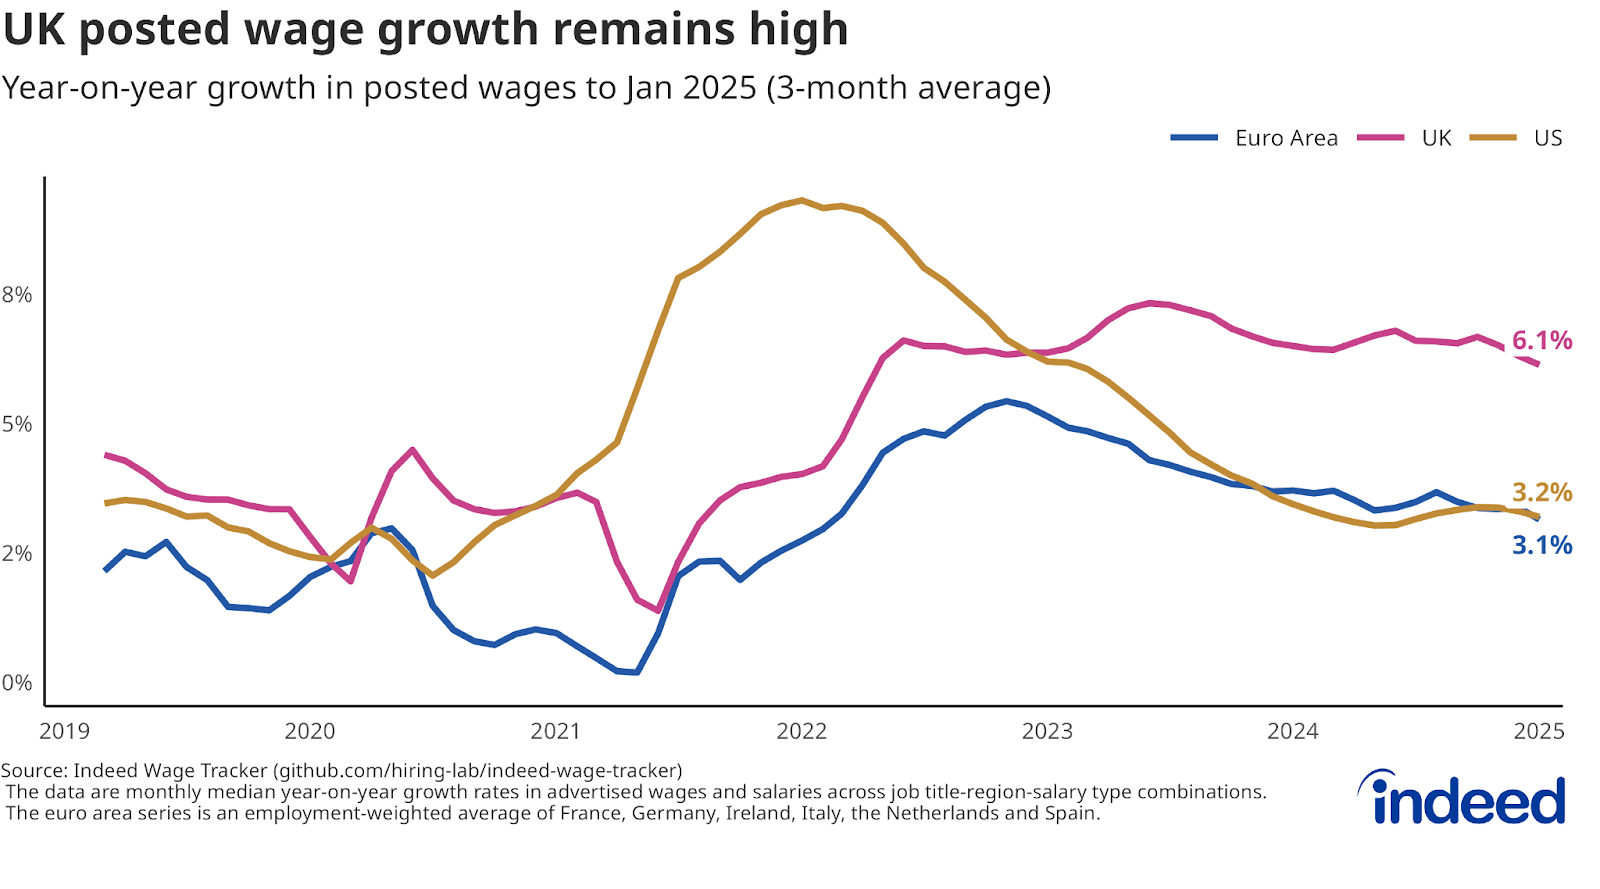
- Posted wage growth remains stubbornly high.
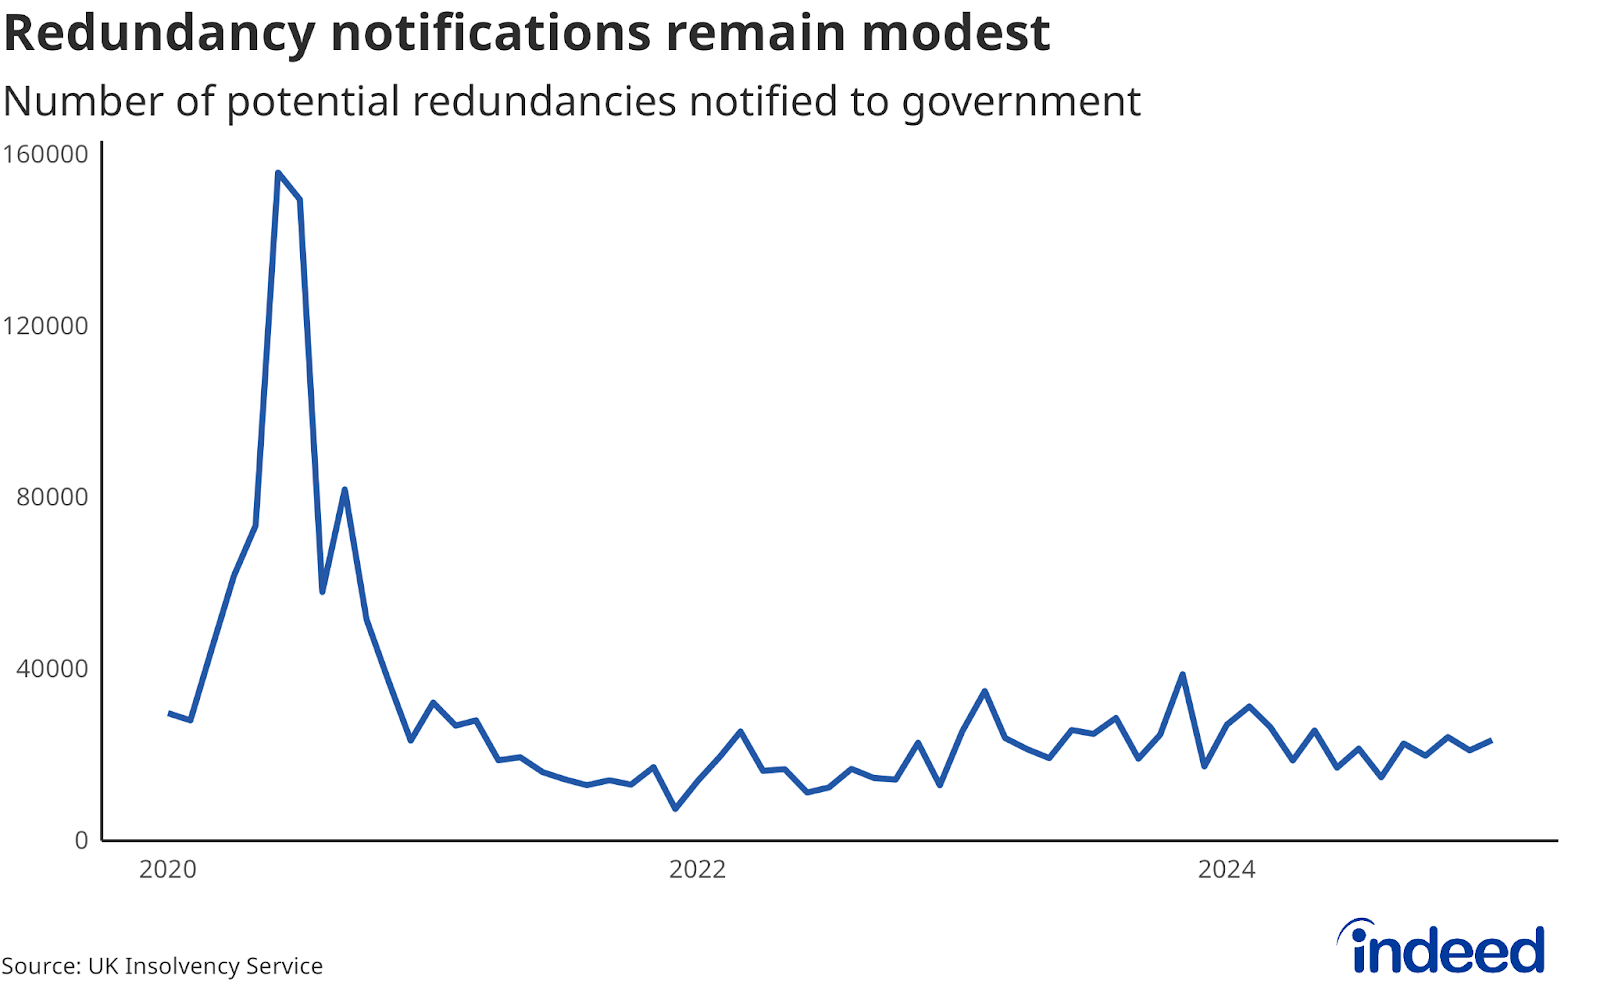
- Redundancy notifications remain modest despite warnings of planned job cuts.
Our Labour Market Updates use Indeed and other labour market data to examine important trends. Our European Labour Market Overview chartbook provides a more comprehensive view of the European labour market. Other data, including the Indeed Wage Tracker, are regularly updated and can be accessed on our data portal.
The UK labour market has been holding steady in recent weeks as employers brace for April’s impending rise in employment costs. Companies continue to sit on their hands amid an uncertain economic outlook, with many probably waiting to see how things pan out before committing to any major expansion plans. But while the mood music from businesses remains downbeat, there are few signs of a broader shakeout in the job market, for now. And after the traditional slowdown around the holidays, job postings rebounded in January, indicating a degree of underlying resilience in hiring demand. The key question is whether that remains the case over the coming months, or if weak business sentiment begins to translate into a renewed slowdown.
UK job postings continue to lag but aren’t getting any weaker
Though UK job postings remain at low levels, they, at least, have not sunk further in recent weeks. As of 14 February, postings were 15% below their 1 February 2020 pre-pandemic baseline, similar to where they stood around the time of the Budget back in late October. The UK Job Postings Index (JPI) continues to lag peer economies. Australia, Canada, France, Germany and the US all continue to see job postings above their pre-pandemic baseline.
Businesses continue to warn of adverse employment consequences stemming from increased employment costs due in April, as the National Insurance hike and minimum wage rise kick in. But while few employers feel confident about dialling up hiring, they also haven’t been pulling back further. This is consistent with official vacancies data, which show a recent stabilisation.
New year rebound in job postings was solid
UK job postings typically dip over the holiday season and then build momentum in January as recruitment plans kick into gear. This year followed the usual pattern, with postings rebounding to their early December level by early February. Given the headwinds ahead of April, it might not have been surprising if the start of this year had been more sluggish, as was the case in 2023/24. The fact that this year’s rebound was stronger than the past few is moderately encouraging, though postings were starting from a low base.
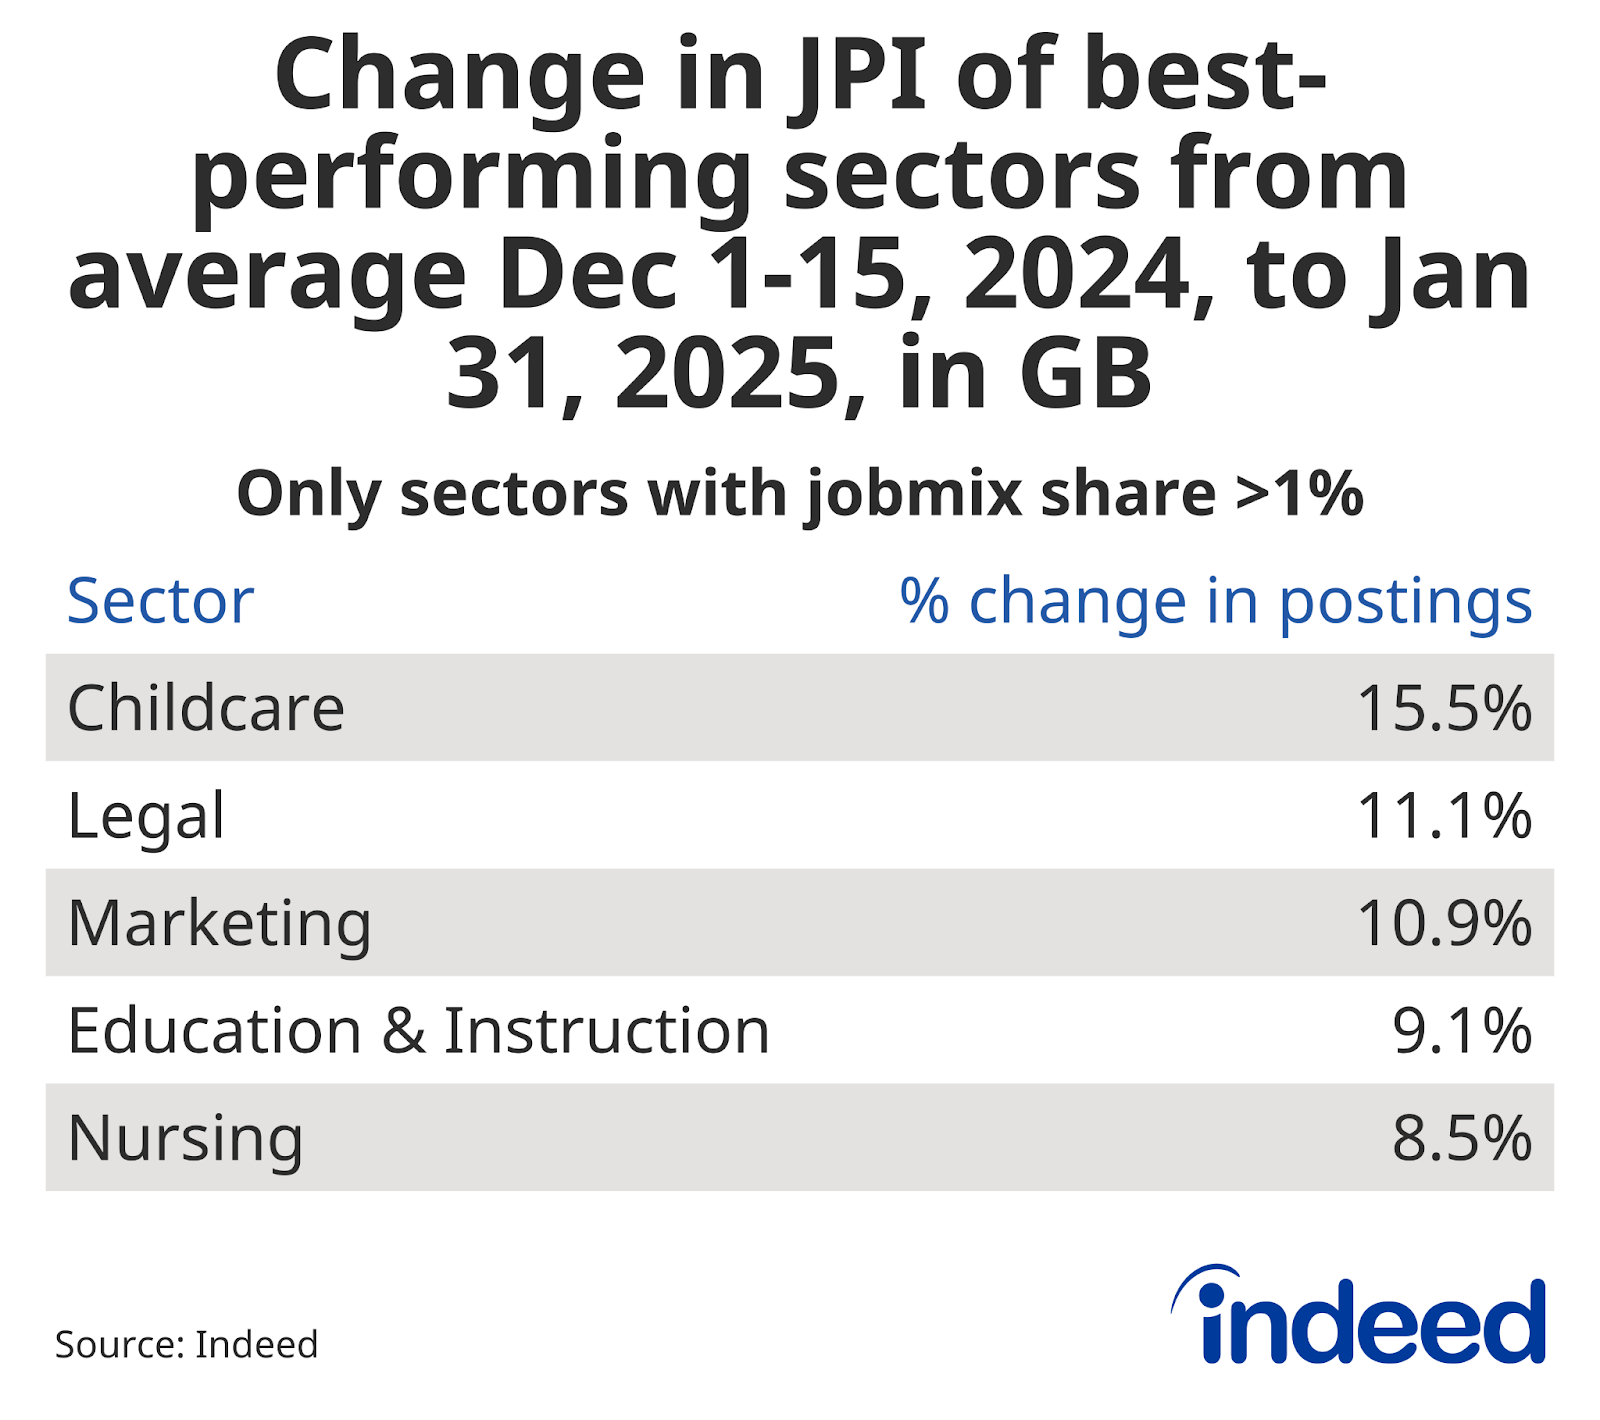
Some categories started the new year with a spring in their step, led by childcare, legal and marketing. Public sector-driven categories like education & instruction and nursing also saw growth.
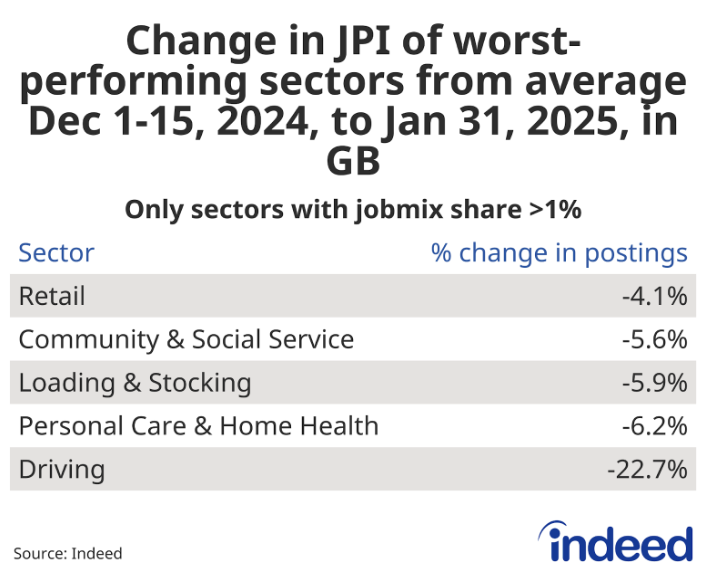
Conversely, occupations linked to the retail sector had a weak start to the year, with driving, loading & stocking and retail job postings all seeing declines that lasted well into the new year. Postings were also down in the personal care & home health and community & social service sectors.
Conversely, occupations linked to the retail sector had a weak start to the year, with driving, loading & stocking and retail job postings all seeing declines that lasted well into the new year. Postings were also down in the personal care & home health and community & social service sectors.
Wage growth remains high
The latest official labour market figures showed strong wage growth at around 6% in December. That corresponds with the Indeed Wage Tracker, which signalled 6.1% year-on-year growth in posted wages as of January. Though it has dipped slightly from recent peaks, wage growth is still running at roughly double the level consistent with the Bank of England’s 2% inflation target, presenting a headache for monetary policymakers. The annual pace of wage growth is also about twice as fast in the UK as in the US and euro area. This rapid growth, while a challenge for policymakers, is good for workers struggling to keep up with inflation, who are seeing 3.4% annual real terms pay growth.
Redundancy notifications remain low despite warnings of job cuts
Though businesses have warned of possible job cuts ahead of April’s changes, that has not yet translated into a meaningful uptick in redundancy notifications (When more than 20 redundancies are proposed, UK employers are required to notify the government at least 30 days prior to those cuts being enacted). Whether that remains the case will be a bellwether for the UK labour market and the wider economy’s prospects. At least one Bank of England policymaker has suggested that excess labour hoarding by businesses may be one explanation for the labour market’s behaviour to date. If that’s true, then an unwinding could spell bad news.
Conclusion
While the UK job market remains subdued and below pre-pandemic levels, it is showing some resilience. Hiring demand is not weakening further, and the new year rebound in job postings was solid in some sectors. Ahead of April, the labour market is in something of a holding pattern. The key question is whether it can avoid a heavy landing once the policy changes come into force.
Hiring Lab Data
Job postings data is available on our Data Portal. We also host the underlying job-postings chart data on Github as downloadable CSV files. Typically, it will be updated with the latest data one day after this blog post is published.
Methodology
Data on seasonally adjusted Indeed job postings are an index of the number of seasonally adjusted job postings on a given day, using a seven-day trailing average. Feb. 1, 2020, is our pre-pandemic baseline, so the index is set to 100 on that day. We seasonally adjust each series based on historical patterns in 2017, 2018, and 2019. We adopted this methodology in January 2021.
To calculate the average rate of wage growth, we follow an approach similar to the Atlanta Fed US Wage Growth Tracker, but we track jobs, not individuals. We begin by calculating the median posted wage for each country, month, job title, region and salary type (hourly, monthly or annual). Within each country, we then calculate year-on-year wage growth for each job title-region-salary type combination, generating a monthly distribution. Our monthly measure of wage growth for the country is the median of that distribution.
The number of job postings on Indeed.com, whether related to paid or unpaid job solicitations, is not indicative of potential revenue or earnings of Indeed, which comprises a significant percentage of the HR Technology segment of its parent company, Recruit Holdings Co., Ltd. Job posting numbers are provided for information purposes only and should not be viewed as an indicator of performance of Indeed or Recruit. Please refer to the Recruit Holdings investor relations website and regulatory filings in Japan for more detailed information on revenue generation by Recruit’s HR Technology segment.