
Key points:
- Australia’s job market remained tight in 2025, but key metrics weakened, led by sluggish employment growth and an increase in the unemployment rate.
- Labour productivity remained disappointing throughout 2025, with no sign that adoption of artificial intelligence (AI) is delivering a productivity dividend.
- Demand for AI-related skills continues to grow, with 5.8% of Australian job postings mentioning AI in their job descriptions at the end of December — double the rate from a year earlier.
Australia’s job market is by no means weak – many key measures remain strong by historical standards – but it clearly entered a different phase last year. Whether that continues in 2026 will depend heavily on one industry: healthcare & social assistance.
2025 in Review
While Australia’s labour market remains tight by historical standards, conditions soured and cracks emerged throughout 2025. The Australian unemployment rate rose, employment growth slowed and imbalances between labour demand and supply eased.
Here are some highlights from the past year:
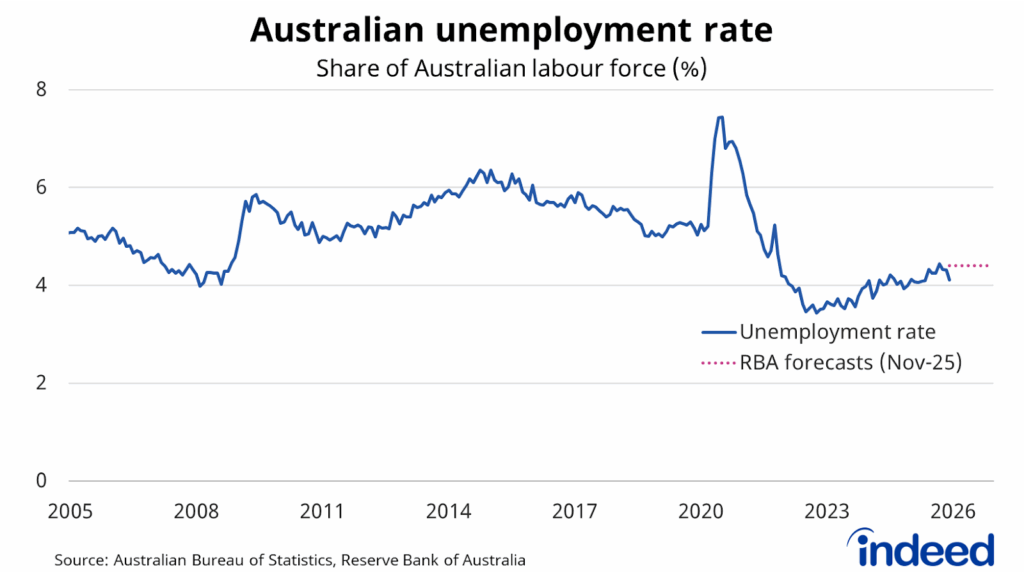
- The unemployment rate finished the year at 4.1% – not much changed compared to a year earlier – but peaked as high as 4.4% during the year.
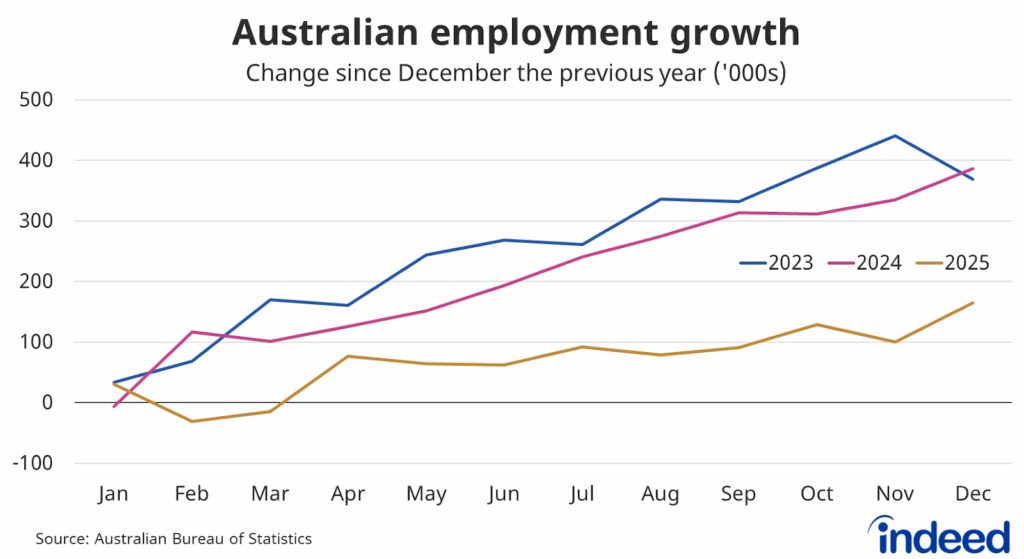
- Australian employment rose by just 165,400 people during 2025, well below the gains in 2024 (386,000) and 2023 (369,000).
- Australia’s participation rate reached a record high of 67.2% in January, but finished the year 0.5 percentage points lower at 66.7%.
- Annual wage growth remained impressive at 3.4%, but inflation-adjusted wages were little changed.
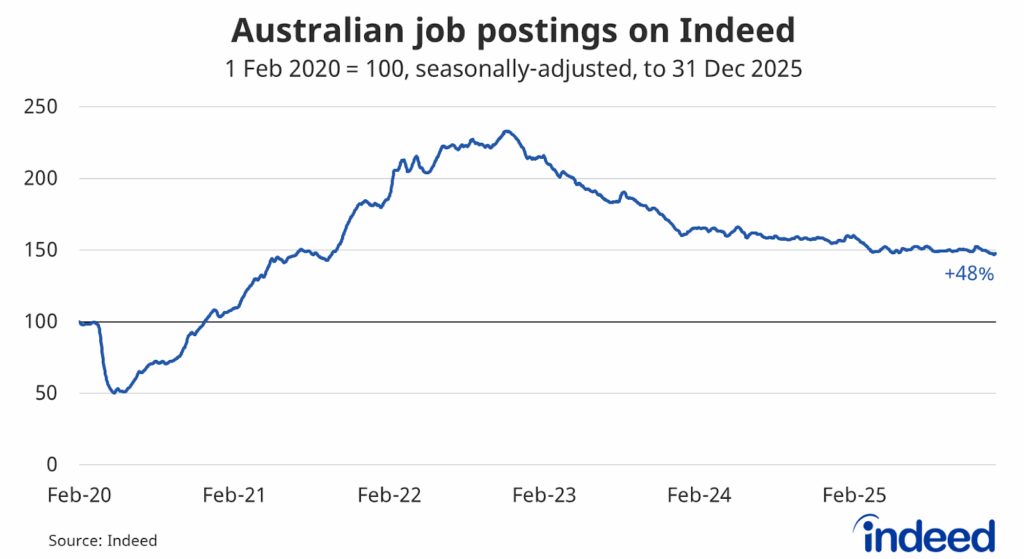
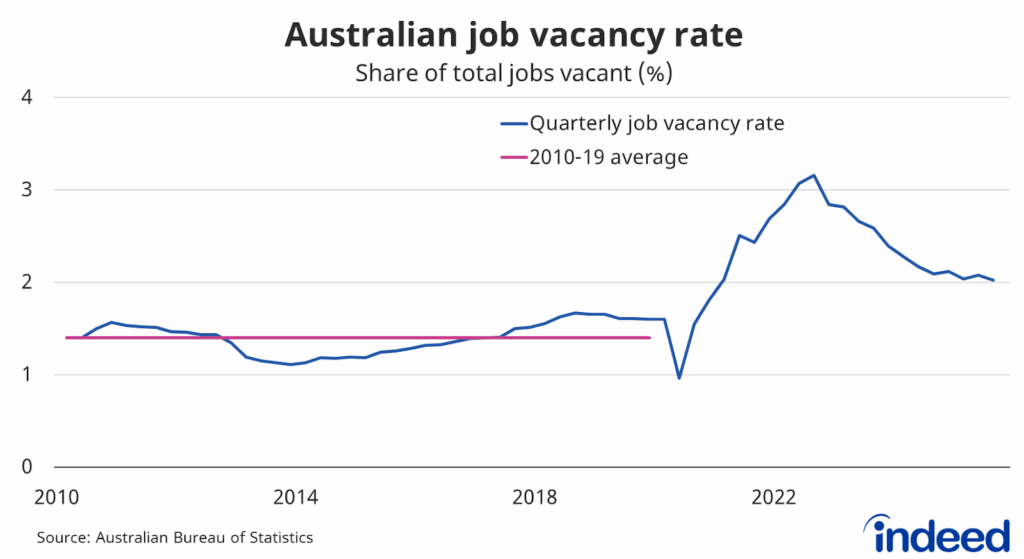
- Measures of unfilled labour demand remained strong, with the job vacancy rate at 2.0% – compared with a 2010 to 2019 average of 1.4% – and Indeed job postings still 48% above its pre-pandemic baseline.
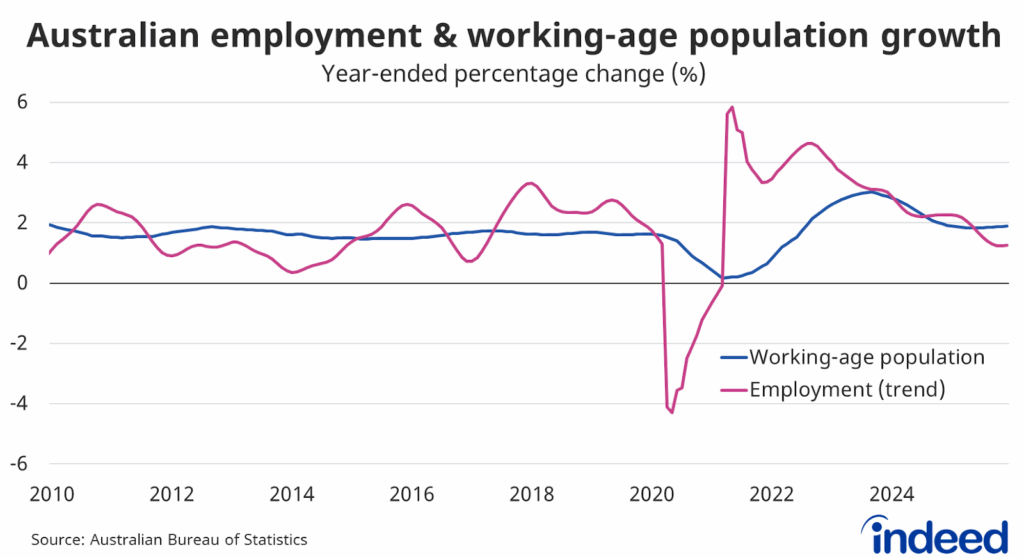
- Australia’s working age population – those aged 15 and over – rose 1.9% in 2025, slower than the year before, but easily outpacing employment growth of 1.2%.
Employment: All about healthcare
Australian employment growth slowed considerably throughout 2025, starting the year on a rough note and never truly recovering. By year-end, Australian employment had increased by 165,400 people, falling well short of the 386,000 and 369,000 people gains in 2024 and 2023, respectively.
Australia’s post-pandemic job boom was driven by healthcare & social assistance. The expansion of the National Disability Insurance Scheme (NDIS) and Australia’s ageing population created tremendous demand for doctors and nurses, along with disability and aged care workers.
Over the past five years, the number of jobs in healthcare & social assistance has increased by around 670,000 positions, an annualised rate of 6.3% a year, accounting for more than a quarter of job gains over that period.
However, momentum in the healthcare & social assistance industry slowed considerably last year. Jobs rose by just 34,000 – an annual rate of just 1.4% – dragging down nationwide job growth. Around 80% of the slowdown in job growth over the past year can be attributed to the healthcare & social assistance industry.
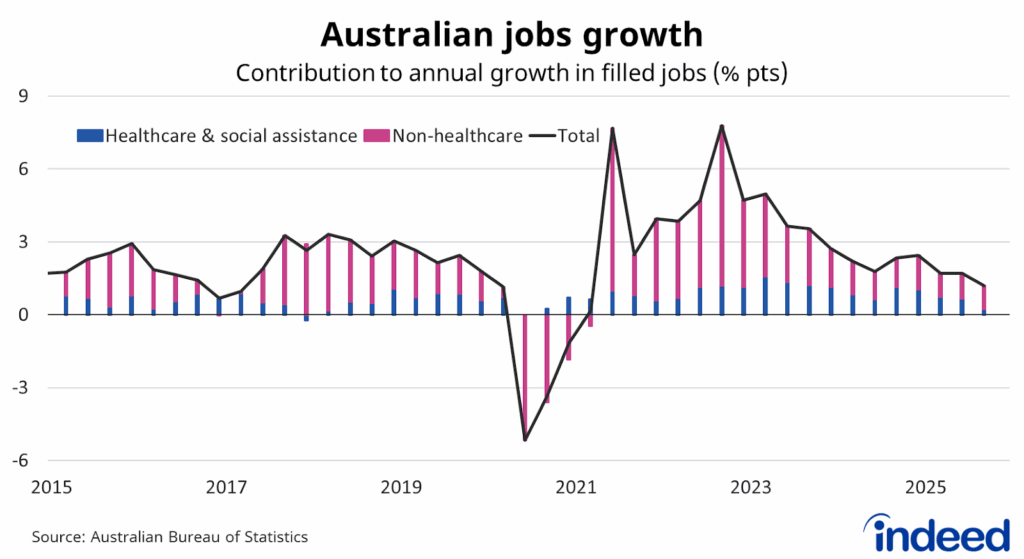
Line and bar graph titled “Australian jobs growth” shows that Australian job growth slowed last year, with around 80% of the decline due to weaker growth in healthcare & social assistance jobs.
A key question for 2026 is whether growth in healthcare & social assistance rebounds, and if not, whether the rest of the economy can fill in the gap.
It’s hard to imagine job gains in healthcare & social assistance remaining weak for long, given Australia’s ageing population and care needs. Jobs and Skills Australia forecasts employment in healthcare & social assistance will be the fastest-growing industry over the next decade, with registered nurses and aged/disability carers among the fastest-growing occupations.
More recently, signs of increased business investment suggest more Australian businesses are preparing to expand their operations, requiring additional staff. A boost to employment growth in non-healthcare industries would help keep unemployment low in 2026.
Can unemployment stay low in 2026?
With employment growth slowing, it was only a matter of time before Australian unemployment rose. And it did, before unexpectedly tumbling at the end of the year. The unemployment rate ended the year at 4.1%, little changed over the year, after peaking at 4.4% in September.
The Reserve Bank of Australia (RBA) expects the unemployment rate to rise to 4.4% this year. But that forecast may prove optimistic given current employment trends. Unless employment growth accelerates considerably, the unemployment rate will likely rise above the RBA’s forecast.
In fact, it’s perhaps surprising that the unemployment rate didn’t increase further given how sharply employment growth slowed. Over the past year, Australian employment grew 1.2%, while the working-age population expanded by 1.9%. Recently, we’ve had the largest negative gap since early 2017, excluding the pandemic.
Australian population growth remains robust, both by historical standards and compared to its global peers. Australia continues to attract talent from overseas, leading to population growth unmatched by the United States, Canada, the United Kingdom or New Zealand.
When growth in the working-age population exceeds employment growth, the unemployment rate typically rises, as we saw during the second half of last year, at least until December. However, a third component complicates that relationship: labour force participation.
Australia’s labour force participation rate – the share of the working-age population either employed or actively seeking employment – reached a record high in January last year. At that point, Australia’s workforce was more diverse than it had ever been before in terms of gender, age, ethnicity and disability. Since then, the participation rate has drifted lower, ending the year 0.5 percentage points below its peak.
Labour force participation varies for many reasons. Changes in demographics, such as an ageing population, might push the participation rate lower. Cost-of-living pressures or changing attitudes to flexible work arrangements may also impact participation, as we’ve seen in recent years.
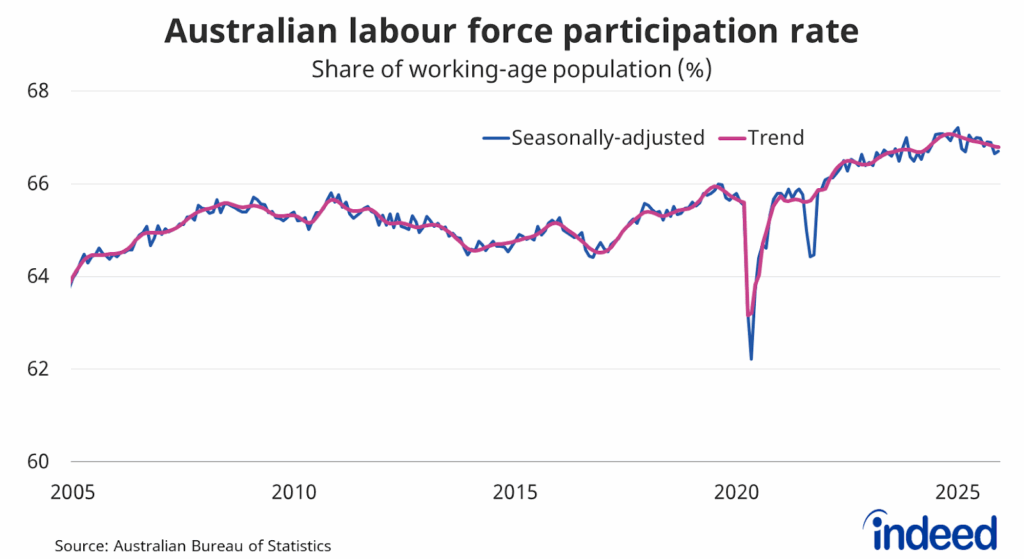
In isolation, a falling participation rate places downward pressure on the unemployment rate, while a rising participation rate puts upward pressure on it. Australia’s unemployment rate is currently around 0.6 percentage points lower than it would have been had participation been unchanged this year, suggesting that the Australian labour market is perhaps not as tight as it first appears.
Labour demand remains elevated
Given softer employment growth, the ongoing strength of job vacancy and job posting measures is somewhat surprising. On Indeed, Australian job postings fell 5.7% in 2025, finishing the year 48% above their pre-pandemic baseline.
Job postings remain above pre-pandemic levels in 94% of occupation categories. Exceptions include pharmacy (-8.3%), media & communications (-8.0%) and beauty & wellness (-5.5%). Around 12% of occupations have posting volumes more than double pre-pandemic levels, led by cleaning & sanitation (+169%), logistic support (+155%), personal care & home health (+154%), loading & stocking (+141%), food preparation & service (+107%) and therapy (+102%).
Similar trends appear in Australian Bureau of Statistics measures. The national job vacancy rate is currently 2%, meaning that 2% of available jobs across Australia are unfilled. While that number has fallen from its peak, it is still 45% above the 2010 to 2019 average of 1.4%.
The vacancy rate varies considerably across industries, from as high as 3.8% in mining and 2.9% in accommodation & food services to as low as 0.6% in agriculture and 1.0% in education & training. Crucially, vacancy rates remain above historical averages in every industry except for financial & insurance services. And in the case of industries such as utilities and accommodation & food services, vacancy rates remain more than double historical trends.
Quite simply, there are still many jobs across Australia that remain unfilled, which usually bodes well for future employment growth and the unemployment rate. That said, the combination of slow employment growth and elevated vacancies in 2025 suggests employers had difficulty filling roles last year. If that persists, then employment growth won’t bounce back in 2026.
Cost-of-living pressures remain a problem
Inflation roared back to life in the second half of 2025 and is expected to remain elevated throughout 2026. Many economists, as well as financial markets, expect the RBA to hike the cash rate this year, intensifying existing cost-of-living pressures.
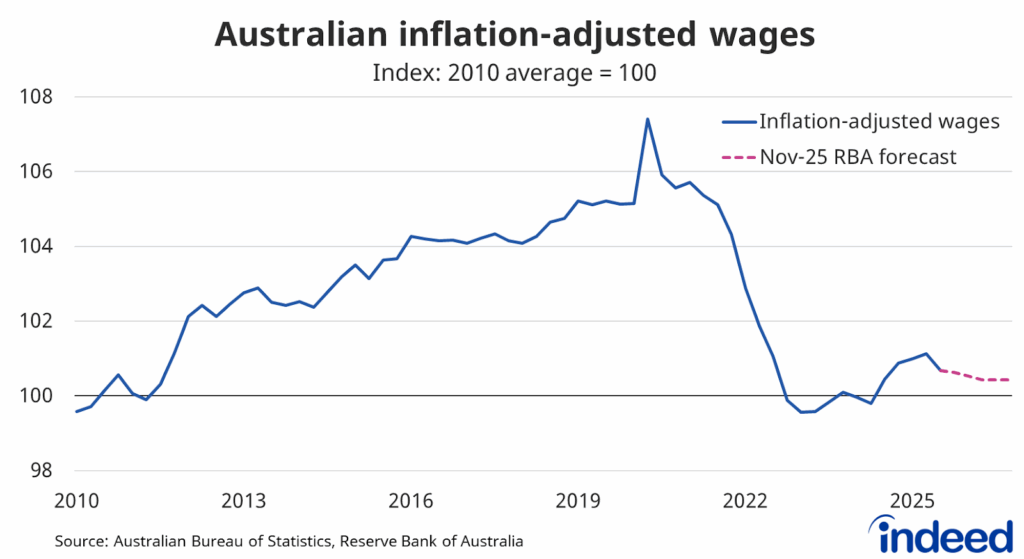
Australian wages rose 3.4% over the past year, easing from a peak of 4.3% in late 2023, and continuing what has been one of the strongest periods for wage growth since the global financial crisis. Normally, that’d be cause for celebration, but not when inflation peaked at 7.9% and finished 2025 at 3.7%.
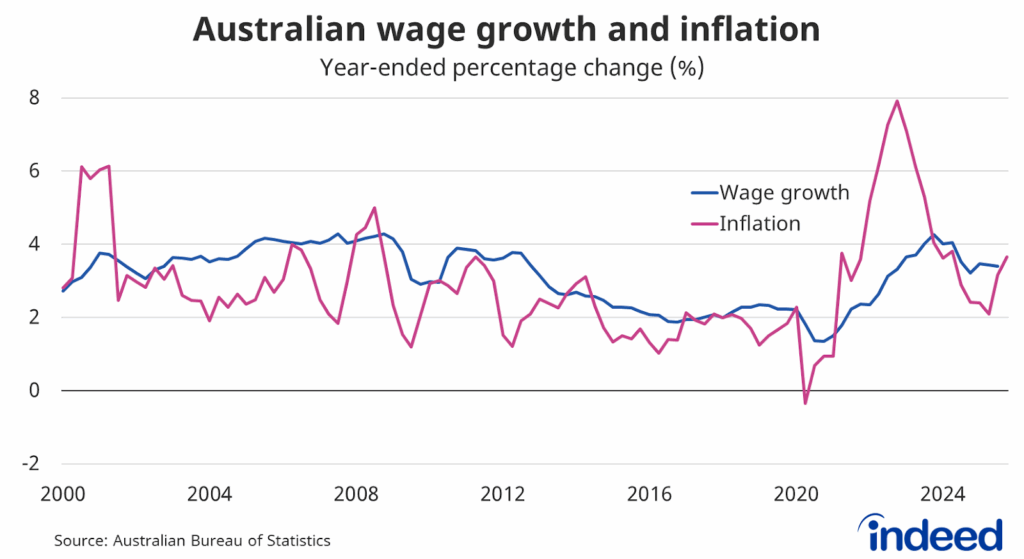
Australian salary earners remain stuck on a treadmill, going nowhere fast. Adjusted for inflation, Australian wages remain 6.3% below their peak, leaving the purchasing power of wages and salaries no higher than it was in 2011.
The bad news is that inflation-adjusted wages are unlikely to improve in 2026, according to the latest forecasts from the RBA. That underscores both the severity of the cost-of-living crisis and the slow pace of recovery. A full recovery won’t happen overnight, and evidently it won’t happen this year either. Instead, it could possibly be 5 to 10 years away.
Productivity growth remains disappointing
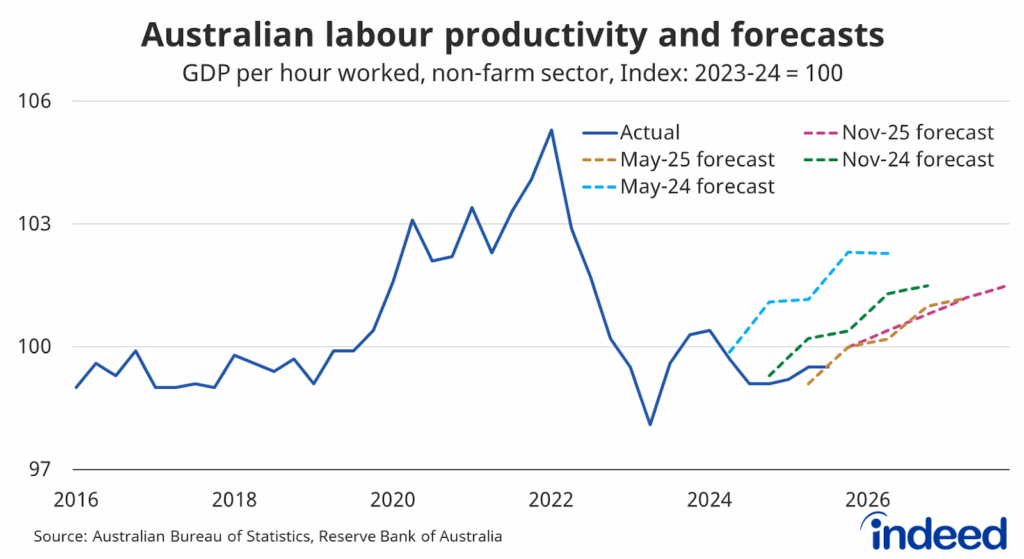
Australian labour productivity, measured by GDP per hour worked, continued to disappoint throughout 2025. After climbing just 0.4% over the past year, labour productivity remains 5.5% below its March quarter 2022 peak. Remarkably, labour productivity first reached its current level around nine years ago.
Labour productivity is expected to rebound over the next two years, according to the latest forecasts from the RBA. However, that was also expected this time last year. And the year before. And the year before that. Policymakers are nothing if not optimistic.
The long-term slowdown in productivity growth has been attributed to factors ranging from an ageing population and reduced business dynamism to reduced technological progress and even hangover impacts from the global financial crisis.
The post-pandemic decline has more commonly been attributed to compositional changes in employment towards lower-productivity industries (reflecting the expansion of the healthcare & social assistance industry), supply-chain disruptions, subdued business investment and low levels of competition across many industries. Even remote work could be a factor.
Certainly, industry composition contributes to this problem. Labour productivity in non-market industries, such as healthcare & social assistance and education, is 8.1% below its peak, compared with 3.2% below peak levels for market industries. With recent employment gains concentrated in non-market industries, overall productivity has suffered. But even so, productivity growth in those market industries is nothing to celebrate.
Whatever the source of Australia’s dismal productivity performance might be, reversing it will be critical to improving wages, living standards and the nation’s long-term economic health. The federal government acknowledged this at its three-day Economic Reform Roundtable in August, where productivity was a prominent focus.
Many policymakers and business leaders have pinned their hopes on artificial intelligence (AI) to usher in a productivity revolution. So far, that hasn’t happened, and there is no clear evidence that generative AI tools have lifted productivity growth, with forecasts revised down consistently in recent years.
AI adoption continues to surge
Even so, adoption of AI tools continued throughout last year, and generative AI will inevitably be one of the most significant labour market talking points in 2026.
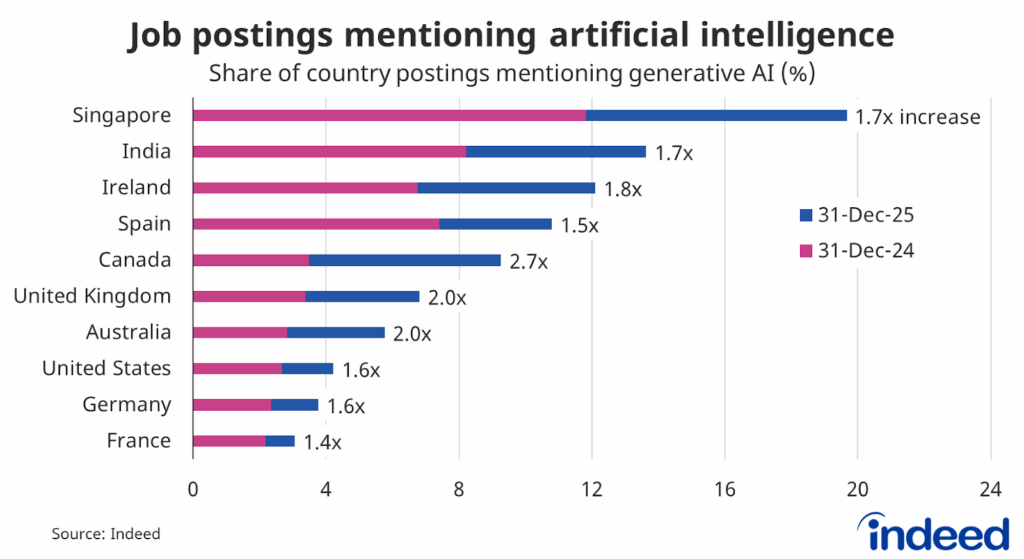
By the end of last year, 5.8% of Australian job postings mentioned artificial intelligence in their job descriptions – primarily reflecting demand for AI-related skills – up from 2.8% a year earlier. Growth of that nature has been far from unusual, with most of Indeed’s major markets experiencing similar trends.
Adoption rates vary by country, reflecting differences in industry composition, technological investment and government policy. Australia is tracking broadly in line with our global peers, such as the United States and the United Kingdom, with regards to recruitment metrics.
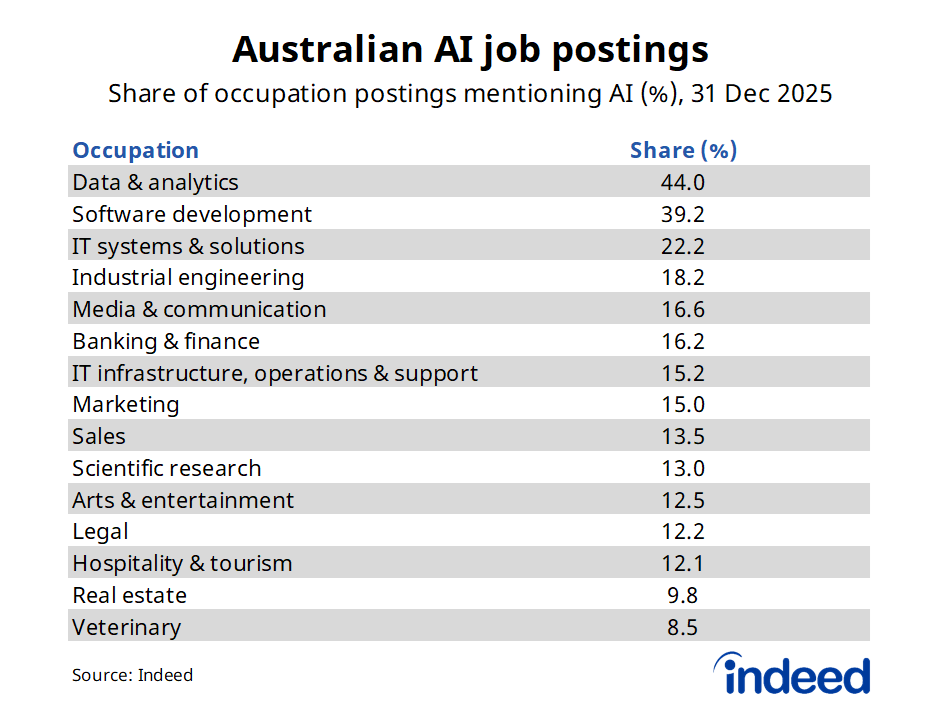
Adoption rates also vary by occupation. By the end of last year, 44% of postings in data & analytics and 39% of postings in software development mentioned artificial intelligence in their job descriptions. Both of these occupation categories feature jobs that involve developing and training AI-related tools.
Other major adopters of AI include IT systems & solutions (22.2%), industrial engineering (18.2%), media & communications (16.6%) and banking & finance (16.2%). In many of these roles, mentions relate more to using existing AI tools, rather than developing them.
AI usage became more broad-based last year, with 45% of occupations having an AI share exceeding 5% by year end, compared to just 27% a year earlier. Nevertheless, these AI posting trends are still primarily driven by large employers, with mentions of AI uncommon in job postings by smaller employers.
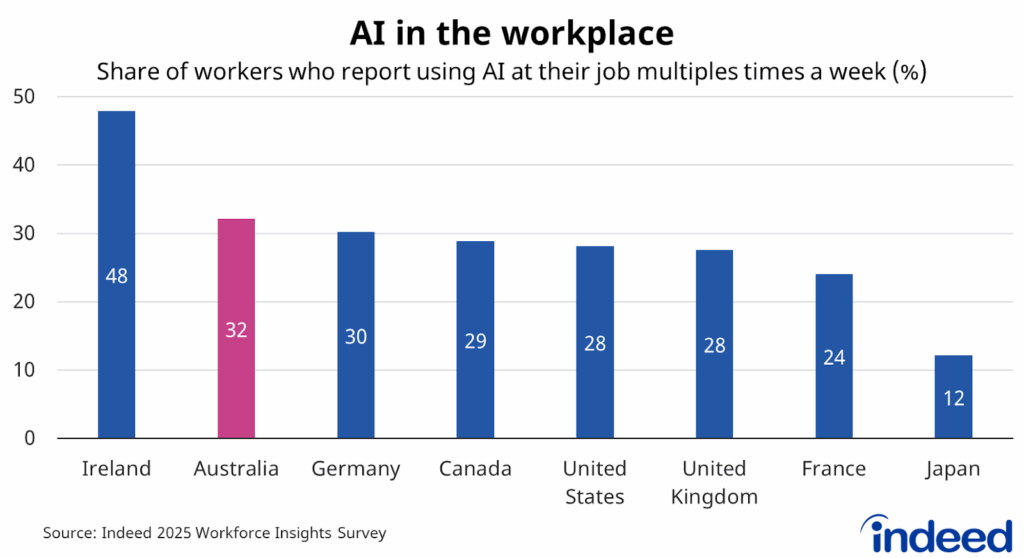
Within workplaces, Indeed’s 2025 Workforce Insights Survey found that 32% of Australian workers reported using some form of AI at work multiple times a week, similar to workers in many other advanced economies. An equal number of respondents (32%) have disengaged from AI, rarely using it for work purposes and seeing little need for training.
Overall, Australian workers hold mixed views on the impact that AI may have on work. Australian respondents, on balance, were not particularly concerned that AI might take their job (28% agreed; 47% disagreed; net score of -19% pts), but they acknowledged that AI may reduce overall job opportunities across the job market (56% agreed; 20% disagreed; net score of +36% pts).
Respondents overwhelmingly said they believed that AI was incapable of performing their job. A survey result that appears consistent with our latest research, which indicated that high-profile AI tools, such as OpenAI’s GPT-4.1 and Anthropic’s Claude Sonnet 4, were only capable of fully performing just 1% of the ~2,900 skills we analysed. Since jobs involve a wide variety of skills interacting with one another, it appears more likely that AI tools will augment workers rather than replace them.
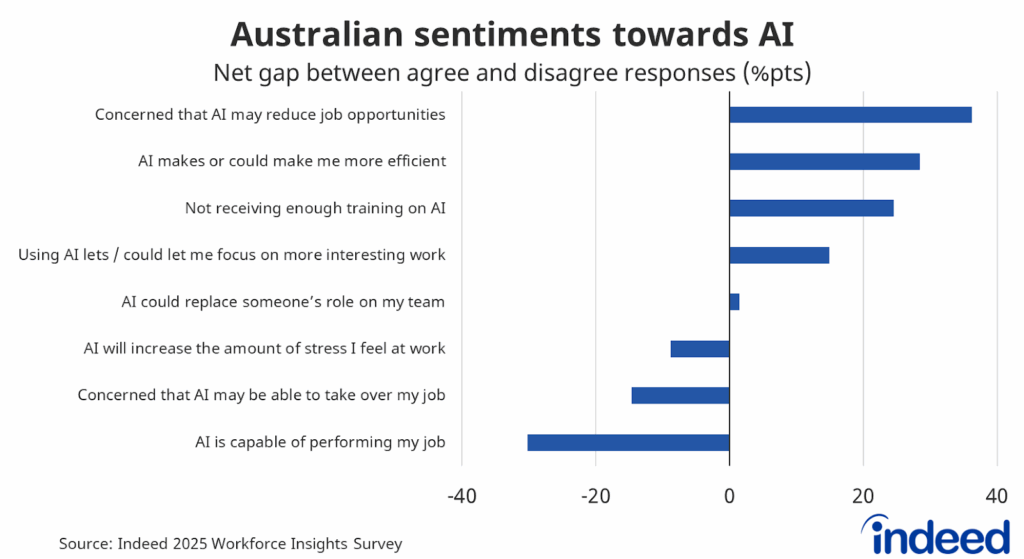
Respondents acknowledged that AI could make them more productive (net score of +28% pts), but also that they aren’t receiving sufficient training (net score of +25% pts). If AI is ever to deliver on the promise of greater productivity, workers will need to be better trained on how to use these tools effectively.
Workers are hopeful that AI will let them focus on more interesting work (net score of +15% pts), but there were mixed views on whether AI will increase workplace stress (28% agreed; 36% disagreed; net score of -9% pts).
Conclusion
While unemployment remains low, cracks have emerged in Australia’s post-pandemic job boom. Softer job growth in healthcare & social assistance exposed ongoing weakness in private-sector job creation. The private sector has found the current economic environment quite challenging, with economic and geopolitical uncertainty making it difficult to plan ahead. The end result has been sluggish and disappointing employment growth.
That could certainly change next year, with forward-looking indicators of labour demand, including Indeed job postings and ABS job vacancies, remaining healthy. There are a lot of jobs waiting to be filled, which typically supports employment growth. Hopefully, that’ll be the case in 2026.
Australian workplaces continue to adopt AI tools, incorporating them into their recruitment processes, products and workflows. That will surely continue in 2026. But the more pressing question is whether this AI-led transformation finally begins to lift productivity. So far, that hasn’t been the case.
Methodology
All job postings figures in this blog post are the index of seasonally adjusted Australian job postings on Indeed, rebased to February 1, 2020, using a seven-day trailing average.
The number of job postings on Indeed, whether related to paid or unpaid job solicitations, is not indicative of potential revenue or earnings of Indeed, which comprises a significant percentage of the HR Technology segment of its parent company, Recruit Holdings Co., Ltd. Job posting numbers are provided for information purposes only and should not be viewed as an indicator of performance of Indeed or Recruit. Please refer to the Recruit Holdings investor relations website and regulatory filings in Japan for more detailed information on revenue generation by Recruit’s HR Technology segment.
This post uses data from the 2025 Indeed Workforce Insights Survey, an online survey conducted for Indeed Hiring Lab by YouGov, of more than 80,000 adults from the US, UK, Germany, France, Japan, Ireland, Australia, and Canada. Sampling was random and representative, with all responses weighted based on age, gender, education, and region in all markets. Fieldwork was conducted during the months of May and June 2025, with a total of n = 80,936 interviews globally, and a minimum of n = 10,000 interviews per market. This sample size provides a margin of error of ±1% at the 95% confidence level within each market.